Loss Prevention Mitigation in Sour Water Stripper (SWS) Cooler Using Process and Computational Fluid Dynamics (CFD) Modelling
Sour water stripping (SWS) units are similar to other process units that can bring many operational challenges to meet target stripped water specifications. Failure of any equipment in the unit leads to unplanned shutdown and hence increases the downtime of the unit. In this study we investigated the outlet nozzle and elbow downstream the finfan cooler as they occasionally leak due to apparently metal thinning. Process simulation using appropriate electrolyte thermodynamic package to predict vapour liquid equilibrium and streams flow rates was used. Subsequently, Computational fluid dynamics (CFD) simulation was use to predict the erosion patterns. To mitigate and prevent unit upset, many option have been recommended to change the operating mode of the finfan cooler so as to circumvent alloy change. The CFD simulation results matched the erosion pattern that caused the loss of wall thickness. Different cases were investigated addressing elbow size, flow regime and elbow angle. The results, however, have indicated that the erosion is unavoidable irrespective of the fluctuation in the throughputs to the unit.
Introduction
The quantities of sour water produced by the process industry worldwide is steadily increasing and this due to the strict specifications of the produced fuels. SWS are used to process sour water effluents to remove of Hydrogen Sulfide (H2S) and Ammonia (NH3) to a target limits specified in the design of such units. Figure 1, illustrates a simplified process description for SWS modelled in this work. All sour water streams from source units are collected in the sour flash drum in order to flash and separate any hydrocarbons impurities. The sour water is then pumped to the top of the stripper column after exchanging heat in the feed effluent exchanger. Sour gases NH3 and H2S are separated in the stripper with the use of the steam introduced by the reboiler. The sour gases from the stripper are cooled in finfan cooler to condense most of the water vapours. In this unit, they are two finfan coolers; one running and one spare. The condensate is recycled to the stripper. The sour gases is then routed to downstream recovery unit. Stripped water is further cooled and routed back to stripped water users within the facilities. The operating conditions is crucial in order to maintain the temperature in the overhead system in the rage between 85- 90°C. This will alleviate the formation of ammonium salts and reduce the water content routed to downstream units. Figure 2 and Figure 3 show the operation performance of the unit in terms of removing both NH3 and H2S. The outlet concentrations of NH3 and H2S were normalized in order to give a more meaningful representation of the operating data for the SWS unit. Both Figure 2 and Figure 3 show that the outlet concentration for NH3 and H2S were controlled post the installation of variable speed drive to control the outlet temperature of the finfan cooler. For more details on the Striped sour water (Product) $$ \therefore \mathrm {即} \mathrm {当} x = 1 \mathrm {时} x = 1 $$ Cooler Feed/effluent exchanger Stripper Sour water (Feed) column Flash drum history of maintenance inspection activities carried out in this unit can be found in Hassan-Beck, et al [1].
$$ \mathrm {型} = \mathrm {n} \times \mathrm {n} $$
Fin-fan cooler
$$ I = I _ {0} + \frac {1}{2} \alpha \left[ V _ {0} - V _ {1} \right] $$
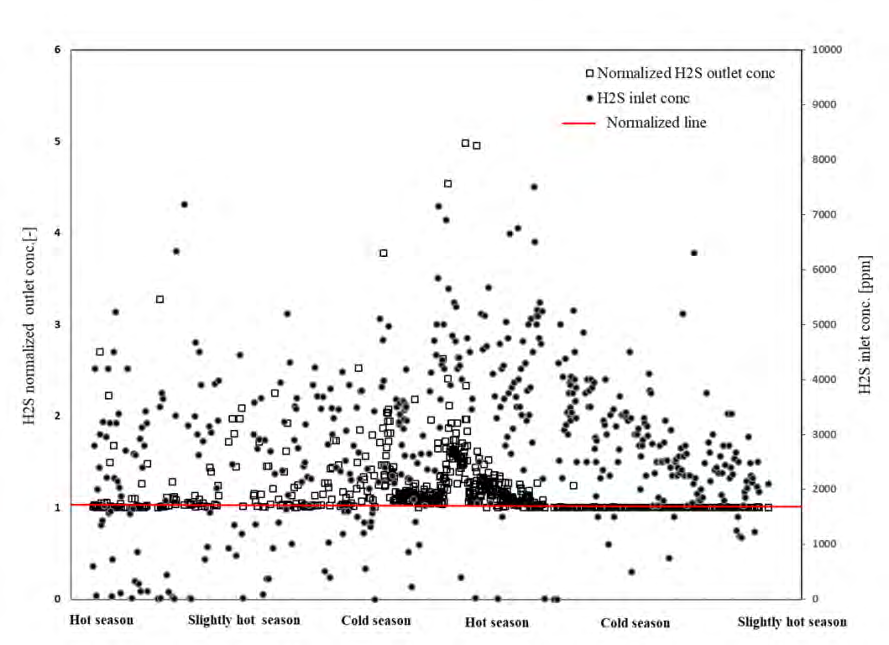
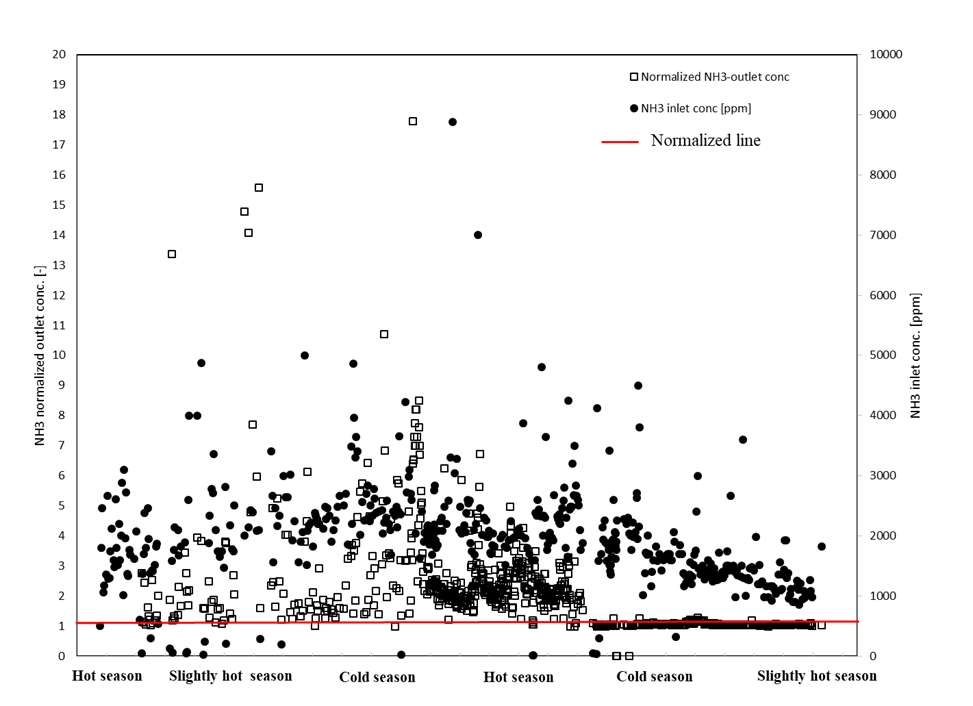
The combination of the NH3 and H2S produces Ammonium Bisulfide (NH4HS) that is known for its high corrosive potential when dissolved in water. The increase of H2S and NH3 concentrations often creates a hostile environment for the piping material. This is exacerbated by the formation of NH4HS and leads to erosion-corrosion issues.
Damin [2] studied NH4HS-induced corrosion at different conditions on different alloys. He reported corrosion rates and factors behind NH4HS formation in air coolers. Cayard [3] reported that industry had been using conservative rule of thumb, for the estimation of NH4HS corrosion. He demonstrated that corrosion rates were far lower and alloy upgrade from carbon steel was an expensive, yet not needed, option. Corrosion in tubes of air-cooled heat exchanger was investigated by Toba [4, 5]. They concluded that air side temperature was the cause of corrosion in the tube side due to the formation of a two-phase regime. Their main recommendation was a better control of operating conditions to avoid corrosion and hence the expensive solution of alloy upgrade. Zhu [6] investigated both experimentally and numerically (CFD) the effects of velocity and NH4HS concentration on the erosion-corrosion potential in a sour water stripping unit. He quantified the thinning of the material in the affected area of the elbows in SWS. He reported a quick increase in the corrosion rates related to high concentration of NH4HS of about 10 wt.% and high liquid velocity.
Despite the erosion-corrosion problems in sour water strippers have been formally addressed in many investigations, the problem is still being experienced at a significant scale in the industry [7, 8, 9, 10, 11, 12, 13, 14]. Hence, further research is warranted to better understand the underlying mechanisms of erosion-corrosion problems through the use of various engineering tools and analytical techniques. This should help establish efficient countermeasures to mitigate Case 1 Case 2 Elbow angle Case 3
45 o Case 4
Case 5
Case 6
Case 7
the erosion-corrosion issue. Insights into the fundamental mechanism of the erosion-corrosion issue can be obtained experimentally, however, it is often resource-intensive and incomprehensive due to the limited number of experiments that can be conducted in practice [15, 16]. To circumvent this limitation, researchers have turned to state-of-the- art computational techniques such as CFD in order to gain critical insight into the intricate phenomena characterizing many industrial processes. As a result, a wide range of studies that involve numerical simulations of hydrodynamics, heat transfer, mass transfer and chemical reactions have been conducted in order to provide conservative and relatively accurate calculations of parameters related to the safety of these processes [6, 17, 18, 19, 20, 21, 22, 23, 24, 25, 26, 27]. Indeed, the use of CFD to study the fundamental mechanics and assess hazardous scenarios has become more practical and achievable and integrant part of the process design cycle [28, 29].
In this investigation, CFD analysis was carried out to explore and analyze the underlying causes of the erosion- corrosion at the overhead cooler in the SWS unit. CFD model of the SWS overhead cooler was first developed and tested with four different inlet flow rates. The emphasis of this CFD study was to look at the impact of the flow on erosion especially in areas of concern like the nozzle outlet, pipe expander, and elbow. Results from these CFD simulations showed detailed flow pattern upstream and downstream of the elbow and its immediate impacts to the pipe wall that induced erosion problems. Then, scenarios to reduce and alleviate erosion were proposed by modifying several parameters:
- Increasing the pipe size.
- Halving the flow rate by splitting the flow downstream of the stripper feeding the running cooler and spare finfan cooler are operational.
- Reducing the elbow angle.
Enlarged pipe to
3" / 4" Half flow rate Figure 4: Mapping the modified cases with combinations of changed parameters. (Original design parameters: size (2 inch/3 inch), elbow angle 90° and full flow rate)) For this purpose, CFD calculations for seven modified cases were conducted. Each case reflects a certain combination of the three above parameters as mapped in Figure 4. Comparisons between the CFD results of the original case and the modified cases were made to quantify the improvement in terms of erosion reduction that was achieved. The following sections discuss in details the CFD model developed for the present study including assumptions used, methodology, geometry and mesh, boundary conditions. CFD results are discussed and analyzed and recommendations are made.
CFD Model Assumptions and Methodology
Assumptions
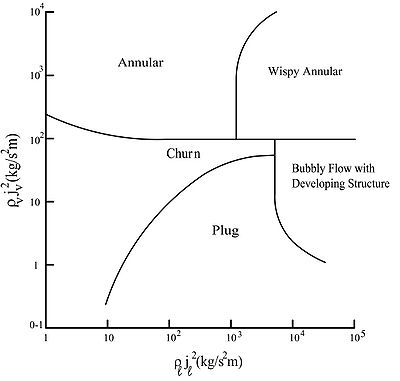
All CFD simulations were performed using ANSYS Fluent CFD software [30]. The following modeling assumptions and simplifications are used in the CFD model: 1. For vertical tubes arrangement, the two phase flow considered on the present study falls under the category of annular flow, based on the flow regime map (see Figure 8) developed by Hewitt [16]. Equations 1 and 2 show the calculations of both gas and liquid components that determine the flow regime map in Figure 8.
$$ \rho_ {l} v _ {l} ^ {2} = 5 7. 9 \tag {1} $$
a.
$$ \rho_ {g} v _ {g} ^ {2} = 6 4 2. 5 \tag {2} $$
b.
Where ρl density of liquid, which is 850 kg/m3, and vl velocity of liquid, which is 0.26 m/s. For the gas component, ρg is 1.471 kg/m3 and vg is 20.9 m/s. These density and velocity values were taken from one of the simulation cases, which will be discussed in more details later. 2. For the annular flow the central core of the flow consists of the gas phase with entrainment of small liquid droplets and a thin layer of liquid coats the pipe walls. Since the majority of fluid flow is in a gaseous form (> 90% by volume fraction) this gas phase flow was modeled in CFD as a continuous flow (primary Eulerian phase) whilst the liquid droplets were modeled as a dispersed flow (secondary Lagrangian phase). The thin layer coat of liquid along the inner wall of the tube was not included explicitly in the CFD simulations to reduce modelling complexity and hence speed up computational time. 3. The movement of liquid droplets follows the primary gas flow. This is called one-way coupling method in CFD whereby the primary phase flow affects the secondary dispersed phase flow, but not vice-versa. Impacts of droplet to droplet interactions and droplets to the primary phase flow were not taken into account. 4. The scope of the present CFD study is limited to the impact of the multiphase flows to erosion only. The mechanism of corrosion is not considered in the CFD model due to unavailability of corrosion model in the current CFD solver. Therefore, in order to facilitate corrosion rates prediction in CFD a separate user code representing accurate expressions for the corrosion model needs to be integrated within the CFD solver. This can be included at a later stage when corrosion-rate expressions are developed in-house in different corrosive environments. 5. Erosion model was included using the standard ANSYS Fluent as part of the Dispersed phase model (DPM) setting [31, 32]. The default empirical correlations that describe the droplet angles of impact to the wall were used. 6. The sizes of liquid droplets were assumed in the range of 10 μm – 100 μm. These size variations were represented in ANSYS Fluent solver using the Rosin-Rommler diameter distribution model.
System Geometry and Computational Mesh
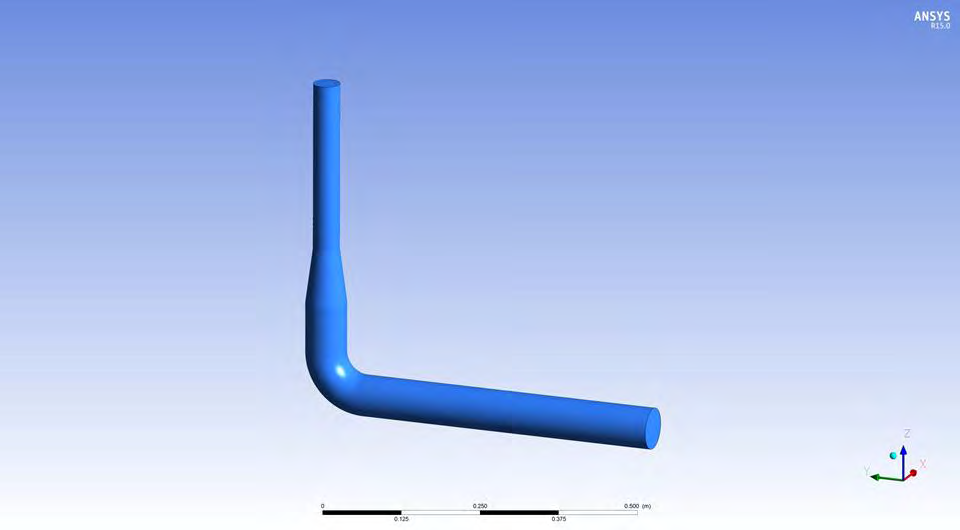
Geometry of the CFD model is shown in Figure 5. It covers the concerned areas where major loss of pipe thickness occurred, which spans from the 2 inch pipe upstream of the expander to the 3 inch pipe downstream of the elbow.
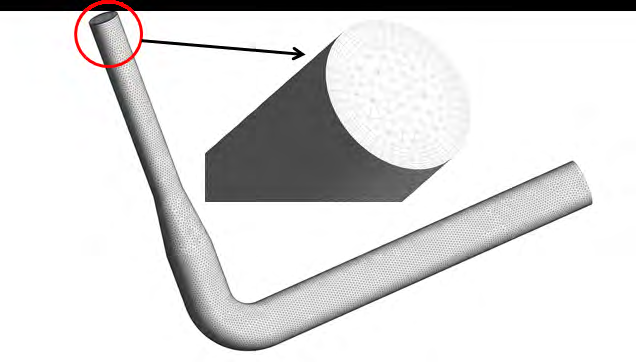
For the CFD model, the flow domain from the inlet through to the outlet has to be discretized into a number of small control volumes where the flow governing equations are solved. In CFD this step is usually termed as mesh generation. Good mesh resolution is required to capture important flow variables, such as velocity, temperature and pressure distribution accurately especially close to the pipe wall to achieve correct turbulence quantities and thermal gradients [33]. For this purpose two different mesh resolutions (i.e. number of computational cells), as listed in Table 1 were generated and tested to check mesh sensitivity and dependency to solution accuracy. Table 1 also shows results from this mesh dependency study with the inlet flow rates taken from Case A, as detailed in the next section. It is clear from Table 1 that the resulting mean gas outlet velocity did not change much even after increasing the number of computational cells by almost 10% and hence can be considered to reach a mesh independent solution. Therefore, in the simulation results described below the medium mesh size (approximately 463 K cells) was used.
Figure 6 illustrates the CFD mesh employed. It has predominantly tetrahedral mesh with boundary layer attached near the wall to capture correct turbulence quantities and flow gradients.
| No | Mesh Case | Total No. of Cells | Predicted Mean Gas Outlet Velocity (m/s) |
|---|---|---|---|
| 1 | Medium | 462,726 | 8.671 |
| 2 | Fine | 505,440 | 8.676 |
Table 1: Mesh dependency study.
Governing Equations
The continuity equation governing the flow in the pipe is written as follows:
ρ $$ \left| \frac {\partial \rho}{\partial t} + \nabla . \left(\rho \vec {\nu}\right) = S _ {m} \right| $$ (3) Where t is time, ρ is density, and v is the velocity vector. The source Sm is the mass added to the continuous phase from the dispersed second phase (e.g. liquid droplets). The flow is also governed by conservation of momentum in inertial reference frame as follows:
ρ ρ ρ ρρ ρ (4)
( ) ( ) ( ) . . g F t ρν ρνν τ ρ ∂ + ∇ = −∇ + + ∂
Where τ̿ is the stress tensor, p is the static pressure, ρ*g and F are the gravitational body force and external body forces (like the ones that arise from interaction with the dispersed phase), respectively.
Boundary Conditions
Table 2 lists four CFD simulation cases with the original pipe sizes (2 inch/3 inch) along with different inlet volumetric flow rates of both gas and liquid phases. Process simulation package and it’s and validation of the model results are detailed in Hassan-Beck, et al. [1]. Table 3 shows all the modified cases with combinations of modified flow rates, pipe diameters and elbow angles. All modified cases used either full or half flow rates of Case A. To use a case that conform to erosion corrosion mechanism, Case A represents the realistic case scenario as the SWS was running during winter time, hence liquid in the finfan cooler was the minimum and gas flow rates were the maximum as compared to other conditions in Cases B and C. These simulations were conducted to see the impacts of the proposed modified flow rates and geometries to erosion patterns and compare them with that of the original geometry and erosion rates.
| Design/Simulation Case | Record Date | Gas Flow Rate (10-3m3/s) | Liquid Flow Rate (10-3m3/s) | |
|---|---|---|---|---|
| 1 | Design | - | 11.39 | 0.327 |
| 2 | A | 4/1/2015 | 30.16 | 0.376 |
| 3 | B | 24/08/2014 | 6.2 | 0.455 |
| 4 | C | 9/4/2015 | 17.8 | 0.425 |
Table 2: CFD Simulation cases and inlet flow rates with original pipe sizes.
| Flow | Pipe Diameter | Elbow Angle | Gas Flow Rate (10-3 m3/s) | Liquid Flow Rate (10-3 m3/s) | |
|---|---|---|---|---|---|
| 1 | Full | 3 inch/4 inch | 90° | 30.16 | 0.376 |
| 2 | Half | 2 inch/3 inch | 90° | 15.08 | 0.188 |
| 3 | Half | 3 inch/4 inch | 90° | 15.08 | 0.188 |
| 4 | Full | 2 inch/3 inch | 45° | 30.16 | 0.376 |
| 5 | Half | 2 inch/3 inch | 45° | 15.08 | 0.188 |
| 6 | Full | 3 inch/4 inch | 45° | 30.16 | 0.376 |
| 7 | Half | 3 inch/4 inch | 45° | 15.08 | 0.188 |
Table 3: Modified cases with modified flow Rates and geometries.
CFD Results
Velocity Field
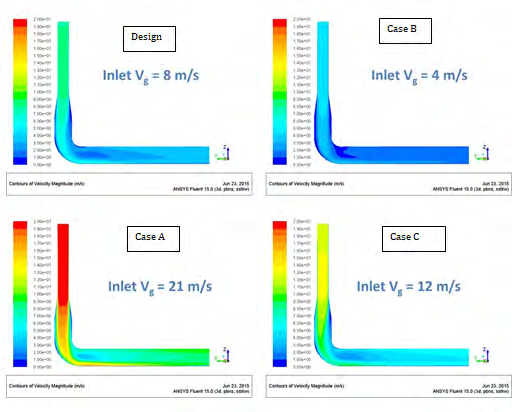
The resulting contours of velocities at the mid-plane of the pipe are shown in Figure 7 for four different flow rates using the original pipe dimension. The upper scale is 20 m/s shown in red color and the lower scale 0 m/s in dark blue.
The inlet gas phase velocity from Case B was only half of that of the design flow case. On the other hand, the inlet gas velocities from Cases A and C were 160% and 50% higher than that of the design flow case, as shown in Table 4. As the gas velocity is a primary mover of the liquid droplets we should expect to see more impacts of the liquid droplets to the pipe wall from Cases B and C.
| Design/ Simulation Case | Inlet Gas Flow Rate (10-3 m3/s) | Inlet Gas Velocity (m/s) | |
|---|---|---|---|
| 1 | Design | 11.39 | 7.9 |
| 2 | A | 30.16 | 20.9 |
| 3 | B | 6.2 | 4.3 |
| 4 | C | 17.8 | 12.3 |
Table 4: Inlet Gas Velocity.
According to the process design guidelines [34], the maximum allowable velocity for the two phase flow lines is given by
122 $$ V _ {\max } = \frac {1 2 2}{\sqrt {\rho_ {m i x}}} (5) $$
max Where ρmix is the density of mixture, kg/m3. Using the law of proportionality the density of mixture can be calculated as $$ \rho_ {m i x} = \frac {\rho_ {v} . Q _ {v} + \rho_ {l} Q _ {l}}{Q _ {v} + Q _ {l}} \tag {6} $$ . . v v l l mix v l Q Q Q Q Where ρ is density and Q volumetric flow rate. Subscripts v and l denoting the vapour and liquid, respectively. Table 5 shows the density of mixtures and corresponding maximum allowable velocities for different flow cases.
As can be seen, the actual velocity in each flow case is still below the corresponding allowable limit. However, it should be noted that a similar empirical correlation to Equation 5, as implemented by the standard API 14E [35], has been subject to ongoing research and many reported that the correlation was overly conservative [35]. For example, an experiment performed by Southwest Research Institute covering a range of operating conditions in the annular mist flow regimes showed that the flow velocity at which the onset of erosion/corrosion occurred was lower than the specified limit provided by the design standard [35].
| A | B | C | |
|---|---|---|---|
| Vapour density, kg/m3 | 1.471 | 1.526 | 1.461 |
| Vapour flow rate,3/hr | 108.584 | 22.331 | 64.1 |
| Liquid density, kg/m3 | 850.104 | 842.882 | 856.6 |
| Liquid flow rate, m3/hr | 1.355 | 1.638 | 1.529 |
| Mixture density, g/m3 | 11.93 | 59.023 | 21.384 |
| Max. Velocity, m/s | 35.3 | 15.9 | 26.4 |
Table 5: Maximum allowable velocity.
Liquid Droplets Impact on Erosion
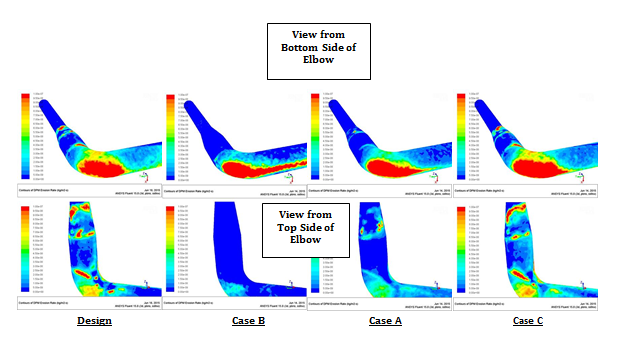
For the annular flow type regime the liquid droplets flow in the core region of the pipe following the primary gas phase movement. At disturbances in the flow stream such as flow separation at the pipe expander and the elbow, direct impact of liquid droplets to the pipe wall has clearly resulted in a marked region of erosion. This is shown evidently in Figure 8, which compares erosion patterns between CFD results of four different flow cases looking from the bottom and the top sides of the elbow. The upper scale in red color represents erosion rate of 1.e-07 kg/m2.s and lower scale in dark blue is 0 kg/m2.s. In this circumstance, accumulation of erosion pattern was directly caused by liquid droplet impact fatigue. CFD results from different flow cases with the original pipe size consistently showed clear marked areas of erosion at the elbow and the upstream pipe expander. These were areas where maximum impact of liquid droplets impingement at the pipe wall occurred following disturbances in the flow stream. This erosion map/pattern matches with the corresponding areas where major loss of wall thickness was experienced on-site, i.e. the pipe expander and the elbow. For the Carbon Steel pipe with density of 7990 kg/m3 the predicted erosion rate at these regions can be converted to approximately 0.4 mm/year.
The scope of the present CFD investigation was limited to the impact of the multiphase flows to erosion only. The mechanism of corrosion was not considered in the CFD model. So although the predicted erosion rate at marked erosion regions was approximately 0.4 mm/year, the actual reading of thickness loss was much higher, accounting to about 2 mm/year at the elbow and 1.5 mm/year at the pipe expander, as reported in [36]. This can only be explained by a combined factor of erosion and corrosion.
The phenomenon of erosion–corrosion is always associated with mechanical removal of the protective surface film resulting in a subsequent corrosion rate increase via either electrochemical or chemical processes. The mechanical damage by the impacting fluid imposes disruptive shear stresses on the material surface and/or the protective surface film. In the current study, erosion–corrosion is further enhanced by the impact of liquid droplets entrained by the gas flow, exacerbated by the presence of hydrogen Sulfide and the formation of iron Sulfide scale, which then removed due to erosion [37, 38, 39]. This will be repetitive process (vicious cycle) of repair and removal of scale, which will accelerate the rate of corrosion and thus lead to severe metal thinning.
Modified cases
Figure 9 shows comparisons of velocity contours at the mid-plane of the pipe between the original and modified cases. The top row shows the results with the full flow rate of Case A whereas the bottom row only with half of that flow rate, i.e. flow splits equally to both running and spare finfan cooler. The upper scale in red color represents 20 m/s and the lower scale in dark blue 0 m/s. increasing overall pipe size by 1 inch has decreased the velocity by a factor of 2.4 approximately. Halving the flow rate further decreased the velocity by half in proportion. Although the flow pattern looks similar this significant decrease in gas velocity certainly helped in reducing the level of erosion, as clearly depicted in Figure 10 and Figure 11.
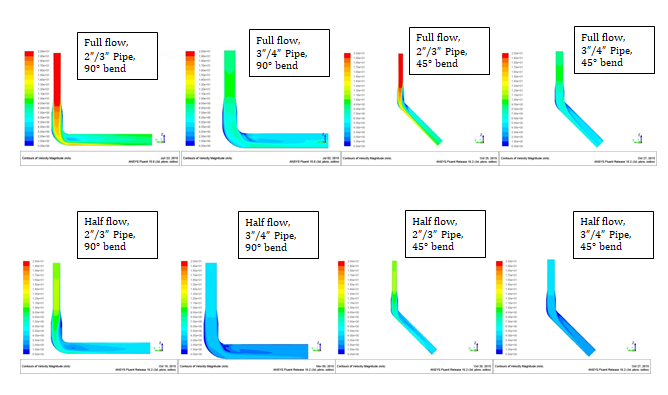
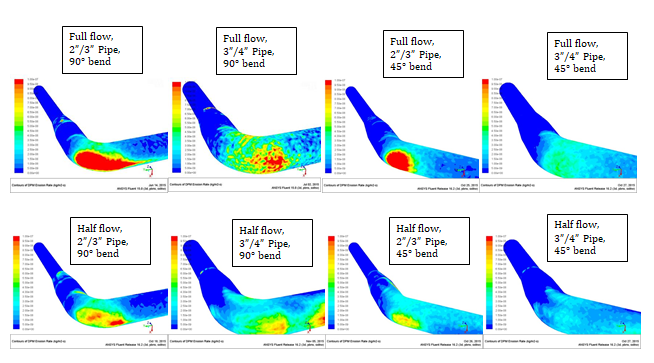
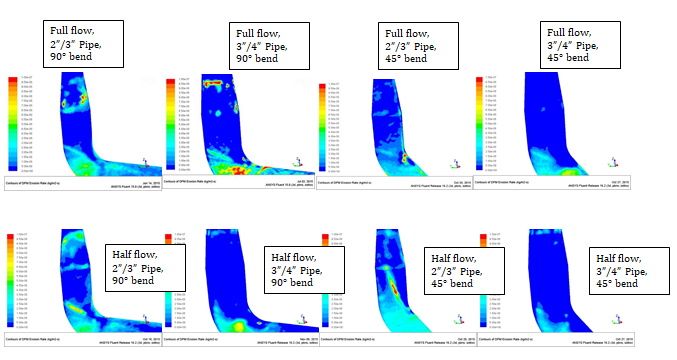
Figure 10 shows erosion patterns looking from the bottom side of the elbow and Figure 11 from the top side of the elbow. As in Figure 12, erosion rates shown in Figure 10 and 11 have the upper scale in red color representing 1.e-07 kg/m2.s and the lower scale in dark blue is 0 kg/m2.s. Also, in Figure 10 and 11, the top row shows the results with the full flow rate of Case A whereas the bottom row only with half of the flow. Looking at the comparison between the original and the larger pipe size case, it is obvious that significant parts of erosion zones have been eliminated at the elbow albeit the presence of much smaller patches of red color. So, the inherent flow disturbances at the elbow always caused direct droplets impingement at the pipe wall that resulted in erosion, although at a smaller level with larger pipe dimension [41].
Reducing the bend angle to 45° alone did not alter much of the erosion pattern and significant region with high erosion rates (red color) at the elbow still appeared, as clearly shown in Figure 11. However, a combination of pipe size enlargement and elbow angle reduction produced the best results in terms of erosion reduction. With this combination, the red colored high erosion zones at the elbow were completely removed.
Halving the flow rate certainly helped reduce the erosion rates further. However, as with the full flow cases, individual change in pipe size enlargement or bend angle reduction along with half flow rate could not remove the high red erosion zones entirely. The best modification results came from the combination of pipe enlargement and elbow angle reduction with half flow rate. The erosion rate was reduced from 1.e-07 kg/m2.s to 1.e-08 kg/m2.s on average, or from 0.4 mm/year to 0.04 mm/year, which is a degree of magnitude improvement in terms of erosion reduction.
Conclusions
The flow conditions and behavior in the piping system downstream the finfan cooler was simulated. Process modelling of the unit has enabled determining the vapour and liquid flow rates downstream the finfan cooler. Vapour velocity and flow regime were determined using the CFD modelling. Clear signs of flow turbulence and erosion as a result of vapour flow as a continuous phase entrained by liquid droplets. More importantly, by comparing the erosion rate between the design case and Case A, the erosion was unavoidable irrespective of the flow rate. Mitigation of erosion in the piping system from operating point of view is to reduce velocity to a level below which the erosion will be minimized in the piping system in question. Furthermore, based on CFD results, a modified sizing and possibly material of construction to ease any further failure is warranted. The following conclusions can be made from the present CFD study:
- The flow regime was of the annular mist type whereby the primary phase was in the form of gas vapour and the secondary liquid droplets were dispersed in the core region of the pipe following the gas flow. At disturbances in the flow stream such as flow separation at the pipe expander and the elbow, direct impact of liquid droplets to the pipe wall has clearly resulted in a marked region of erosion.
- Increasing pipe diameter by 1 inch has decreased the overall velocity by a factor of 2.
Acknowledgments
Authors acknowledge the financial support from Khalifa University of Science and Technology under Award No. CIRA- 2019-031 and the support from Khalifa University of Science
and Technology under award No. RCII-2018-024.
References
-
Beck HH, Firmansyah T, Suleiman MI, Matsumoto T, Musharfy MAL, et al. (2019) Failure Analysis of an Oil Refinery Sour Water Stripper Overhead Piping Loop: Assessment and Mitigation of Erosion Problems. Engineering Failure Analysis 96: 88-99.
-
Damin DG, McCoy JD (1978) Prevention of corrosion in hydrodesulfurizer air coolers and condensers. Mater Perform 17 (12): 23-26.
-
Cayard MS, Giesbrecht WG, Hocart RJ, Kane DR, Lagad V (2006) Prediction of Ammonium Bisulfide Corrosion and Validation with Refinery Plant Experience. Corrosion, San Diego, California, USA.
-
Toba K, Kawano K, Yamamoto K, Arakawa Y (2005) The Application of Process Analyses to Prevent Corrosion in Sour Water Stripper Overhead Cooler Tubes. Corrosion, Houston, Texas, USA.
-
Toba K, Kawano K, Sakai J (2009) Development of a new design for corrosion prevention in NH4HS environments. Corros Eng 58 (12): 441-447.
-
Zhu M, Sun L, Ou G, Wang K, Kuanxin W, et al. (2016) Erosion-corrosion failure analysis of the elbow in sour water stripper overhead condensing reflux system. Engineering Failure Analysis 62: 93-102.
-
Parrott R (2014) Potential hazards from undetected corrosion in complex equipment: a case study of the destructive separation of an offshore heat exchanger. Engineering Failure Analysis 44: 424-440.
-
Yang EN, Fu CM, Dong C, Qu S, Tian FJ, et al. (2015) Failure analysis of a leaked oil pipeline. Case Studies in Engineering Failure Analysis 4: 88-93.
-
Ossa CI, Boswell B, Davies IJ (2015) Pipeline failures in corrosive environments- a conceptual analysis of trends and effects. Engineering Failure Analysis 53: 36-58.
-
Oua G, Wanga K, Zhan J, Tang M, Liu H, et al. (2013) Failure analysis of a reactor effluent air cooler. Engineering Failure Analysis 31: 387-393.
-
Berrouk S, Huang A, Bale S, Thampi P, Nandakumar K (2017) Numerical simulation of commercial FCC regenerator using Multiphase Particle-in-Cell methodology (MP-PIC). Advanced Powder Technology 28(11): 2947-2960.
-
Mota-Martinez MT, Althuluth M, Berrouk AS, Kroon MC, Peters CJ (2014) High pressure phase equilibria of binary mixtures of light hydrocarbons in the ionic liquid 1-hexyl-3-methylimidazolium tetracyanoborate. Fluid Phase Equilibria 362: 96-101.
-
Pole Y, Gu SG, Gupta JP (2021) A preliminary explore to the forced ventilation on the toxic gas release/ dispersion and the hazard mitigation within a petrochemical plant. Journal of Loss Prevention in the Process Industries 69: 10434.
-
Jiao Y, Wang ZY, Chen WJ, Liu J, Liu X, et al. (2021) Backtracking and prospect on LNG supply chain safety. Journal of Loss Prevention in the Process Industries 71: 104433.
-
Chakrabarty A, Mannan S, Cagin T (2015) Multiscale Modeling for Process Safety Applications. 1st (Edn.), Butterworth-Heinemann, pp: 1-444.
-
Shen R, Jiao Z, Parker T, Sun Y, Wang Q (2020) Recent application of Computational Fluid Dynamics (CFD) in process safety and loss prevention: A review. Journal of Loss Prevention in the Process Industries 67: 104252.
-
Nam C, Lee Y, Park G, Bo WL, Jeong N, et al. (2018) Analysis of Pipe Failure Period Using Pipe Elbow Erosion Model by CFD. Korean Chemical Engineering Research 56(1): 133-138.
-
Sun L, Ou G, Wang K, Wang K, Sun Y, et al. (2016) Erosion corrosion failure analysis of the elbow in sour water stripper overhead condensing reflux system. Engineering Failure Analysis 62: 93-102.
-
Cheng N, Zhang N, Li Z, Dou Y, Cao Y (2017) Erosion Failure of Horizontal Pipe Reducing Wall in Power- Law Fluid Containing Particles via CFD-DEM Coupling Method. Journal of Failure Analysis and Prevention 17(5): 1067-1080.
-
Li C, Huang Q, Yan S, Haung T (2014) Parametric CFD studies on erosion in 3D double elbow. International Journal of Engineering Systems Modelling and Simulation 8(4): 264-272.
-
AS Berrouk, D Laurence, JJ Riley, DE Stock (2007) Stochastic modelling of inertial particle dispersion by subgrid motion for LES of high Reynolds number pipe flow. Journal of Turbulence 8: 1-20.
-
AS Berrouk, D Laurence (2008) Stochastic modelling of aerosol deposition for LES of 90 bend turbulent flow. International Journal of heat and Fluid Flow 29(4): 1010-1028.
-
Lin C, Hung F, Yuh M (2014) Predictions of Hydrodynamics characteristics and corrosion rates using CFD in the piping systems of pressurized-water reactor power plant. Annals of Nuclear Energy 65: 214-222.
-
Liang G, Peng X, Xu L (2013) Erosion-corrosion of Carbon Steel Pipes in oil Sands Slurry Studied by Weight- Loss Testing and CFD simulation. Journal of Materials Engineering and Performance 22(10): 3043-3048.
-
Du Y, Zhang L, Berrouk AS (2019) Exergy Analysis of Propane Dehydrogenation in a Fluidized Bed Reactor: Experiment and MP-PIC Simulation. Energy Conversion and Management 202: 112213.
-
Du Y, Yang Q, Berrouk AS, Chaohe Y, Al Shoaibi A (2014) Equivalent Reactor Network model for simulating the air gasification of polyethylene in a Conical Spouted Bed Gasifier. Energy & Fuels 28(11): 6830-6840.
-
Wu JS, Liu Z, Hu XF (2020) Source term estimation of natural gas leakage in utility tunnel by combining CFD and Bayesian inference method. Loss Prevention in the Process Industries 68: 104328
-
Hansen OR, Middha P (2008) CFD-based risk assessment for hydrogen applications. Process Safety Progress 27(1): 29-34.
-
Namboothiri N, Nandu V, Soman AR (2018) Consequence assessment of anhydrous ammonia release using CFD- probit analysis. Process Safety Progress 37(4): 525-534.
-
ANSYS CFX-Pre user’s guide release.
-
Gan J, Zhao H, Berrouk AS, Yang C, Shan H (2012) Impact of the drag law formulation on the predicted binary- particle segregation patterns in a gas-solid fluidized bed. Powder Technology 218: 69-75.
-
Wu CL, Nandakumar K, Berrouk AS, Kruggel-Emden H (2011) Enforcing mass conservation in DPM-CFD models of dense particulate flows. Chemical Engineering Science 174(1): 475-481.
-
Berrouk AS, Lai ACK, Cheung ACT, Wong SL (2010) Experimental Measurement and Large Eddy Simulation of Expiratory Droplet Dispersion in a Mechanically Ventilated Enclosure with Thermal Effects. Build Environ 45(2): 371-379.
-
API 932-B (2019) Design, Material, Fabrication, Operation, and Inspection Guidelines for Corrosion Control in Hydroprocessing Reactor Effluent Air Cooler (REAC) systems. 3rd (Edn.), IHS Markit Standards Store.
-
API Recommended Practice 5s71, Section 5.0, Refining Industry Damage Mechanisms, 5.1.1.2 Ammonium Bisulfide Corrosion.
-
Svedeman SJ (1994) Criteria for Sizing Multiphase Flow lines for Erosive/Corrosive Service. SPE Prod & Fac 9(1): 74-80.
-
Adewale RA, Berrouk AS, Dara S (2015) A process simulation study of hydrogen and sulfur production from hydrogen sulfide using the Fe-Cl hybrid process. Journal of the Taiwan Institute of Chemical Engineers 54: 20-27.
-
Fouad WA, Berrouk AS (2012) Prediction of H2S and CO2 Solubilities in Aqueous Triethanolamine Solutions Using a Simple Model of Kent-Eisenberg Type. Industrial & Engineering Chemistry Research 51: 6591-6597.
-
Althulth M, Berrouk AS, Kroon MC, Peters CJ (2014) Modeling solubilities of gases in the ionic liquid 1-ethyl-3-methylimidazolium tris (pentafluoroethyl) trifluorophosphate using the Peng-Robinson equation of state. Industrial & Engineering Chemistry Research 53: 11818-11821
-
Wallis GB (1969) One Dimensional Two-Phase Flow. Ney York: McGraw-Hill.
-
Berrouk AS, Stock DE, Laurence D, Riley JJ (2008) Heavy particle dispersion from a point source in turbulent pipe flow. International journal of multiphase flow 34(10): 916-923.
- Nigeria’s Vulnerability in the Face of Global Energy Policy
- A Simulation Study of Investigation of Optimum Oil Production Performance by Applying Various Gas Injection Methods in Oil Reservoir
- Characterization of Permo-Triassic Reservoirs through Thermal Maturity Assessment of Westphalian Source Rocks in the Cheshire Basin
- Influence of Microwax on the Rheological and Thermal Behaviour of a Wax Crude Oil
- Real-Time Monitoring and Performance Optimization of Steam Injection in Heavy Oil Reservoirs Using Fiber Optic Sensing and Integrated Predictive Simulation Models
- Rapid On-Site Determination of the Total Petroleum Hydrocarbon Content of Soils by Handheld Fourier Transform Near-Infrared Spectroscopy: Development of a Global, Site- and Scanner- Independent Calibration Model