Environmental Issues of Transient Behavior
We are currently witnessing a high-rate of exploitation of oil fields at the stage of declining production. This decline is a result of the depletion of oil fields, which leads to the use of electric submersible centrifugal pumps (ESP) with dynamic head below saturation pressure. In this operating mode, the ESP’s efficiency deteriorates, leading to the overheating of its working elements during operation. The boiling of water contained in the wellstream and salt deposition can take place in an overheated pump. This, in turn, can lead to a premature failure of the centrifugal pump and reduce the economic viability of this oil production method. To eliminate premature failure, such units must be transferred to an operating mode with periodic shutdowns. Yet, the planning of trip-out and restart time schedules is performed in the absence of a proper theoretical justification. Such planning often leads to ESP failures due to the reduction of the electric resistance of cable lines or salt deposition. To prevent salt deposition, oil production companies use different chemicals, which are pumped into the hole annulus and are expected to stop salt deposition when propelled into the pump pot. Chemical treatment practice shows that these reagents perform poorly and may not prevent salt deposition at all. In reality, chemical compounds can damage downhole equipment and its structural elements. Long-term use of these reagents may lead to ecological disaster – the contamination of productive formations and confined groundwater beds. This work investigates the possibility of ESP operation in periodic mode without salt deposition and the exploitation of oil fields without the application of chemical reagents. The development of a periodic operation method allowing for ESP operation without salt deposition could eliminate the use of reagents in oil production and thereby reduce the risk of ecological disasters.
The Periodic Operation
The periodic operation of electric submersible pumps is a forced measure during oil well operation and, from the standpoint of thermodynamics, is represented by a series of transient processes involving heat transfer from a source inside the equipment assembly [1, 2, 3]. Figure 1 shows the variation trends of current strength, pump suction pressure and submersible motor load in periodic operation mode.
This mode is referred to as “short-term periodic operation,” in which, over the course of an hour, the unit runs for 7 minutes and stays idle awaiting accumulation for 53 minutes. In this mode, the ESP suction pressure at which pumping should be performed is unknown and how such frequent stops and startups influence the pump’s thermal behavior is unclear.
Why centrifugal pumps fail due to salt deposition or a reduction in the electric resistance of the “cable-motor” system to 0 milliohm also remains a mystery.
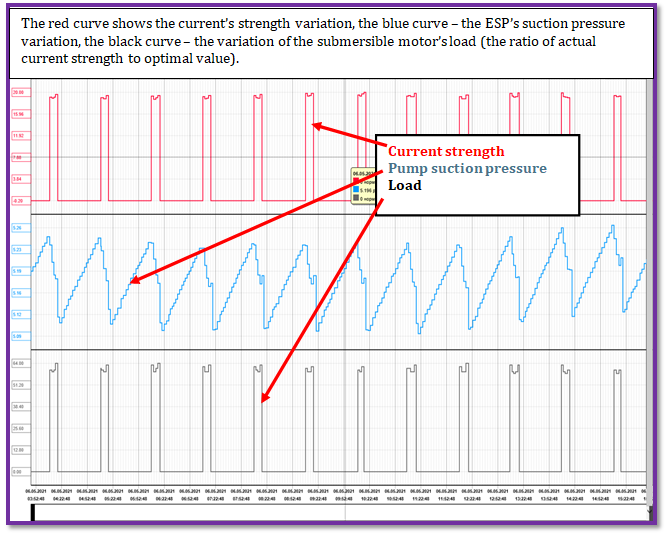
Figure 1: The “status list” dated May 6, 2021, shows the ESP’s shutdowns and restarts. The pump’s suction pressure Рпр (see Figure 1) changes from 5.1 MPa to 5.26 MPa. The rundown time is about 7 minutes, while accumulation time is less than 53 minutes.
A Detailed Record
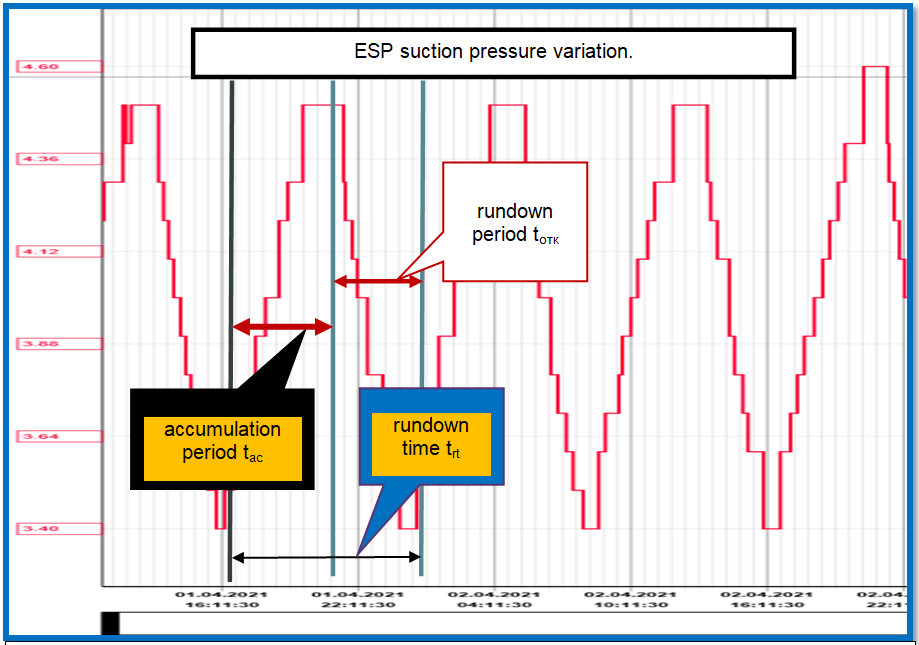
A detailed record of suction pressure variations of the centrifugal pump running in a different well is shown in Figure 2. The pump’s suction pressure changes from 3.4 MPa to 4.5 MPa. Let’s denote the rundown time as trt, and the accumulation time as tac. As the ESP starts up, the pump’s temperature is ТI; prior to the ESP’s stop – Тrt.
According to Gareev АА, Aleksandrov АА, Grigoryev B [1, 2, 3, 4, 5], the generation and propagation of heat in a centrifugal pump represents an energy dissipative process in the pump stages (and in the submersible motor as well). The intensity of heat generation depends on power input to the pump and the pump’s efficiency. The study Gareyev AA [6] shows that the presence of gas in the mixture substantially reduces the pump’s efficiency. The studies of failed units show that the highest temperature rise takes place in the first pump section; therefore, let’s examine the behavior of this section and assume that the pump efficiency therein is constant and depends only on the content of gas in the mixture.
During the Rundown
During the rundown of fluid in the well, ESP temperature increases from ТI to Тrt Gareev АА [7, 8]. If we assume that ТI nearly matches the gas-fluid mixture temperature at the centrifugal pump’s suction, it can be calculated on the basis of a known geothermic gradient in the wellbore, which is equal to = 0.03 оC/m. The unknown temperature Тrt can be determined on the basis of certain technical considerations: for example – the pump’s temperature cannot exceed the boiling point of associated water and the maximum working temperature of the cable extension attached to the pump.
rt b cab Ò Ò Ò < < (1)
where Тb – associated water boiling point at the pressure of Psp, the permissible operating temperature of the cable extension Tcab is determined by experiment by studying the permissible leakage current value depending on the cable extension’s temperature.
Thus, in planning periodic operation mode, it is essential to learn how to operate a centrifugal pump in such a way so as to eliminate salt deposition and protect the flat section of the cable line against overheating.
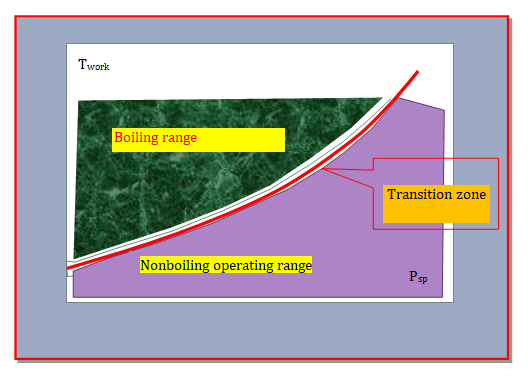
Figure 3: Oilfield water boiling point vs. pressure Рsр – ESP suction pressure, Тwork – temperature inside the pump.
Figure 3 shows the plot of oilfield water boiling point [9] vs. pressure inside the centrifugal pump at constant saturation pressure, gas factor and WCO values. As the fluid pressure continues to grow, the boiling point increases and only slightly depends on the concentration of dissolved salts. Transition of the pump temperature from the oilfield water “nonboiling region” to the boiling range is characterized by the presence of a transition zone. The width of the transition zone shown in Figure 3 is conditioned by the minor dependency of the water boiling point at the given pressure on the concentration of dissolved salts (not exceeding 2-3оС) [10].
During ESP operation within the oilfield water boiling range, the salt deposition process begins. In this mode, the pump’s service life depends on the content of water in the wellstream: the more the water, the lower the MTTF.
The pump’s suction pressure can be determined on the basis of “pump starvation” – hydraulic closure of the centrifugal pump (say, during transition from constant duty to periodic mode) [11].
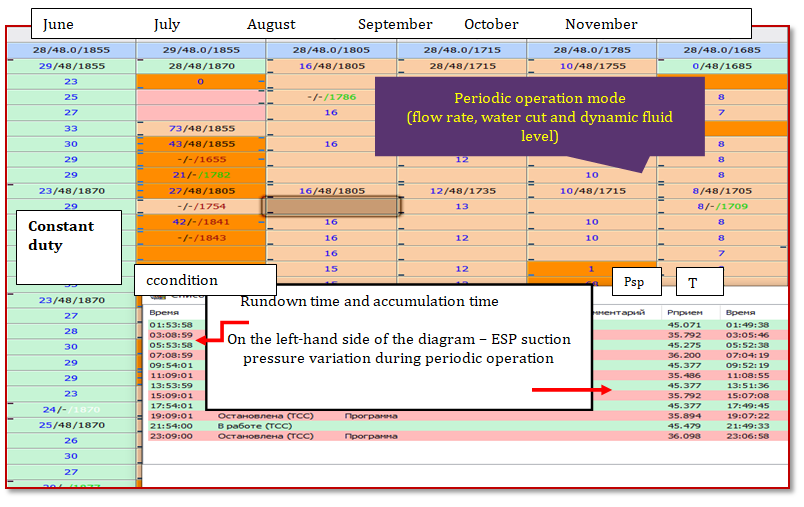
Figure 4: Transition of the ESP unit from constant operation duty to periodic mode in the month of June. The pump’s suction pressure drops from 45.4 atm to 35.8 atm. The rundown time is 1h 15 min, the fluid accumulation time is 2 h 16 min. LCM 4, CM 4. Information on pump operation is provided in the Stock Flow software. Until the beginning of July, the ESP unit was running in constant duty with a flow rate of 30 m3/d at a dynamic fluid level of 1,870 m. Producing water cut was 48%. Starting from early August, the unit was transferred to periodic operation mode: accumulation time (downtime) – 2 h 45 min, running time – about 1 h.
Figure 4 shows the ESP’s operational process in constant duty in the month of June with further switch-over of the unit to periodic mode early this past July. That said, transition to periodic mode is a compulsory measure due to an imbalance between the pump’s delivery and the productive strata. Let’s choose the pump suction pressure Рsр from the operational data:
( ) . . . * * sp mix v d v d Ð g Í Í ρ = − (2)
where Нd.v. – vertical depth of the dynamic fluid level; Нv.d – vertical depth of the ESP location in the well; mix ρ – density of the mixture; g – gravity acceleration.
Calculation of periodic operation mode Let’s calculate the pump’s temperature at pump starvation pressure [1, 2, 3, 4, 5] using the equation: Tw = Trt [equation]
(3) where: Tw– temperature on the pump surface;ϕ -share of free gas at ESP suction [6]; Tf– temperature of the liquid-gas mixture at ESP suction; В – share of water in the wellstream; Рsat.p – bubble-point pressure; Рsр – ESP suction pressure; R2 – ESP body radius, qo– specific power rating; h – head generated by one pump stage; Г – gas factor; ∝– coefficient of heat transfer from the pump to the liquid-gas mixture inside the pump; th δ – thickness of the gas blanket on the ESP surface in the well [10]; heat-conductivity factor of the gas blanket on the ESP surface [12]; Рatm – atmospheric pressure, th γ - coefficient of thermal conductivity Let’s configure the data (from Figure 4) in a tabulated form for easier calculation (Table 1).
| Data | Designation | Unit of measurement | Value |
|---|---|---|---|
| Submersible motor power intake | Ns.m. | W | 15,000 |
| Motor efficiency | hd | decimal fraction | 0.835 |
| Pump efficiency | hdec | decimal fraction | 0.34 |
| Number of pump stages | n | number | 270 |
| Radius of a centrifugal pump stage | Rcps | m | 0.05 |
| Height of a centrifugal pump stage | ∆ | m | 0.045 |
| Number of expected cycles | n | units of measurement | 24 |
| Head of one stage | h | atm | 0.3 |
| Producing water cut | В | Decimal fractions | 0.66 |
| Power density | q 0 | W/m3 | 131,657 |
| Saturation pressure | Р sat.h. | atm | 94 |
| Pump suction pressure | Р sp | atm | 45 |
| Well flow rate under daily measurement | Q l | m3/day | 9.6 |
| Gas factor | Г | m3/m3 | 103 |
| Gas content in the wellstream | ϕ | Decimal fractions | 0.37 |
| Gas heat-conductivity factor | γ | W/(m*K) | 5 |
| Heat-transfer factor in the pump stage | ∝ | W/(m2*К) | 3,800 |
| Gas blanket thickness | d th | m | 0.001 |
| Temperature at pump suction | T f | оК | 67 |
| Temperature on the pump surface | T w | оK | 290 |
| Pump suction pressure before stopping | Р sp2 | atm | 45.4 |
| Pump suction pressure before startup | Р sp1 | atm | 35.8 |
Table 1: ESP’s operational process.
| Р *10-5, Pa | t, °С s | Р *10-5, Pa | t, °С s | Р *10-5, Pa | t, °С s |
|---|---|---|---|---|---|
| 1 | 99.64 | 56 | 271 | 140 | 336 |
| 3 | 133.54 | 60 | 275 | 144 | 338 |
| 5 | 151.8 | 64 | 279.8 | 148 | 341 |
| 7 | 164.96 | 68 | 283 | 152 | 343 |
| 9 | 175 | 72 | 287 | 156 | 345 |
| 11 | 184 | 76 | 291 | 160 | 347 |
| 13 | 191 | 80 | 294 | 164 | 349 |
| 15 | 198 | 84 | 298 | 168 | 351 |
| 17 | 204 | 88 | 301 | 172 | 353 |
| 19 | 209 | 92 | 304 | 176 | 355 |
| 21 | 214 | 96 | 307 | 180 | 356 |
| 23 | 219 | 100 | 310 | 184 | 358 |
| 25 | 223 | 104 | 313 | 188 | 360 |
| 27 | 228 | 108 | 316 | 192 | 362 |
| 29 | 231 | 112 | 319 | 196 | 364 |
| 32 | 237 | 116 | 322 | 200 | 365 |
| 34 | 241 | 118 | 323 | 202 | 366 |
| 36 | 244 | 120 | 324 | 204 | 367 |
| 38 | 247 | 122 | 325 | 206 | 368 |
| 40 | 250 | 124 | 327 | 208 | 368 |
| 42 | 253 | 126 | 328 | 210 | 369 |
| 44 | 256 | 128 | 329 | 212 | 370 |
| 46 | 258 | 130 | 330 | 214 | 371 |
| 48 | 261 | 132 | 332 | 216 | 372 |
| 50 | 263 | 134 | 333 | 218 | 373 |
| 52 | 266 | 136 | 333 | 220 | 373 |
| 54 | 268 | 138 | 335 | Critical condition |
Table 2: Heat temperatures at different points by Mikheyev MA, Mikheyeva IM [13-14].
The calculation according to (3) yields a pump temperature equal to 223°С + 67°С = 290°С. The cable line’s working temperature is 230°С; therefore, long- term operation of the unit will result in its failure due to a reduction in the electric insulation resistance of the cable line. According to Table 2, the water boiling point is 256°С, i.e. when the pump temperature is 290°С, the boiling of water takes place in the wellstream (Table 2).
Thus, if we let the pump run in constant duty, the temperature inside the ESP unit will climb to the point where oilfield water boiling starts, accompanied by salt deposition. To avoid salt deposition in the pump, the unit must be switched over to periodic cooling or to periodic operation mode. As described in Gareyev AA [6], the process of the pump’s temperature reduction from 200°С to 65°С takes several minutes. The calculations make it clear that operation under a pressure of in constant duty will lead to the premature failure of the centrifugal pump due to R=0 and salt deposition.
If we apply a reverse path and try to identify pump suction pressure on the basis of a known temperature, we can calculate the pressure at which long-term ESP operation without salt deposition becomes possible [8, 12, 15, 16].
However, if geological considerations mandate that a centrifugal pump be operated with a suction pressure of , periodic operation mode must be scheduled.
Find the Centrifugal Pump’s
Let’s find the centrifugal pump’s rundown time within a pressure range of 45 to 36 atm in periodic mode without salt deposition (Figure 5).
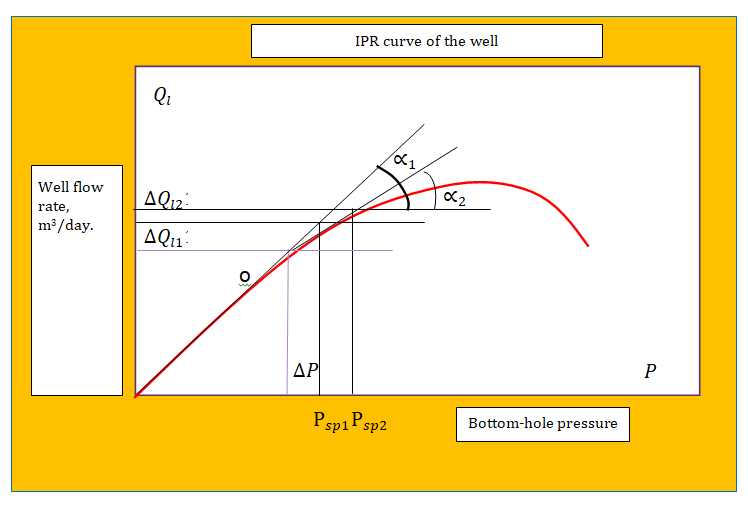
Figure 5: IPR curve of the well the slope of the curve with respect to the pressure axis characterizes the well’s influx. Well flow rate change vs. BHP change is the well’s productivity factor.
For this purpose, let’s develop an IPR curve for the well (crossplot of drawdown vs flow rate). On the IPR curve, we identify the optimal flow rate at a certain drawdown:
( ) l Q f P = ∆ (5)
Let’s calculate the unit’s service life for pumpout at optimal flow rate:
Q t Q ϕ = , day (6)
where the type of dependency ( ) . . o f ESP Q f ϕ = must be determined by experiment in down-hole conditions.
Well productivity factor, determined on the linear part of the curve:
so that
2 1 tg tg ∝< ∝and 2 1 l l Q Q ∆ < ∆ . (7)
on the basis of economic feasibility:
Let’s assume: , where (8)
Point “o” is the point of inflection on the IPR curve satisfying the condition (7).
To determine rundown time according to (6), it’s essential to know
![Figure 6: Centrifugal pump characteristics vs. gas content in the pumped fluid. As gas content increases ϕ the ESP head-and- rate curve closely approaches the y axis [12].](/fulltextimages/7985/fig_6.png)
ESP head and rate ( ) . . o f ESP Q ϕ during the pumping of liquid-gas mixtures with account for suction pressure and well flow rate. Such studies can be performed in the field using ESP units equipped with pressure sensors. Therefore, let’s assume that the ESP’s performance has been studied under real-world conditions, as displayed by the curves in Figure 6.
The ESP’s operating mode can be determined from (6) using the rundown time trt and the accumulation time:
. ac per rt T T t = − (7)
Where Tper represents a cycle of the periodic process.
It’s Essential to Calculate
It’s essential to calculate the ESP rundown time during which pump temperature does not exceed the water boiling point under real-world conditions at pump suction. Let’s consider an approximate solution of the problem.
The amount of heat generated by the centrifugal pump is equal to:
( ) ( ) . * * 1 * 1 * con con ESP ESP dec work Q N η η ϕ τ − = ∆ − (10)
where work τ – the ESP’s running time.
Heat generation Qcon depends on the centrifugal pump’s efficiency dec η , which in turn depends on the content of gas in the mixture [6].
Let’s assume in our calculations that íη depends on gas content and remains constant along the full length of the pump [1, 2, 3, 4].
This means that:
( ) dec f const η ϕ = = (11)
The amount of heat Ä con Q is spent for the temperature rise of the pump assembly from Tent to the current value of .
[equation]
(12) where: ( ) ( ) * * 1 * 1 * mix w oil g ñ ñ Â ñ Â c ϕ ϕ = + − − +
where cp– specific heat capacity of the pump metal; Mp– pump weight; Tx– measured temperature; Tent– temperature at the pump level before startup; cmix– specific heat capacity of the mixture; Mmix– weight of the mixture; cw– specific heat capacity of water; coil– specific heat capacity of oil; В – producing water cut; cg– gas heat capacity. Insofar as the heat capacity of gas is hundreds of times lower than that of the fluid, we’ll ignore it from now on.
( ) ( ) * 1 * } * 1 * mix w oil g ñ ñ Â Â ñ ñ ϕ ϕ = + − − + (14)
A centrifugal pump is always surrounded by homogeneous oil and covered by gas bubbles [6], whose thickness is equal to íδ . Under approximate calculations, heat dissipation from the pump surface can be ignored due to the low heat-conductivity factor of the gas blanket [5].
Therefore, at a first approximation, the heat flow equation with account for (12-14) can be composed as follows:
[equation]
(15) thus, the pump’s temperature rise during its operation is:
∆ = + + (16) Q Ò Ò ñ Ì ñ Ì
con õ w oil oil mix mix ) (
Having experimentally determined the recycle delay time gp τ of the dynamic fluid level from Psp1 to Psp2, let’s formulate the process regulations for ESP operation in periodic mode without salt deposition. Let’s consider a case study of theoretical computation.
- Let’s calculate well flow rate during pumpout of the fluid from Psp2 to Psp1: (17)
- Let’s calculate gas content at the centrifugal pump’s suction [12]:
- The mixture’s weight can be determined by the formula:
- V
- V
- Q ϕ =
- + l
- * mix mix l
- Ì
- Q ρ
- = (13) where
- (
- )
- * 1
- * mix oil w
- Â
- Â ρ ρ ρ
- =
- −
- +
-
-
- −
-
-
-
-
- =
- −
- =
- 45
- 1
- 94
- 5,04* 1
- 0,66 *114*
- 1,62
- 45
- V
- Let’s calculate the heat capacity of the mixture using the formula:
- (
- )
- Capacity of the ESP unit, m3/d (m3/s)
- 30
- 35
- 50
- 80
- 0.000347
- 0.000405
- 0.000579
- 0.000926
- 15%
- 0.000289352
- 0.000347
- 0.000520833
- 0.00081
- 30%
- 0.000115741
- 0.00024306
- 0.0003125
- 0.000405
- 45%
- 3.47222E-05
- 6.9444E-05
- 9.25926E-05
- 0.000139 ϕ%
Table 3: Head and rate of ESP units with a capacity of 30, 35, 50 and 80 m3/d (table compiled on the basis of processed
From which V = 1.62 m3/d and the gas content at pump suction is equal to: 0,24 ϕ = Let’s choose the ESP’s performance according to its head and rate depending on the gas content shown in Table 3.
Let’s find the ESP unit’s rundown time from the pressure Рпр2 to Рпр1 and show the result in tabulated form (Table 4):
| Gas Content ϕ% | Rundown Time in Seconds | |||
|---|---|---|---|---|
| 30 | 35 | 50 | 80 | |
| 30% | 1,814.40 | 864.00 | 672.00 | 518.40 |
| 45% | 6,048.00 | 3,024 | 2,268 | 1,512 |
Table 4: Approximate calculations of the liquid-gas mixture’s pumpout time by centrifugal pumps depending on gas content.
Using the data from Table 1, let’s calculate the amount of heat:
( ) ( ) . * * 1 * 1 * con con MOTOR MOTOR p work Q N η η ϕ τ ∆ = − −
( ) ( ) 15000*0,835* 1 0,3* 1 0,37 *864 8776317 con Q ∆ = − − = J
This amount of heat is generated during pumpout. The pump’s temperature increases by:
∆ = + = + = + = +
Q Ò Ò C C ñ Ì ñ Ì
( )
8776317 63 63,2 195 258 ( 450*100
o o con õ w oil oil mix mix * )
This means that in 864 seconds (14.4 minutes), the pump’s temperature rises to 258°С. At the end of the pumping process, the water in the wellstream starts boiling and the cable line adjacent to the pump (cable extension) is affected by thermal impact (the working temperature of the cable line is 230°С).
The maximum rundown time tultim, when salt deposition begins and water reaches its boiling point Tb, can be calculated as follows:
( ) ( ) ( ) ( ) .
− + = − − * 1 * 1
Ò Ò c M c M t N η η ϕ b w pump pump mix mix (20)
ultim sp MOTOR MOTOR pump
Substituting the values from formula (19), we determine maximum rundown time tultim:
( ) 256 63 *450*100
10157 ultim t − = = 855 seconds Having performed the calculations according to the formulas (18-20), rundown time must be adjusted to 855 seconds (14.25 minutes). With account for approximation, let’s assume a rundown time of 14 minutes and determine the accumulation time tac by experiment on the well.
Conclusions
- The thermal state of a centrifugal pump during intermittent operation is a complex thermodynamic process.
- The determining parameter of the thermal state of a centrifugal pump is the content of free gas in the gas- liquid mixture.
- Periodic operation of a centrifugal pump can be predicted based on its thermal state.
- Prediction of the periodic operation of the centrifugal pump can be programmed.
References
-
Gareev АА (2009) Regarding maximum-permissible gas content at centrifugal pump intake. Equipment and Technologies for the Oil & Gas Sector 2: 21-25.
-
Gareev АА (2011) Regarding the thermal behavior and thermal-shock phenomenon of electric centrifugal pumps. Oil Facilities 3: 122-126.
-
Aleksandrov АА, Grigoryev BA (1998) Thermal and physical properties of water and water vapor. MEI Publishing Company, Russia, pp: 423.
-
Gareev АА (2009) Regarding gas-separation coefficient at pump intake. Oil Facilities 6: 90-93.
-
Gareev АА (2013) Calculation of gas-separation coefficient at pump intake. Oil Facilities 3: 82-85.
-
Gareyev AA (2018) Investigation of ESP unit temperature and pressure in transient behavior. Surgutneftegaz Engineer 1: 39-43.
-
Gareev АА (2010) Regarding the thermal behavior of electric submersible pumps. Equipment and Technologies for Oil-and-Gas Facilities, Oilfield Engineering, Мoscow: Vniioeng, 6: 35-41.
-
Gareev AA (2017) Regarding the salt-deposition mechanism. Oilfield Engineering 4: 35-45.
-
Gareev АА (2009) Regarding the significance of thermal condition in electric centrifugal pump units (ESP). Equipment and Technologies for the Oil & Gas Sector 1: 23-29.
-
Tsivilev RP (2004) Introduction to the Physical Chemistry of Gases and Fluids. Ukhta, pp: 72.
-
Gareev АА, Sharafutdinov RF, Valiullin RA (2012) Regarding the significance of pressure at electric centrifugal-pump intake. Oil Facilities 10: 128-131.
-
Gareev AA (2011) Current problems of low-capacity electric centrifugal pump operation during oil production. Printing and Publications Center, Bashkir State University, Russia.
-
Drozdov AN (2008) Methods and technology for oil extraction by submersible pumps in abnormal conditions. M. MAKS-Express, Russian State University of Oil and Gas, Russia, pp: 245.
-
Mikheyev AA, Mikheyeva IM (1977) Heat-conductivity principles. Energiya-M.
-
Gareev АА (2009) Regarding maximum gas content at electric centrifugal pump intake. Equipment and Technologies for Oil-and-Gas Facilities, Oilfield Engineering, Moscow, Vniioeng, 2: 21-25.
-
Gareev AA (2019) Regarding the thermal behavior of a centrifugal pump for oil recovery. Engineering Science 4(2): 28-33.
- Nigeria’s Vulnerability in the Face of Global Energy Policy
- A Simulation Study of Investigation of Optimum Oil Production Performance by Applying Various Gas Injection Methods in Oil Reservoir
- Characterization of Permo-Triassic Reservoirs through Thermal Maturity Assessment of Westphalian Source Rocks in the Cheshire Basin
- Influence of Microwax on the Rheological and Thermal Behaviour of a Wax Crude Oil
- Real-Time Monitoring and Performance Optimization of Steam Injection in Heavy Oil Reservoirs Using Fiber Optic Sensing and Integrated Predictive Simulation Models
- Rapid On-Site Determination of the Total Petroleum Hydrocarbon Content of Soils by Handheld Fourier Transform Near-Infrared Spectroscopy: Development of a Global, Site- and Scanner- Independent Calibration Model