Binary Adsorption of Phenol and 2-Chlorophenol on Chitosan Derived from Pink Shrimp Shell
The binary adsorption of phenol and 2-chlorophenol in a synthetic industrial wastewater was investigated using extracted optimized chitosan from pink shrimp shell wastes as adsorbent. The effects of operational parameters on the binary adsorption system were studied. The equilibrium adsorption data for the binary system were analyzed using extended Langmuir, extended Sips, extended Redlich-Peterson and Fritz-Schlüender adsorption isotherms. The Fritz-Schlüender isotherm fitted the adsorption data excellently wherein the maximum adsorption capacities for phenol and 2-chlorophenol were obtained as 6.7431 and 14.7493 mg/g respectively for the optimized chitosan at pH=4, adsorbent dose of 1 g, initial concentration of phenol and 2-chlorophenol = 25-250 mg/L, contact time of 120 min, agitation speed of 150 rpm, particle size of 250 microns and temperature of (28 ± 2) °C. The kinetic modelling of the phenol-2-chlorophenol adsorption system showed that pseudo second-order kinetic model gave the best fit amongst the investigated kinetic models. The simultaneous adsorption of phenol and 2-chlorophenol on the prepared adsorbent was chemisorption and film-diffusion controlled. The thermodynamic parameters of the binary adsorption system indicated that the simultaneous adsorption of phenol and 2-chlorophenol on the extracted optimized chitosan was relatively favourable, non-spontaneous, endogenic and exothermic with changes in Gibb’s free energy, , positive, entropy, , approximately zero (though negative), and enthalpy, , negative.
Introduction
The chemical and process industries (such as pulp and paper, gas and coke manufacturing, textile, tanning, plastics, petroleum, petrochemical and pharmaceutical industries, amongst others) frequently release wastewater effluents into the environment. These effluents contain various pollutants such as phenolic compounds, dyes, organic matter, heavy metals and suspended matter [1]. Among these contaminants, phenol and its derivatives are one of the crucial pollutants present in wastewater being released into the environment at noticeable levels. Phenol and its derivatives cause adverse effects on public health and environment. According to the United States Environmental Protection Agency (USEPA), the permissible concentration of phenol in surface water should be less than 1.0 𝜇g/L (i.e., 1 ppb) [2]. However, the concentrations of phenol in wastewater released from various industries (petroleum refineries, petrochemicals, textile, leather, coke ovens, coal conversion, ferrous, rubber, pulp and paper, wood preservative, phenolic resin production, fibre glass manufacturing and paint manufacturing) as given by Polat, et al. [3] and Ucun, et al. [4], are far greater than this permissible level given by USEPA. Also, phenolic compounds such as 2,4,6-trichlorophenol, 2-chlorophenol, 2,4-dichlorophenol and phenol were designated as the 21st, 24th, 31st and 65th of the 126 priority pollutants by USEPA [5]. Hence, there is a need to treat the effluent from the aforementioned industries.
Various treatment methods (such as biodegradation, biosorption, membrane separation, pervaporation, solvent extraction, distillation and adsorption) using a range of adsorbents prepared from various precursors are available to remove phenolic compounds from aqueous solution [6]. A good number of these methods suffer from some drawbacks such as high capital and operational costs, regeneration cost and the challenge of residual disposal. However, liquid- phase adsorption is a proven technique that results in highly efficient removal of organic compounds from industrial wastewater mainly due to its simplicity, relatively low adsorbent cost, effectiveness and the availability of a wide range of adsorbents [7].
The adsorption of a single component from aqueous solutions on different adsorbents has gained much attention in the literature. Such studies include adsorption of phenolic compounds from the wastewater of a paint industry on granular activated carbon [8, 9], adsorption of phenol on Lantana camara [10], lead on swine bone adsorbents [11], formaldehyde on bone char [12], treatment of brewery wastewater effluent using activated carbon from coconut shell [13] and sequestration of heavy metals on chitosan- grafted carbon [14]. However, in view of the fact that industrial effluents contain several substances, it is obligatory to investigate these substances simultaneous adsorption on an adsorbent. The simultaneous multicomponent adsorption experiments provide a wide range of information such as the fraction of sites being shared with each adsorbent tested, their affinities toward these sites and the lateral interaction between the solutes in the mixture solution [15]. Since phenol and its derivatives appear in the effluents of many industries, such as coking, rubber synthesis, pharmaceuticals, petrochemical, paper, textiles and wood, which result in high toxic levels and adverse effects towards humans, terrestrial animals, aquatic life and the environment, their prevention or removal is extremely important. Thus, the need to come up with effective treatment methods for phenolic wastes cannot be overemphasized and adsorption on biosorbents is an efficient method used in treating wastewater containing phenolic compounds.
Amongst numerous adsorbents and biopolymers that can be used for the treatment of industrial wastewater, chitosan has the highest adsorption capacity [16] owing to its possession of a number of different functional groups such as hydroxyls and amine, as revealed in Olafadehan, et al. [17], to which the pollutant can adsorb either by chemisorption or physisorption [18]. Chitosan, β-(1→4) D-glucosamine, is a cationic amino polysaccharide. It is a partly or completely deacetylated form of chitin, β-(1→4) N-acetyl-D-glucosamine. Chitin is the second most abundant natural polysaccharide after cellulose. It can be extracted from the exoskeleton of animals such as crustaceans, insects and fungal cell wall. In our previous work [19], we investigated the optimization of the extraction processes of chitin and chitosan from pink shrimp shell wastes via the Box-Behnken design (BBD) of experiments using response surface methodology (RSM). The optimized chitosan yield of 7.62 g (or 16.93 %) using the modelled optimized conditions of 50 % w/w NaOH solution, 87.9 °C deacetylation temperature and 145.26 min deacetylation time was reported. The degree of deacetylation, DDA, of the extracted chitosan was obtained as 89.73 % using the optimum conditions of 50 % w/w NaOH solution, 97.2 °C deacetylation temperature, and 90 mins deacetylation time. After obtaining succinct information from the characterization tests on the prepared chitosan in our previous work [17], the competitive adsorption behaviours of phenol and 2-chlorophenol onto the extracted optimized chitosan from pink shrimp (Penaeus notialis) shell wastes were studied for the first time in this paper. Equally, the kinetics, equilibrium and thermodynamics of the binary adsorption of phenol and 2-chlorophenol on the optimized extracted chitosan were investigated.
Experimental Procedure
Materials
Hydrochloric acid (~37 %), and NaOH pellets (97 %) were purchased from Fisher Scientific International Inc., USA while potassium permanganate (99.0 %) and oxalic acid dihydrate (99.5 %) were purchased from J. T. Baker Co., USA. Phenol (99 %) and 2-chlorophenol (99 %) were purchased from Sigma-Aldrich Co., Germany. All the chemicals used in this study were of analytical grade.
Preparation of Chitosan
The pink shrimp (Penaeus notialis) shell wastes were scraped free of loose tissue, washed, and dried. The dried samples were ground in a blender, passed through a 250 micro meter sieve, packaged and stored in a polyethylene bag at ambient temperature (28±2 °C) for further analysis.
The extraction procedure for the optimized chitosan from the pink shrimp shell wastes involved three major processes: demineralization, deproteinization and deacetylation. Response surface methodology (RSM) in the form of a 3k-Box-Behnken Design (BBD) ($k =$ number of experimental factors) using MINITAB 17.1 software was applied to determine the optimum conditions for the chitosan extraction process [19]. The extracted optimized chitosan was washed thoroughly with distilled water until the pH was neutral and then oven-dried at 80 °C for 3 h for use in the batch adsorption studies.
**Preparation of Adsorbate Solution**
Analytical grade hydroxybenzene (phenol, $C_6H_5OH$) and 2-chlorophenol ($C_6H_5ClOH$) reagents from Sigma-Aldrich Co. (Merck) were used in the experiments. Stock solutions of 1 g/L of both adsorbates were prepared by dissolving an appropriate quantity of phenol and 2-chlorophenol in 1 L of distilled water. The working solutions were prepared by diluting the stock solution with distilled water. Aliquots of the adsorbates were withdrawn from the suspension at preset time intervals and were filtered using a Whatman filter paper (125 mm) to remove the adsorbent particles before analytical measurements were made. The concentrations of phenol and 2-chlorophenol before and after adsorption were measured at maximum wavelengths using UV-Visible spectrophotometer (Jasco, Model V-530, Japan).
**Batch Adsorption Studies**
The equilibrium adsorption studies were carried out using the extracted optimized chitosan as adsorbent. The adsorption study of the binary system was conducted using the initial concentrations of phenol and 2-chlorophenol with a 1:1 (equimolar) concentration ratio of the adsorbate mixtures. The batch adsorption experiments were conducted in a set of 250 mL conical flasks containing 100 mL of the binary adsorbate solutions of concentrations: 25, 50, 75, 100, 125, 150, 175, 200, 225, 250 mg/L with predetermined amount of adsorbents. The mixture in each conical flask was agitated using a ThermoFisher Scientific™ Precision Shaking Water Bath at 150 rpm for 3 h at room temperature of 30 °C until the system reached equilibrium. The equilibrium adsorption capacity, $q_e$, and percentage removal, $R$, were determined using Equations (1) and (2) respectively:
$$q_e = \left( \frac{c_0 - c_e}{m_s} \right) V \quad (1)$$
$$R = \left( \frac{c_0 - c_e}{c_0} \right) \times 100 \quad (2)$$
Where $c_0$ is an initial concentration of adsorbates (mg/L), $c_e$ the equilibrium concentrations of adsorbates (mg/L), $m_s$ the dry weight of the added adsorbent (g) and $V$ the volume of solution (L).
Kinetic studies were performed according to the method described in batch equilibrium adsorption method. The adsorption capacity, $q_t$, at different contact time, $t$, was determined using Equation (3):
$$q_t = \left( \frac{c_0 - c_t}{m_s} \right) V \quad (3)$$
where $c_t$ is concentration of adsorbates at time $t$ (mg/L).
All the experiments were conducted in triplicate to ensure accuracy, reliability and reproducibility of the collected data. Relative error did not exceed ±0.05.
Effect of temperature: The effect of temperature is important in order to determine the temperature required for maximum adsorption. 100 mL of 50 mg/L binary mixture of the phenol and 2-chlorophenol synthetic solutions were taken into five conical flasks with 1 g of chitosan used as adsorbent. The mixture of adsorbent and binary solutions was agitated at 150 rpm using a ThermoFisher Scientific™ Precision Shaking Water Bath for 2 h at different temperatures of 40, 50, 60, 65 and 70 °C.
Effect of pH: The pH of the aqueous solution is an important parameter that controls the adsorption process. The adsorption studies were carried out using 50 mL of 50 mg/L phenol and 50 mL of 50 mg/L 2-chlorophenol of the synthetic solutions both contained in five conical flasks. The pH of the solution was adjusted to 2, 4, 6, 8 and 10 using 0.1 M HCl and 0.1 M NaOH solution. 1 g of the adsorbent (chitosan) was added to the flasks containing the mixtures. These 250 mL conical flasks were agitated at 150 rpm for 2 h in a ThermoFisher Scientific™ Precision Shaking Water Bath at 28 ± 2 °C. After the agitation was completed, the solutions were filtered using Whatman filter paper (No. 1001, 125mm) and the residual concentration of the filtrate was measured using a UV-Visible Spectrophotometer.
Effect of adsorbent dosage: Adsorbent dosages, $M$, in the range of 0.5-2.5 g, at intervals of 0.5 g, were used to determine the adsorption efficiency of the adsorbent (chitosan) on the binary mixture of phenol and 2-chlorophenol. Each of the pre-weighed adsorbent at different dosages was mixed with 50 mL of 50 mg/L phenol and 50 mL of 50 mg/L 2-chlorophenol contained in each flask, which was agitated for 2 h in a ThermoFisher Scientific™ Precision Shaking Water Bath at room temperature (28 ± 2 °C). After agitation was completed, the adsorbent and the adsorbate solutions were separated, filtered and measured for the residual concentrations of phenol and 2-chlorophenol in the binary mixture using a UV-Visible Spectrophotometer.
Effect of agitation speed: The purpose of the study of the effect of agitation speed on adsorption efficiency is to compare different agitation speeds and their impact on the adsorption capacity of the organic compounds on chitosan. This implies that there is an agitation speed that is sufficient to ensure that all surface binding sites are made readily available for uptake in adsorption process. The adsorption experiments were carried out at agitation speeds of 50, 75, 100, 150 and 200 rpm. The temperature was set at 28 °C, adsorbent dose of 1 g, 50 mL of 50 mg/L phenol and 50 mL of 50 mg/L 2-chlorophenol in each mixture was used. After agitation for 2 h, the adsorbent and adsorbate solutions were separated filtered and their residual concentrations determined.
Effect of adsorbate initial concentration: The effect of initial concentration of the binary adsorbate mixture was investigated. The initial phenol and 2-chlorophenol concentrations used were 25-250 mg/L, at intervals of 25 mg/L 1 g of chitosan as adsorbent was used in the adsorption process of the binary mixture of phenol and 2-chlorophenol in five different 250 mL conical flasks containing 100 mL of the binary adsorbate. The samples were filtered and analysed for the amount of organics adsorbed on the adsorbent.
Effect of contact time: The adsorption studies were carried out with a 100 mL binary mixture of 50 mg/L phenol and 2-chlorophenol of the synthetic solutions both contained in five conical flasks. 1 g of the adsorbent (chitosan) was added to the flasks containing the mixtures. These 100 mL conical flasks were agitated at 150 rpm using ThermoFisher Scientific™ Precision Shaking Water Bath at an ambient temperature of 28 °C. The various agitation times were 30-300 minutes, at an interval of 30 minutes. After the agitation was completed, the solutions were filtered and the resulting liquid samples were measured for the residual concentration of the adsorbates in the binary mixture using a UV-Visible Spectrophotometer.
**Theory**
**Adsorption Isotherms**
An adsorption isotherm is an invaluable curve describing the phenomenon governing the retention (or release) or mobility of a substance from the aqueous porous media or aquatic environments to a solid-phase at a constant temperature and pH [20, 21]. Adsorption equilibrium is established when an adsorbate containing phase has been contacted with the adsorbent for sufficient time, with its adsorbate concentration in the bulk solution in a dynamic balance with the interface concentration [22]. Typically, the mathematical correlation, which constitutes an important role towards the modelling analysis, operational design and applicable practice of the adsorption systems, is usually depicted graphically by expressing the solid-phase concentration against its residual concentration [23]. The equilibrium adsorption data for the binary system of phenol and 2-chlorophenol were analysed using the adsorption isotherms given in Eqs. (4). (7) and (10).
**Extended Langmuir Isotherm**
The Langmuir model assumes monolayer coverage on the adsorbent surface and a simple adsorption process with no interfacial relationship amongst the adsorbed molecules. Therefore, the experimental data correlation is somewhat restricted with a more complex and real-life adsorption procedure. The extended Langmuir model, which is a modified version of the Langmuir model, is given by Equation (4) [24]
$$q_{e,i} = \frac{a_{i1} C_{e,i}}{1 + \sum_{j=1}^{n} b_{ij} C_{e,j}}$$
where $q_{e,i}$ is equilibrium adsorption capacity of solute $i$ (mg/g), $a_{i1}$ is the extended Langmuir model constant (L/mg), $b_{ij}$ the multicomponent extended Langmuir model constant (L/mg), $c_{e,i}$ and $c_{e,j}$ the equilibrium concentrations of adsorbates $i$ and $j$ respectively (mg/L).
Equation (4), when applied to the binary adsorption of phenol (component 1) and 2-chlorophenol (component 2) on the prepared chitosan, gives Equations (5) and (6) respectively:
For component 1, $q_{e,1} = \frac{a_{i1} C_{e,1}}{1 + b_{11} C_{e,1} + b_{12} C_{e,2}}$ (5)
For component 2, $q_{e,2} = \frac{a_{i12} C_{e,2}}{1 + b_{21} C_{e,1} + b_{22} C_{e,2}}$ (6)
On linearization of Equations (5) and (6), the inherent parameters in the extended Langmuir isotherm were obtained using linear least squares analysis methods.
**Sips Isotherm**
The Sips isotherm [25] is a combined form of the Langmuir and Freundlich expressions deduced for predicting the heterogeneous adsorption systems and circumventing the limitation of the rising adsorbate concentration associated with Freundlich isotherm. At low adsorbate concentrations, the Sips isotherm reduces to Freundlich isotherm while at high concentrations; it predicts a monolayer adsorption capacity characteristic of the Langmuir isotherm. The Sips
isotherm is given by Equation (7):
$$q_{e,i} = \frac{q_{m,i} b_{i} c_{e,i}^{1/n}}{1 + \sum_{k=1}^{n} \Phi_{ik} c_{e,k}^{1/n}}$$
where $q_{m,i}$ is maximum monolayer coverage capacities (mg/g), $n_i$ the dimensionless Sips isotherm model exponent and $\Phi_{ik}$ the multicomponent extended Sips model constant (L/mg).
Equation (7), when applied to the binary adsorption of phenol (component 1) and 2-chlorophenol (component 2) on the prepared chitosan, gives Equations (8) and (9) respectively:
For component 1, $$q_{e,1} = \frac{q_{m,1} b_{1} c_{e,1}^{1/n}}{1 + \Phi_{11} c_{e,1}^{1/n} + \Phi_{12} c_{e,2}^{1/n}}$$
For component 2, $$q_{e,2} = \frac{q_{m,2} b_{2} c_{e,2}^{1/n}}{1 + \Phi_{21} c_{e,1}^{1/n} + \Phi_{22} c_{e,2}^{1/n}}$$
**Competitive Redlich-Peterson Isotherm**
The competitive non-modified Redlich–Peterson isotherm is given by Equation (10):
$$q_{e,i} = \frac{a_{Ri} c_{e,i}}{1 + \sum_{k=1}^{n} a_{ik} c_{e,k}^{\beta_{k,k}}}$$
Where $a_{Ri}$ is the Redlich-Peterson parameters derived from the corresponding individual Redlich-Peterson isotherm model equations.
Equation (10), when applied to the binary adsorption of phenol (component 1) and 2-chlorophenol (component 2) on the prepared chitosan, gives Equations (11) and (12) respectively:
For component 1, $$q_{e,1} = \frac{a_{R1} c_{e,1}}{1 + \alpha_{11} c_{e,1}^{\beta_{11}} + \alpha_{12} c_{e,2}^{\beta_{22}}}$$
For component 2, $$q_{e,2} = \frac{a_{R2} c_{e,2}}{1 + \alpha_{21} c_{e,1}^{\beta_{11}} + \alpha_{22} c_{e,2}^{\beta_{22}}}$$
**Fritz and Schlüender Isotherm**
Fritz and Schlüender [26] developed an adsorption model that could correlate multicomponent adsorption system data mathematically to a high degree of accuracy. It was then suggested that for calculating the adsorption equilibria of organic solutes in aqueous solutions, a general empirical equation of the following form should be used [27]:
$$q_{e,i} = \frac{q_{m,i} b_{i} c_{e,i}^{1/n}}{1 + \sum_{k=1}^{n} \Phi_{ik} c_{e,k}^{1/n}}$$
where $a_{i,0}$ and $a_{i,j}$ are the multicomponent Fritz-Schlüender model constants (L/mg), $b_{i,0}$ and $b_{i,j}$ the dimensionless Fritz-Schlüender model exponents in competitive phase between solute $i$ and $j$ in the adsorption system.
Equation (13), when applied to the binary adsorption of phenol (component 1) and 2-chlorophenol (component 2) on the prepared chitosan, gives Equations (14) and (15) respectively:
For component 1, $$q_{e,1} = \frac{a_{10} b_{1,0}}{c_{1} + a_{11} c_{1,1} + a_{12} c_{2,2}}$$
For component 2, $$q_{e,2} = \frac{a_{20} b_{2,0}}{c_{2} + a_{21} c_{2,1} + a_{22} c_{2,2}}$$
However, $c_i = 0$ ($i=1,2$) due to the non-interactive nature of the adsorbates.
Owing to the high non-linearity of the Sips, Redlich-Peterson and Fritz and Schlüender isotherms, the inherent parameters in these isotherms were obtained using non-linear regression methods.
**Adsorption Kinetic Models**
The adsorption kinetics study is important in the design of a treatment system using an adsorbent, as well as provision of valuable information pertaining to the reaction mechanism of the adsorption process. The adsorption kinetics describes the solute uptake rate (chemical reaction), which in turn governs the residence time of adsorption process [28]. It can be used to establish the controlling mechanism of the adsorption processes, which in turn governs the mass transfer and equilibrium time [29]. The adsorption kinetics of a process typically involves two stages: a rapid removal stage followed by a much slower stage before the equilibrium is established. The various kinetic models used in this study to correlate the kinetic data for the binary adsorption of phenol and 2-chlorophenol on the extracted optimized chitosan are given in Equations (16), (18), (20), (23) and (24).
**Fractional Power Kinetic Model**
Dalal [30] coined the fractional power kinetic model which indicates an increasing exponential relationship of adsorbate uptake with respect to time. The non-linear form of the fractional power kinetic model is given by:
$$q_t = k_F t^\nu \quad (16)$$
where $q_t$ is sorption capacity at time $t$ (mg/g) and $k_F$ the fractional power kinetic model constant $(\text{mg}/(\text{g min}^2))$.
Taking natural logarithms of Equation (16) gives:
$$\ln q_t = \ln k_F + v \ln t \quad (17)$$
Appropriate linear plot of $\ln q_t$ against $\ln t$ gives estimates of $k_F$ and $v$.
**Lagergren Pseudo-First Order Kinetic Model**
The pseudo first-order kinetic equation of Lagergren [31] is generally expressed in its differential form as follows:
$$\frac{dq_t}{dt} = k_a (q_e - q_t) \quad (18)$$
where $k_a$ is rate constant of pseudo first-order sorption $(\text{min}^{-1})$.
The integrated form of Equation (18) gives:
$$\ln(q_e - q_t) = \ln q_e = k_a t \quad (19)$$
Making a linear plot of $\ln(q_e - q_t)$ against $t$ gives determination of $k_a$ as the negative of the slope of the obtained straight line.
**Pseudo-Second Order Kinetic Model**
If the rate of sorption is a second-order mechanism, the pseudo second-order chemisorption kinetic rate equation is expressed as:
$$\frac{dq_t}{dt} = k_2 (q_e - q_t)^2 \quad (20)$$
where $k_2$ is rate constant of pseudo-second order sorption $(\text{g}/(\text{mg min}))$.
The integrated form of Equation (20) is:
$$q_t = \frac{k_2 q_e^2 t}{1 + k_2 q_e t} \quad (21)$$
which, on linearization, gives various forms, of which is:
$$\frac{t}{q_t} = \frac{1}{k_2 q_e^2} + \frac{t}{q_e} \quad (22)$$
A linear plot of $t/q_t$ against $t$ enables estimates of $q_e$ and $k_2$ values from slope and intercept respectively. The initial adsorption rate, $h = k_2 q_e^2 \text{ mg}/(\text{g min})$.
**Intraparticle Diffusion Model**
Weber and Morris [32] modelled the kinetic data from their adsorption experiment in order to understand the diffusion mechanism of the process, which resulted in the intraparticle diffusion model, given by:
$$q_t = k_{IPD} \sqrt{t} \quad (23)$$
where $k_{IPD}$ is intraparticle diffusion rate constant $(\text{mg}/(\text{g min}^{-3}))$, which can be obtained from the linear plot of uptake $q_t$ against $\sqrt{t}$, with no intercept on $q_t$ axis, provided intraparticle diffusion model can be used to describe the adsorption kinetics.
**Elovich Kinetic Model**
The Elovich rate equation [33] is based on the adsorption capacity of an adsorbent. It is typically used to depict the chemisorption kinetics of gases on heterogeneous solids. It is quite restricted as it only describes a limiting property ultimately reached by the kinetic curve [34]. The Elovich rate equation is expressed as:
$$\frac{dq_t}{dt} = \alpha_e \exp\left(-\beta_e q_t\right) \quad (24)$$
where $\alpha_e$ is initial rate of adsorption $(\text{mg}/\text{g min})$ and $\beta_e$ the Elovich kinetic model constant $(\text{g}/\text{mg})$. $\alpha_e$ and $\beta_e$ are constants during an experiment. As $q_t \to 0$, $\frac{dq_t}{dt} \to \alpha$, hence $\alpha_e$ is regarded as the initial rate of adsorption and $\beta_e$ is the Elovich kinetic model constant. When $t=0$, $q_t=0$ and $t=t$, $q_t=q_t$, the integrated form of Equation (24) is:
$$q_e = \frac{1}{\beta} \left[ \ln(t + \Phi) - \ln\Phi \right] \quad (25)$$
where $\Phi = 1/(\alpha_e \beta_e)$. If $t > \Phi$, Equation (25) simplifies to:
$$q_t = \frac{1}{\beta_e} \ln(\alpha_e \beta_e) + \frac{1}{\beta_e} \ln t \quad (26)$$
Hence, a linear plot of $q_t$ against $t$ can be made to check if $t > \Phi$ for the coefficient of determination, $R^2$, should be greater than 1.
**Boyd’s Kinetic Model**
Though the Boyd, et al. [35] diffusion model was developed theoretically for ion-exchange kinetics, it had been applied successfully to adsorption studies [36, 37, 38, 39] to investigate the slow step in the adsorption process. The Boyd’s model is given by:
$$F_B(t) = \frac{q_t}{q_e} = 1 - \frac{6}{\pi^2} \sum_{n=1}^{\infty} \frac{1}{n^2} \exp\left(-n^2 B t\right) \tag{27}$$
where $B = \pi^2 D/R_p^2$, $F_B(t)$ is dimensionless fraction of solute adsorbed at time $t$, $D$ the effective intraparticle diffusion coefficient $(m^2/s)$, $R_p$ the radius of adsorbent particle $(m)$ and $t$ the contact time $(\min)$.
If intraparticle diffusion was the rate-limiting step in the adsorption process, Equation (27) is valid. Reichenberg [40] obtained approximate expressions given by Equations (28) and (30) via application of Fourier transform and then integration of Equation (27):
$$F_B(t) = 1 - \frac{6}{\pi^2} \exp\left(-B t\right), F_B(t) > 0.85 \tag{28}$$
i.e. $Bt = -\ln\left[1 - F_B(t)\right] - 0.4977, F_B(t) > 0.85 \tag{29}$$
$Bt = \left(\sqrt{\pi} - \sqrt{\pi - \frac{\pi^2 F_B(t)}{3}}\right), F_B(t) \leq 0.85 \tag{30}$$
The value of $B$ can be computed according to Equation (29) or (30) for each value of $F_B(t)$, depending on the conditions given, and then plotted against time $t$, to construct the Boyd plots [39, 41]. The linearity of these plots was used to distinguish between external transport (film diffusion) and intraparticle transport-controlled rates of adsorption [42]. A straight line passing through the origin is indicative of adsorption process governed by intraparticle diffusion; otherwise, it is governed by film diffusion [38, 39, 43, 44].
**Thermodynamic Studies**
The variation of thermodynamic equilibrium constant, $K_c$, with temperature can be used to calculate the enthalpy change, $\Delta H^0$, Gibbs free energy change, $\Delta G^0$, and entropy change, $\Delta S^0$. The thermodynamic equilibrium constant, $K_c$, $(L/g)$, was determined using the relation [39]:
$$q_e = K_c c_e \tag{31}$$
and the change in Gibb's free energy was thus calculated by using Equation (32):
$$\Delta G = -R_u T \ln K_c \tag{32}$$
where $\Delta G$ is the Gibbs free energy change $(J/mol)$, $R_u$ is the universal gas constant and $T$ the temperature of adsorption $(K)$.
However, $\Delta G = \Delta H = -T \Delta S = -R_u T \ln K_c \tag{33}$$
where $\Delta H$ is the enthalpy change $(J/mol)$ and $\Delta S$ the entropy change $(J/(mol K))$. The temperature dependence of the Gibbs free energy change is given thus:
$$d\left(\frac{\Delta G}{T}\right) = -\frac{\Delta H}{T^2} dT \tag{34}$$
Therefore, substituting Equation (33) into Equation (34) yields Equation (35) and the thermodynamic equilibrium constant can be expressed in terms of enthalpy change of adsorption as a function of temperature.
$$\frac{d\ln K_c}{dT} = \frac{\Delta H}{R_u T^2} \tag{35}$$
From Equation (33),
$$\ln K_c = \frac{\Delta S}{R_u} - \frac{\Delta H}{R_u T} \tag{36}$$
Setting $Y = \ln K_c - X_1 = T^{-1}, a_0 = \frac{\Delta S}{R_u}$, and $a_1 = -\Delta H/R_u$, Equation (36) becomes:
$$Y = a_o + a_1 X_1 \tag{37}$$
The regression equations required to determine the regression coefficients, $a_0$ and $a_1$, are given by:
$$\sum_{j=1}^{N} Y_j = N a_0 + a_1 \sum_{j=1}^{N} X_{1,j} \tag{38}$$
$$\sum_{j=1}^{N} X_{1,j} Y_j = a_0 \sum_{j=1}^{N} X_{1,j} + a_1 \sum_{j=1}^{N} X_{1,j}^2 \tag{39}$$
where $N$ is the dimensionless number of experimental runs.
Hence, $\Delta S$ and $\Delta H$ can be calculated having found $a_0$ and $a_1$. The adsorption process is endothermic ($\Delta H > 0$) if the equilibrium constant, $K_c$, increases with temperature, while the process is exothermic ($\Delta H < 0$) if the equilibrium constant, $K_c$, decreases as temperature increases. The Gibbs free energy indicates the degree of spontaneity of the adsorption process and the higher the negative value, the more it reflects a more energetically favourable adsorption process system [45].
**Results and Discussion**
**Effects of Operational Variables on the Binary Adsorption System**
The effects of operational variables on the binary adsorption system of phenol and 2-chlorophenol on the optimized extracted chitosan investigated in this study include temperature, initial pH, adsorbent dose, agitation speed, initial concentration of adsorbates and contact time. The effect of temperature on the binary adsorption of phenol and 2-chlorophenol using chitosan as an adsorbent is shown in Figure 1.
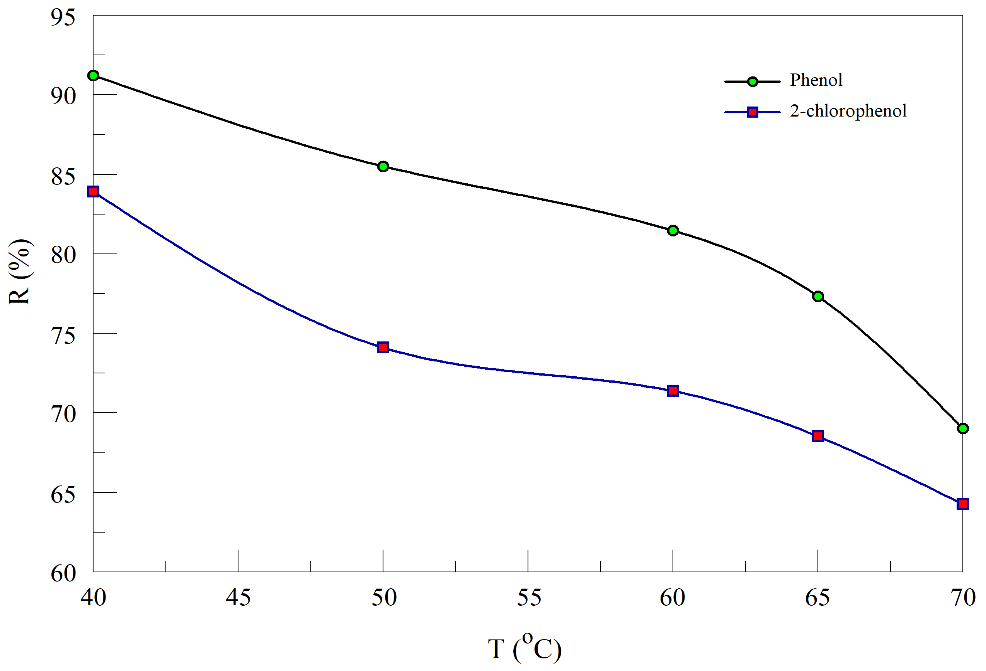
In Figure 1, the % removal was observed to reduce
from 91.23 to 69.02 % and 83.91 to 64.26 % for phenol and
2-chlorophenol respectively as temperature increased from
40 to 70 oC. Hence, an inverse relationship exists between
temperature and percentage removal of the binary system
investigated.
The effect of initial pH on the binary adsorption of phenol
and 2-chlorophenol was studied at 28 ℃ at 2
$$ 2 \leq p H \leq 1 0 $$ for initial concentrations of both adsorbates at 50 mg/L being adjusted by adding either 0.1 M HCl or 0.1 M NaOH. The variation of percentage removal of the adsorbates with pH is shown in Figure 2, where the highest percentages of phenol and 2-chlorophenol uptakes were obtained as 90.42 % at pH of 6 and 92.54 % at pH of 4 respectively. As revealed in Figure 2, increased adsorption for phenol was observed between pH of 2 and 6 while percentage adsorption decreased rapidly above pH=6. Increased adsorption was observed between pH=2 and 4 while percentage adsorption decreased rapidly above pH=4 for 2-chlorophenol. Hence, the adsorption properties of the optimized extracted chitosan were influenced by the solution pH due to the electrostatic attraction that existed between phenolate ions (C6H5O−) and adsorbent surface whereby the oxygen of the surface carbonyl group acted as the electron donor and the phenol aromatic ring as the electron acceptor.
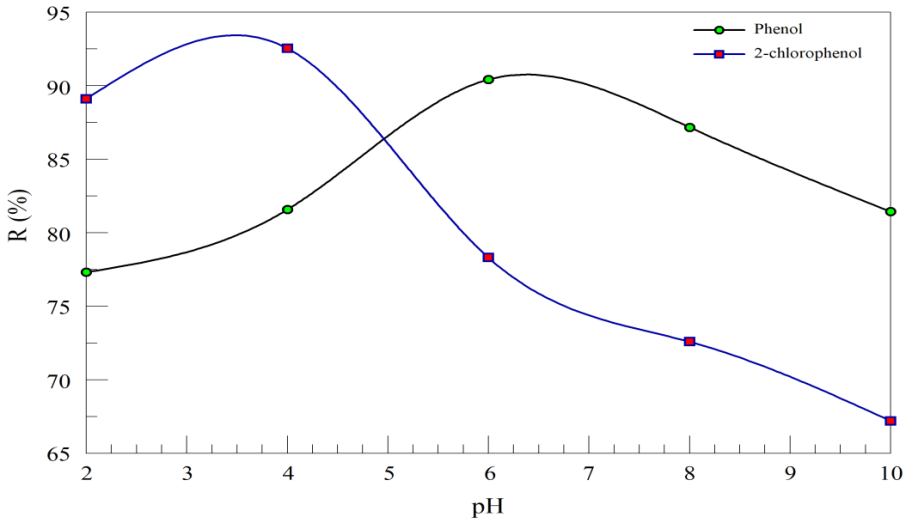
Figure 3 shows the effect of adsorbent dose, M, on the binary adsorption of phenol and 2-chlorophenol on chitosan, where the dose of the adsorbent was varied between 0.5 and 2.5 g and other operational parameters kept at their respective values thus: initial concentration of each adsorbate=50 mg/L, contact time=120 min, agitation speed=150 rpm, pH=4 and temperature=28 ℃) were kept.
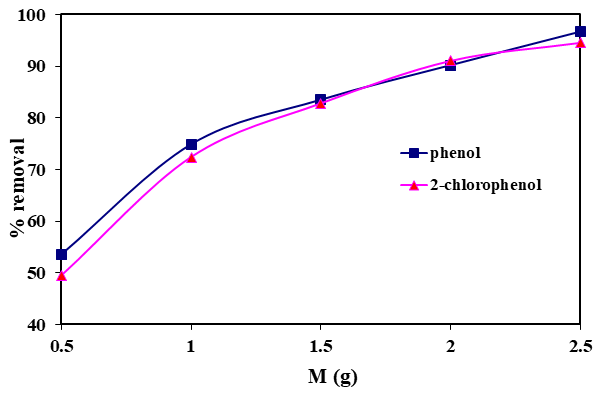
In Figure 3, it was observed that increasing the adsorbent dosage from 0.5 to 2.5 g increased the percentage removal efficiency of phenol and 2-chlorophenol from 53.6 % to 96.71% and 49.52 % to 94.53 % respectively. The increase in percentage adsorbed with increase in adsorbent dosage may be as a result of increase in the available adsorption sites. Lower removals were obtained at low adsorbent dosage for both adsorbates due to insufficient active binding sites of the adsorbent.
The effect of the agitation speed on the removal of the binary adsorbate system of phenol-2-chlorophenol is shown in Figure 4. It can be seen that the percentage removal of the binary adsorbate system increased from 42 to 90 % and 60 to 97.5 % for phenol and 2-chlorophenol respectively as the agitation speed increased from 50 to 200 rpm. This is mainly due to the fact that with the increased turbulence, there is a decrease in boundary layer resistance around the adsorbent particles. Therefore, it can be deduced that agitation speed improves the diffusion of the molecules of the adsorbate towards the surface of the adsorbent [46].
![Figure 4: It can be seen that the percentage removal of the binary adsorbate system increased from 42 to 90 % and 60 to 97.5 % for phenol and 2-chlorophenol respectively as the agitation speed increased from 50 to 200 rpm. This is mainly due to the fact that with the increased turbulence, there is a decrease in boundary layer resistance around the adsorbent particles. Therefore, it can be deduced that agitation speed improves the diffusion of the molecules of the adsorbate towards the surface of the adsorbent [46].](/fulltextimages/8314/fig_4.png)
Figure 5 shows the effect of initial concentration, 0_c_ , of the adsorbates on the binary adsorption of phenol and 2-chlorophenol on the optimized extracted chitosan. It was observed that the overall percentage removal decreased as the initial concentrations of the binary mixture of phenol–2- chlorophenol increased. Therefore, in this study, an inverse proportionality relationship between these two variables was obtained.
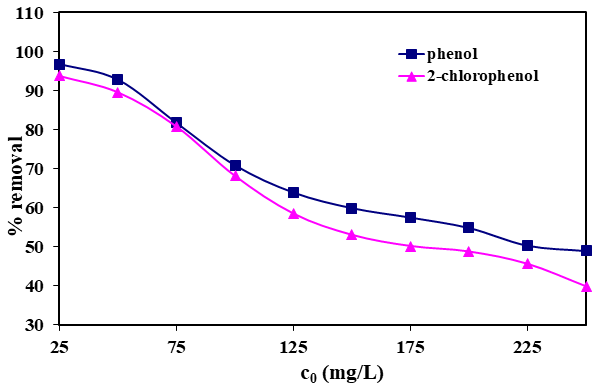
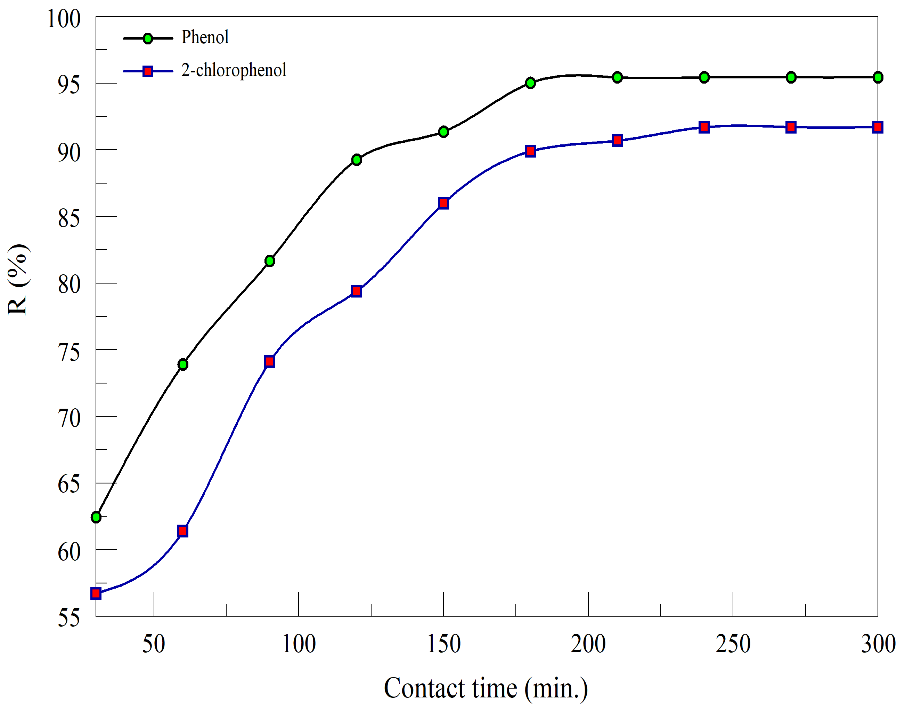
Figure 6 shows effect of contact time, t, on the binary adsorption of phenol and 2-chlorophenol on the prepared chitosan. The percentage removal of phenol rose from 62.43 % after a contact time of 30 min to 95.43 % with a contact time of 300 min. This phenomenon was also observed with
2-chlorophenol with R % increasing from 56.72 % to 91.7 %. Figure 6 also shows that the system reached an equilibrium point at the contact time of 270 minutes owing to the fact there was not an increase in the percentage removal of the adsorbates after 270 minutes of contact time.
Binary Adsorption Kinetic Studies
The kinetic models of fractional power, pseudo first- order, pseudo second-order, Elovich, Intraparticle diffusion and Boyd were used for the binary adsorption kinetics studies of phenol and 2-chlorophenol on the prepared chitosan varying the contact time of the process from 30 to 300 min. The linear plots of all these kinetic models were made, the inherent kinetic parameters estimated and the results are shown in Table 1.
| Kinetic models | Parameters | Phenol | 2-chlorophenol |
|---|---|---|---|
| Fractional Power | k (mg/g minv)) F | 1.7100 | 1.2573 |
| v | 0.1896 | 0.2362 | |
| R2 | 0.9358 | 0.9483 | |
| Pseudo-first order | k (min-1) α | 0.0264 | 0.0207 |
| (q ) (mg/g) e ex�pt | 4.7715 | 4.5850 | |
| (q ) (mg/g) e calc | 5.4652 | 4.8925 | |
| R2 | 0.8810 | 0.9512 | |
| Pseudo-second order | k (g/(mg min)) 2 | 9.5262 × 10⁻³ | 6.1325 × 10⁻³ |
| h (mg/(g min)) | 0.2536 | 0.1621 | |
| (q ) (mg/g) e ex�pt | 4.7715 | 4.5850 | |
| (q ) (mg/g) e calc | 5.1600 | 5.1414 | |
| R2 | 0.9989 | 0.9968 | |
| Intra-particle diffusion | k (mg/(g.min0.5)) IPD | 0.1367 | 0.1622 |
| c =intercept | 2.6950 | 2.0706 | |
| R2 | 0.8630 | 0.9112 | |
| Elovich | β (g/mg) e | 1.3186 | 1.1396 |
| a (mg/g) e | 0.6520 | -0.2438 | |
| α (mg/g min) e | 1.7917 | 0.6646 | |
| R2 | 0.9482 | 0.9521 |
Table 1: Kinetic constants of different kinetic models for the binary adsorption system on chitosan.
All the kinetic models investigated in this study show good correlation values. The fractional power model shows a correlation coefficient values,
2 R , of 0.9358 for phenol and 0.9483 for 2-chlorophenol with the model rate constants of 1.71 and 1.2573 mg/g. It was observed that the correlation coefficients for the pseudo first-order kinetic model for the adsorption system of phenol and 2-chlorophenol deviated to some extent comparing to the experimental data while that for pseudo second-order kinetics showed excellent correlation with the highest 2 R of 0.9989 and 0.9968 for phenol and 2-chlorophenol respectively amongst other kinetic models. This suggests that the rate-controlling step of the binary adsorption system of phenol-2-chlorophenol onto the prepared chitosan is chemisorption. The Weber Jr and Morris [32] model (intraparticle diffusion) shows that since the tq against 5.0_t_ linear plot did not pass through the origin, then other mechanisms (chemisorption) along with (not solely) intraparticle diffusion govern the adsorption process [47, 48]. To investigate the slow step in the adsorption process, the kinetic data were further studied using the Boyd model [36], given in Equation (29) since the values of ) (t FB calculated in this study were greater than 0.85. The B values were plotted against t as shown in Figure 7.
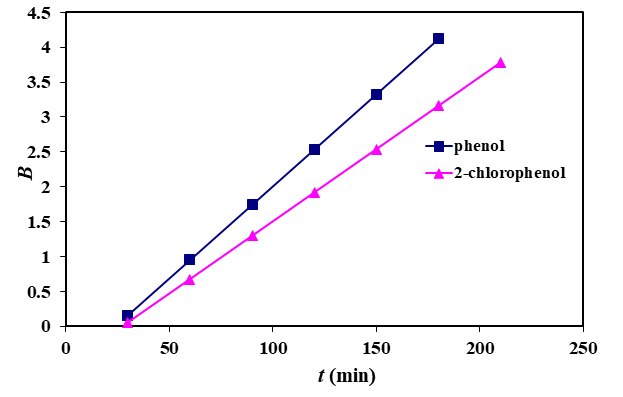
The linear lines for the initial concentrations did not pass through the origin. This is indicative that the adsorption of phenol and 2-chlorophenol on the optimized extracted chitosan was mainly governed by external mass transport where particle diffusion was the slowest step, as already revealed using the intraparticle kinetic model.
Adsorption Equilibrium Studies
The adsorption equilibrium studies provide information on the capacity of the adsorbent for the adsorbate. An adsorption isotherm is characterized by certain constant values, which express the surface properties and affinity of the adsorbent and it can also be used to compare the adsorptive capacities of the adsorbent for different pollutants [14, 49]. In this study, the adsorbate dosage was varied between 25 and 250 mg/L.
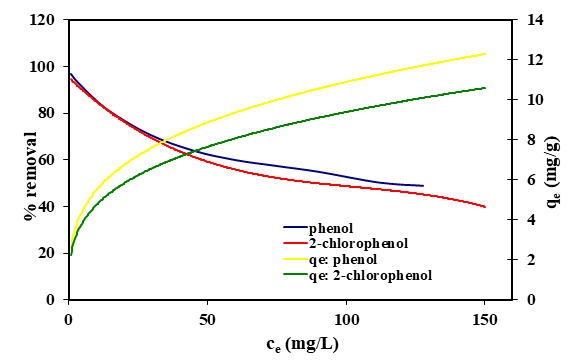
Figure 8 show similar characteristics in that it illustrates that as the equilibrium concentration for both adsorbates in the binary system increased, the percentage removal of phenol and 2-chlorophenol decreased while the amount of adsorbate adsorbed per unit mass of the extracted optimized chitosan at equilibrium increased mainly due to the increased adsorbent surface area and availability of more adsorption sites.
The parameters of the non-linear isotherms of Sips, Redlich-Peterson and Fritz and Schlüender were obtained using non-linear regression analysis. These parameters were validated using the sum of errors squared (ERRSQ) and sum of absolute errors (EABS) as error functions. The results of the adsorption isotherms used for the binary adsorption of phenol and 2-chlorophenol on the extracted optimized chitosan are presented in Table 2.
| Extended Langmuir isotherm | |||||
|---|---|---|---|---|---|
| Phenol | 2-chlorophenol | ||||
| Error Functions | Parameters | Error Functions | Parameters | ||
| R2 =0.7691 | a (L/g) L1 | 3.6982 | R2 =0.8691 | a (L/g) L2 | 1.8861 |
| b (L/mg) 11 | 0.5485 | b (L/mg) 21 | 0.0973 | ||
| b (L/mg) 12 | -0.1250 | b (L/mg) 22 | 0.1279 | ||
| Extended Sips (Langmuir-Freundlich) isotherm | |||||
| R2 =0.9880 ERRSQ=1.0852 EABS=2.7823 | q (mg/g) m,1 | 6.7431 | R2 =0.9824 ERRSQ =1.1514 EABS =2.9086 | q (mg/g) m,2 | 14.7493 |
| b (-) 1 | 0.0657 | b (-) 2 | 0.0997 | ||
| n ( −) 1 | 0.5628 | n ( −) 1 | 3.8135 | ||
| n ( −) 2 | 3.4788 | n ( −) 2 | 3.6053 | ||
| Φ (L/mg) 11 | -0.0655 | Φ (L/mg) 21 | 5.3802 | ||
| Φ (L/mg) 12 | 2.6315 | Φ (L/mg) 22 | -2.3717 | ||
| Extended Redlich-Peterson isotherm | |||||
| R2 =0.9853 ERRSQ=1.3278 EABS=3.2197 | a (L/g) R1 | 20.5778 | R 2 =0.9581 ERRSQ =2.8630 EABS =4.3894 | a (L/g) R2 | 22.1550 |
| β (-) R,1 | 0.6534 | β (-) R,1 | 0.7674 | ||
| β (-) R,2 | 0.3388 | β (-) R,2 | -0.4736 | ||
| α (L/mg) 11 | 9.9113 | α (L/mg) 21 | 7.7117 | ||
| α (L/mg) 12 | -3.0389 | α (L/mg) 22 | 8.8134 | ||
| Fritz and Schlüender isotherm | |||||
| R2 =0.9924 ERRSQ=0.6876 EABS=1.6979 | a (L/g) 1,0 | 1.5633 | R 2 =0.9869 ERRSQ =0.8724 EABS =2.4770 | a (L/g) 2,0 | 0.6317 |
| b ( −) 1,0 | -3.8294 | b ( −) 2,0 | 0.1612 | ||
| a (L/mg) 11 | 0.0642 | a (L/mg) 21 | -0.9793 | ||
| a (L/mg) 12 | 0.4615 | a (L/mg) 22 | 1.1586 | ||
| b (-) 1,1 | 2.0408 | b (-) 2,1 | 0.1020 | ||
| b (-) 1,2 | 2.7005 | b (-) 2,2 | 0.0819 |
Table 2: Isothermic constants of the different isotherm models for the equilibrium binary adsorption system on chitosan.
It can be seen in Table 2 that the equilibrium adsorption data of the binary system of phenol and 2-chlorophenol can be correlated with the Sips, competitive Redlich-Peterson and Fritz and Schlüender isotherms since the coefficients of regression obtained are close to unity in these three isotherms, with the best correlation given by Fritz and Schlüender isotherm as follows: For phenol (component 1),
8294 .3 1, 1, 4615 .0 0642 .0
5633 .1 − $$ q _ {e, 1} = \frac {1 . 5 6 3 3 c _ {e} ^ {-}}{0 . 0 6 4 2 c _ {e , 1} ^ {2 . 0 4 0 8} + 0} $$ e e c c
6317 .0 $$ q _ {e, 2} = \frac {0 . 6 3 1 7 c _ {e , 2} ^ {0 . 1 6 1 2}}{- 0 . 9 7 9 3 c _ {e , 1} ^ {0 . 1 0 2 0} + 1 . 1 5 8 6 c _ {e , 2} ^ {0 . 0 8 1 9}} \tag {41} $$ e e c c
0819 .0 2 , 1020 .0 1,
e e Hence, it is recommended that Fritz and Schlüender isotherm should be used in the modelling studies of the binary adsorption of phenol and 2-chlorophenol on the prepared chitosan as adsorbent.
Figures 9 & 10 show the representation of the comparison of the multicomponent isotherm models, ( )calc e q , (shown as continuous lines) with the experimental equilibrium adsorption capacity, ( )exp e t q , (represented as symbols) of the simultaneous adsorption of phenol and 2-chlorophenol on the extracted optimized chitosan, where EL, CRP and FS represent Extended Langmuir, Competitive Redlich-Peterson and Fritz-Schlüender adsorption isotherms respectively, though depicted separately for phenol and 2-chlorophenol in Figures 9 and 10 respectively. From Figures 9 and 10, it is clearly seen that the Fritz and Schlüender multicomponent adsorption isotherm had the best fit with the simultaneous experimental equilibrium adsorption capacity data, ( )exp e t q , of phenol and 2-chlorophenol, as revealed previously.
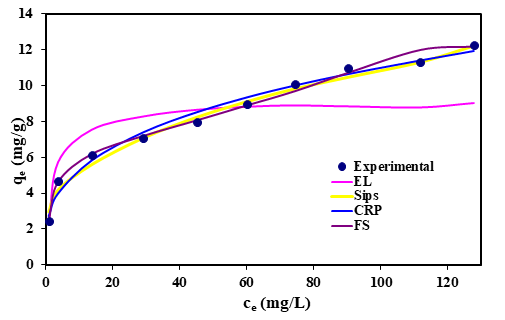
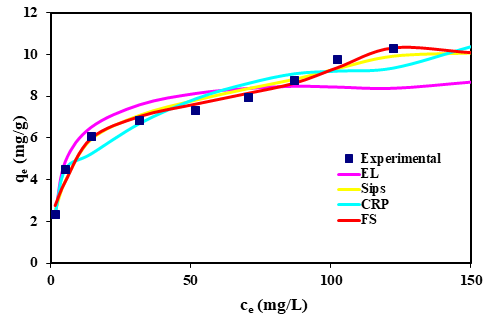
Equally, as indicated in Table 2, Figures 9 and 10, the Fritz–Schlüender isotherm best described the simultaneous uptake of phenol and 2-chlorophenol onto the extracted optimized chitosan as adsorbent. The Fritz–Schlüender isotherm model constants were calculated to be 1.5633 and 0.6317 L/g for the simultaneous phenol and 2-chlorophenol adsorption system respectively. Also, other parameters including the model exponents were calculated and shown in Table 2. The validation models were obtained to be (0.9924, 0.6876, 1.6979) and (0.9869, 0.8724, 2.4770) for ( ) 2, , R ERRSQ EABS in the simultaneous binary adsorption system of phenol–2-chlorophenol respectively. The validation models of sum of error squared and sum of absolute errors are shown to be the least when compared with the other multicomponent isotherm models while the,
2 R , obtained, showed to be the highest buttressing the efficacy of the Fritz–Schlüender isotherm in correlating the equilibrium adsorption data of the binary system investigated.
Results of Thermodynamic Studies
The thermodynamic parameters of the Gibb’s free energy change, enthalpy change, and entropy change for the binary adsorption process were calculated using Equations (33) and (36) as explained earlier, and the results are presented in Table 3.
| Phenol | 2-chlorophenol | |||||
|---|---|---|---|---|---|---|
| T(K) | ∆G0 (J/mol) | ∆H0(kJ/mol) | ∆S0 (kJ/(mol K) | ∆G0 (J/mol) | ∆H0 (kJ/mol) | ∆S0 (kJ/(mol K) |
| 313 | -102.691 | -43.5097 | -0.1388 | 1694.185 | -28.6908 | -0.0981 |
| 323 | 1416.320 | 3359.171 | ||||
| 333 | 2275.042 | 3844.628 | ||||
| 338 | 3022.425 | 4283.620 | ||||
| 343 | 4281.918 | 4893.288 |
Table 3: Thermodynamic parameters for the binary adsorption system on extracted optimized chitosan.
From Table 3, the predicted variation of c InK with temperature was obtained thus: For phenol, 3 1 2 5.2333 10 16.7, 0.9710 c InK T R − = × − = For
2-chlorophenol, 3 1 2 3.4509 10 11.8, 0.9546 c InK T R − = × − =
Equally, in Table 3, the G ∆ values were all relatively positive except for the G ∆ of phenol at 313 K . The increase in the values of G ∆ as the temperature of the adsorption process increased indicated that the simultaneous binary adsorption of phenol-2-chlorophenol became less favourable at higher temperatures and showed its non-spontaneity. Hence, the binary adsorption process is endogenic. The negative values of H ∆ for phenol and 2-cholorphenol, as illustrated in Table 3 lent credence to the exothermicity of the binary adsorption process. Also, the small negative values of H ∆ indicate that the simultaneous binary adsorption of phenol and 2-chlorophenl on the optimized extracted chitosan is physical in nature involving Van der Waal’s (weak) forces of attraction. This thereby demonstrates that the process is stable energetically with loose bonding between the adsorbate molecules and the adsorbent surface [50, 51]. The negative values of S ∆ for phenol and 2-chlorophenol in the binary adsorption system suggested that the degree of randomness at the solid-solution interface decreased
as a result of the adsorbates (phenol and 2-chlorophenol)
adsorption onto the optimized chitosan extracted from pink
shrimp shell wastes. However, the value of S
∆ was negligibly
small i.e., nearly zero(
$$ \left(\Delta S \approx 0\right), $$
, implying that equilibrium
conditions were established during the binary adsorption
experiment.
Conclusion
The simultaneous binary adsorption of phenol and 2-chlorophenol on extracted optimized chitosan from pink shrimp shell wastes was investigated in batch mode. The simultaneous uptake of phenol and 2-chlorophenol was affected by temperature, pH, adsorbent dose, and agitation speed, initial concentration of the adsorbate and contact time. The kinetic study showed that the pseudo second- order kinetic model was the best fit for both the phenol and 2-chlorophenol uptake in the adsorption system. The analyses of the equilibrium isotherms indicated that Fritz- Schlüender multicomponent isotherm best fitted the binary adsorption system equilibrium data. The thermodynamic studies revealed that binary adsorption of phenol and 2-chlorophenol on the extracted optimized chitosan was non-spontaneous, endogenic, exothermic and relatively favourable at the measured temperatures. Hence, the results of this study illustrate that chitosan extracted from pink shrimp shell wastes is an effective, efficient and environmentally friendly adsorbent that can be used practically for the adsorption of multicomponent organic solvents in industrial wastewater effluents.
Statements and Declarations
Funding
Not applicable so, the authors hereby declare that no funds, grants, or other support from funding agencies in the public, commercial or non-profit sector, were received during the preparation of this manuscript.
Compliance with Ethical Standards
Conflict of interest
On behalf of all authors, the corresponding author states that there is no conflict of interest that is directly or indirectly related to this work within the last 3 years of commencement of the work to the period of submitting it.
References
-
Rahmani Ar, Hossieni E, Poormohammadi A (2015) Removal of Chromium (VI) from Aqueous Solution using Electro-Fenton Process. Environ Processes 2(2): 419- 428.
-
Chung TP, Tseng HY, Juang RS (2003) Mass Transfer Effect and Intermediate Detection for Phenol Degradation in Immobilized Pseudomonas Putida Systems. Process Biochemistry 38(10): 1497-1507.
-
Polat H, Molva M, Polat M (2006) Capacity and Mechanism of Phenol Adsorption on Lignite. International Journal of Mineral Processing 79(4): 264-273.
-
Ucun H, Yildiz E, Nuhoglu A (2010) Phenol Biodegradation in a Batch Jet Loop Bioreactor (JLB): Kinetics Study and pH Variation. Bioresource Technology 101(9): 2965- 2971.
-
USEPA (2014) United States Environmental Protection Agency Priority Pollutant List 40 CFR Part 423 Appendix A. United States Environment Protection Agency USEPA, New York.
-
Busca G, Berardinelli S, Resini C, Arrighi L (2008) Technologies for the Removal of Phenol from Fluid Streams: A Short Review of Recent Developments. Journal of Hazardous Materials 160(2-3): 265-288.
-
Salame II, Bandosz TJ (2003) Role of Surface Chemistry in Adsorption of Phenol on Activated Carbons. Journal of Colloid and Interface Science 264(2): 307-312.
-
Olafadehan OA, Aribike DS (2000) Treatment of Industrial Wastewater Effluents: Adsorption of Organic Compounds on Granular Activated Carbon. J Nig Soc Chem Eng 19: 50-57.
-
Aribike DS, Olafadehan OA (2008) Modeling of Fixed Bed Adsorption of Phenols on Granular Activated Carbon. Theoretical Foundations of Chemical Engineering 42(3): 257-263.
-
Girish CR, Ramachandra Murty V (2014) Adsorption of Phenol from Aqueous Solution using Lantana Camara, Forest Waste: Kinetics, Isotherm, and Thermodynamic Studies. International Scholarly Research Notices 2014: 1-16.
-
Lurtwitayapont S, Srisatit T (2010) Comparison of Lead Removal by Various Types of Swine Bone Adsorbents. Environment Asia 3(1): 32-38.
-
Rezaee A, Rangkooy HA, Khavanin A, Jonidi-Jafari A, Soltani RDC, et al. (2011) Adsorption Properties and Breakthrough Model of Formaldehyde on Bone Char. Int J Environ Sci Dev 2(6): 423-427.
-
Olafadehan OA, Jinadu OW, Salami L, Popoola LT (2012) Treatment of Brewery Wastewater Effluent using Activated Carbon Prepared from Coconut Shell. International Journal of Applied Science and Technology 2(1): 165-178.
-
Okoya AA, Akinyele AB, Amuda OS, Ofoezie IE (2016) Chitosan-grafted Carbon for the Sequestration of Heavy Metals in Aqueous Solution. Chemical Science International Journal 11(3): 1-14.
-
Kumar S, Zafar M, Prajapati JK, Kumar S, Kannepalli S (2011) Modeling Studies on Simultaneous Adsorption of Phenol and Resorcinol onto Granular Activated Carbon from Simulated Aqueous Solution. Journal of Hazardous Materials 185(1): 287-294.
-
Bamgbose JT, Adewuyi S, Bamgbose O, Adetoye AA (2010) Adsorption Kinetics of Cadmium and Lead by Chitosan. African Journal of Biotechnology 9(17): 2560- 2565.
-
Olafadehan OA, Amoo KO, Ajayi TO, Bello VE (2021) Extraction and Characterization of Chitin and Chitosan from _Callinectes amnicola_ and _Penaeus notialis_ Shell Wastes. J Chem Eng Mater Sci 12(1): 1-30.
-
Ikhuoria EU, Omonmhenle SI (2006) Removal of Heavy Metals from Aqueous Solution by Adsorption onto Chemically Modified Pumpkin (Telfaira accidentalis Hook) Seed Husk. J Chem Soc Nig 31: 109-113.
-
Amoo KO, Olafadehan OA, Ajayi TO (2019) Optimization Studies of Chitin and Chitosan Production from Penaeus notialis Shell Waste. African Journal of Biotechnology 18(27): 670-688.
-
Allen SJ, Mckay G, Porter JFT (2004) Adsorption Isotherm Models for Basic Dye Adsorption by Peat in Single and Binary Component Systems. Journal of Colloid and Interface Science 280(2)**:** 322-333.
-
Limousin G, Gaudet JP, Charlet L, Szenknect S, Barthes V, et al. (2007) Sorption Isotherms: A Review on Physical Bases, Modeling and Measurement. Appl Geochem 22(2): 249-275.
-
Kumar V, Sivanesan S (2007) Sorption Isotherm for Safranin onto Rice Husk: Comparison of Linear and Non- linear Methods. Dyes and Pigments 72(1): 130-133.
-
Ncibi MC (2008) Applicability of Some Statistical Tools to Predict Optimum Adsorption Isotherm After Linear and Non-linear Regression Analysis. Journal of Hazardous Materials 153(1–2): 207-212.
-
Yao C (2000) Extended and Improved Langmuir Equation for Correlating Adsorption Equilibrium Data. Separation and Purification Technology 19(3): 237-242.
-
Sips R (1948) On the Structure of a Catalyst Surface. J Chem Phys 16(5): 490-495.
-
Fritz W, Schlüender EU (1974) Simultaneous Adsorption Equilibria of Organic Solutes in Dilute Aqueous Solutions on Activated Carbon. Chem Eng Sci 29(5): 1279-1282.
-
Liapis AI, Rippint DWT (1977) A General Model for the Simulation of Multi-component Adsorption from a Finite Bath. Chem Eng Sci 32(6): 619-627.
-
Kushwaha JP, Srivastav VC, Mall ID (2010) Treatment of Dairy Wastewater by Commercial Activated Carbon and Bagasse Fly Ash: Parametric, Kinetic and Equilibrium Modelling, Disposal Studies. Bioresour Technol 101(10): 3474-3483.
-
Mestre AS, Bexiga AS, Proença M, Andrade M, Pinto ML, et al. (2011) Activated Carbons from Sisal Waste by Chemical Activation with K2CO3: Kinetics of Paracetamol and Ibuprofen Removal from Aqueous Solution. Bioresour Technol 102(17): 8253-8260.
-
Dalal RC (1974) Desorption of Phosphate by Anion Exchange Resin. Comm Soil Sci Plant Anal 5(6): 531-538.
-
Lagergren S (1989) About the Theory of So-called Adsorption of Soluble Substances. Kungliga Svenska Vetenskapsakademiens 24: 1-39.
-
Weber WJ, Morris JC (1963) Kinetics of Adsorption on Carbon from Solution. J Sanitary Eng Div ASCE 89(2): 31- 59.
-
Zeldowitsch J (1934) Uber Den Mechanismus Der Katalytischen Oxydation von CO an MnO2. Acta Physicochim 1(2): 364-449.
-
Yakout SM, Elsherif E (2010) Batch Kinetics, Isotherm and thermodynamic Studies of Adsorption of Strontium from Aqueous Solutions onto Low Cost Rice-Straw Based Carbons. Carbon Sci Technol 3(1): 144-153.
-
Boyd G, Adamson A, Myers L (1947) The Exchange Adsorption of Ions from Aqueous Solutions by Organic Zeolites; Kinetics. J Am Chem Soc 69(11): 2836-2844.
-
Morrison RT, Boyd RN (2004) Organic Chemistry. Pearson Education, Singapore.
-
Castillejos E, Rodríguez-Ramos I, Soria Sánchez M, Muñoz V, Guerrero-Ruiz A (2011) Phenol Adsorption from Water Solutions over Microporous and Mesoporous Carbon Surfaces: A Real Time Kinetic Study. Adsorption 17(3): 483-488.
-
El-Khaiary MI, Malash GF (2011) Common Data Analysis Errors in Batch Adsorption Studies. Hydrometallurgy 105(3-4): 314-320.
-
Olafadehan OA, Akpo OY, Enemuo O, Amoo KO, Abatan OG (2018) Equilibrium, Kinetic and Thermodynamic Studies of Biosorption of Zinc Ions from Industrial Wastewater using Derived Composite Biosorbents from Walnut Shell. Afr J Environ Sci Technol 12(9): 335-356.
-
Reichenberg D (1953) Properties of Ion-exchange Resins in Relation to their Structure. III. Kinetics of Exchange. J Am Chem Soc 75(3): 589-597.
-
Ho YS, Porter JF, Mckay G (2002) Equilibrium Isotherm Studies for the Biosorption of Divalent Metal Ions onto Peat, Copper, Nickel and Lead Single Component Systems. Water Air Soil Pollut 141: 1-12.
-
Wang XS, Qin Y, Li ZF (2006) Biosorption of Zinc from Aqueous Solutions by Rice Bran: Kinetics and Equilibrium Studies. Sep Sci Technol 41(4): 747-758.
-
Mohan D, Singh KP (2002) Single- and Multi-component Adsorption of Cadmium and Zinc using Activated Carbon Derived from Bagasse – an agricultural waste. Water Res 36(9): 2304-2315.
-
Sharma P, Das MR (2012) Removal of a Cationic dye from Aqueous Solution using Graphene Oxide Nanosheets: Investigation of Adsorption Parameters. J Chem Eng Data 58(1): 151-158.
-
Dash SN, Murthy VRC (2010) Preparation of Carbonaceous Heavy Metal Adsorbent from _Shorea_ _Robusta_ Leaf Litter using Phosphoric Acid Impregnation. Int J Environ Sci 1(3): 296-313.
-
Zahoor M (2011) Effect of Agitation Speed on Adsorption of Imidacloprid on Activated Carbon. J Chem Soc Pak 33(3): 305-312.
-
Ng JC, Cheung WH, McKay G (2003) Equilibrium Studies for the Sorption of Lead from Effluents using Chitosan. Chemosphere 52(6): 1021-1030.
-
Wong YC, Szeto Y, Cheung WH, McKay G (2003) Equilibrium Studies for Acid Dye Adsorption onto Chitosan. Langmuir 19(19): 7888-7894.
-
Kyzas GZ, Bikiaris DN, Mitropoulos AC (2017) Chitosan Adsorbents for Dye Removal: A Review. Polym Int 66(12): 1800-1811.
-
Al-Manhel AJ, Al-Hilphy ARS, Niamah AK (2016) Extraction of Chitosan, Characterisation and Its Use for Water Purification. J Saudi Soc Agric Sci 17(2): 186-190.
-
Sudha PN, Aisverya S, Gomathi T, Vijayalakshmi K, Saranya M, et al. (2017) Application of Chitin/Chitosan and Its Derivatives as Adsorbents, Coagulants, and Flocculants. In Chitosan, pp: 453-487.
- Nigeria’s Vulnerability in the Face of Global Energy Policy
- A Simulation Study of Investigation of Optimum Oil Production Performance by Applying Various Gas Injection Methods in Oil Reservoir
- Characterization of Permo-Triassic Reservoirs through Thermal Maturity Assessment of Westphalian Source Rocks in the Cheshire Basin
- Influence of Microwax on the Rheological and Thermal Behaviour of a Wax Crude Oil
- Real-Time Monitoring and Performance Optimization of Steam Injection in Heavy Oil Reservoirs Using Fiber Optic Sensing and Integrated Predictive Simulation Models
- Rapid On-Site Determination of the Total Petroleum Hydrocarbon Content of Soils by Handheld Fourier Transform Near-Infrared Spectroscopy: Development of a Global, Site- and Scanner- Independent Calibration Model