Gas Profiles Unravel Fractured and Compartmentalized Reservoirs
The profiles of gas in reservoirs of the Nene Oil Field in the Lower Congo Basin was modelled and evaluated for the objective of delineating the reservoir structure. The wells are NNM Well 6, NNM Well 301 and NNM Well 302. The C1 profiles show significant difference between wells 6 and 301 relative to well 302. The C1 profile for Well 302 unravels gas migrations from different compartments at the reservoir depth and mixes at a depth of 1.5KM. The observation also indicates the presence of a fracture that allow homogenization of the gases at that depth. The iC4/nC4 ratio for NNM Well 302 showed a profile for which the ratio is greater than 1.0 throughout the well section downdip. The observation portrays biodegradation throughout the well section generation from an immature source. The study shows that the NNM Well 6 reservoir is laterally compartmentalized from others, while all the well shoe some potential for vertical continuity of the wells.
Introduction
Gas geochemistry is a trending study, its applications includes exploration, appraisal, and environmental. In this study gas geochemistry is being employed to elucidate the feature of the reservoir housing the gases. The compositional distribution entails methane, Ethane, propane, butane and pentane but the iso and normal are inclusive for butane and pentane. Natural gas can be classified into biogenic and thermogenic and recently abiotic gas which are naturally found in igneous rocks [1]. Abiotic gas, instead, is produced by chemical reactions that do not require the presence of organic matter. While magmatic or mantle- derived CH4 is abiotic, not all abiotic CH4 is mantle-derived.
Magmatic and high temperature hydrothermal processes in volcanic and geothermal systems produce a gas mixture that is mainly composed of carbon dioxide. These reactions include magmatic processes and gas-water-rock reactions Biogenic gas which is also referred to as microbial gas is generated during diagenetic changes in sediments by microbial communities specifically Archaea at relatively lower temperatures such as 60°C–80°C and sometimes extremophiles which exist between 120°C and higher temperatures most especially in hydrothermal systems [2]. Biogenic gas is mostly methane inferring gas that is generated from shallow source rocks and normally stored in shallow reservoirs. Thermogenic gases are generated from mature source rocks and their compositional distribution entails ethane, propane, and butane in various percentages. This is the reason why thermogenic gas is also known as wet gas. The dry thermogenic gas is generated from post- matured source rocks [3]. This occurs during metagenesis, when the methane has been almost completely stripped of the organic remains of the source rock. During drilling, gas from the formations is encountered and is called mud gas, mud gas is obtained using a mud gas manifold which is connected to isotubes in which mud gas are stored for analysis. Usually, a mechanical system in which a motorized mud agitator excites and degases the mud, allowing the mud gas manifold and isotubes for storage analysis. The headspace gas is also present, this is referred to as gas that is derived from drill cuttings. Drill cuttings are stored in isojars containers immersed in water, the water allows the gases in the interstices of the rock to migrate out to the headspace of the sample container from which it could be samples and analysed. The type of gas and its compositional distribution may reflect reservoir systems, their migration pattern and seal integrity, maturity of the formation, and geological event such as tectonics. This study examines the gas data obtained from the Nene, Nene marine Wells in the Nene Oil field in the Lower Congo basin. The Major source rocks of the Congo Basin are in the Pre and Post Salt sections of the geology. The most productive source rock is associated with the Late Cretaceous transgressive events in the deep-water section with lacustrine environments both onshore and offshore [4, 5]. The petroleum system of the Lower Congo is the Congo Delta Composite Total Petroleum System and the primary source rock is the Lower Cretaceous Shales of the Bucomazi Formation with a type Kerogen [5]. Most of the reservoirs are of post and pre-rift age [5]. Location of the Nene Oil Field The oil field of study is the Nene oil Field, it is situated about 20km off the Congolese coastal line, which is part of the Western Passive African Margin in the Lower Congo Basin. The South Atlantic Opening resulted in the formation of sedimentary units such as horsts, grabens, and half grabens. Clastic deposition occurred in an alluvial plain and braided river environment, the lake systems provided for the deposition of rich organic shales. The water–depth is about 75 meters.
Materials and Methods
Materials and methods entail specifically samples, data, sampling techniques, analytical equipment and methods that were employed a study. In this study data was obtained as completion report, evaluation reports and as information folios/files from Eni Congo Company during the exploration phase in which three wells were drilled (NNM 6, NNM 301, and NNM 302) from the field Nene-Banga located in the offshore part of the Congolese coastal Basin.
Data and Data Treatment
Data use were basically gas data, which were obtained during drilling, the gas data are obtained as mudgas data or drill cuttings data. The gases are normally obtained using isotubes and gas bags. The gases are then analysed using Gas Chromatography-flame Ionization Detector (GC-FID). The compositional distribution consists C1, C2, C3, iC4 and nC4. The compositional distribution expressed as parametric ratios serves as the custodian of the geological information as portrayed by their precursors which is in turn inherent in the matrix of the formation. Data treatment was carried out with Techlog Version 2015. The software was used for expressing the parametric ratios as linear graphs and logplots, interpretation was accomplished using colour palette to represent parametric ratios in colour codes. The logplots express the variability of the parametric ratios across the formations depthwise.
Results and Discussion
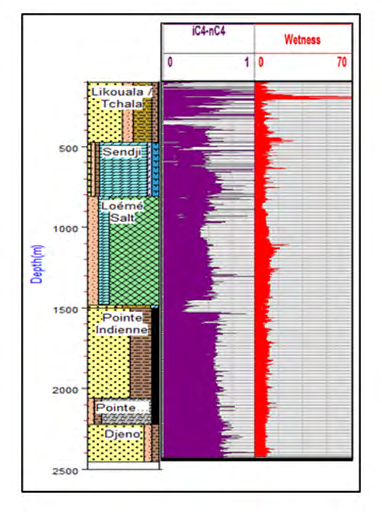
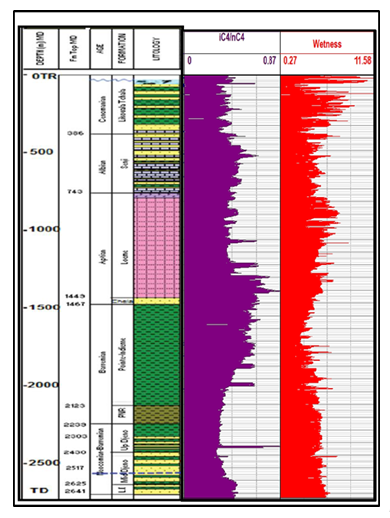
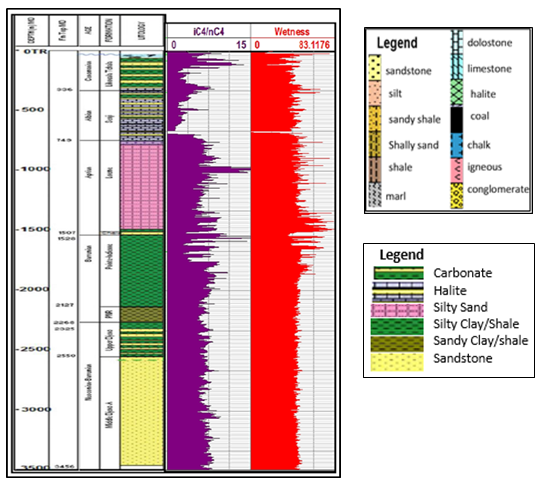
The results are presented as logview profiles of wetness and iC4/nC4 ratio of the gas data of the different Wells. Figures 1, 2, and 3 correspond to NNM6 (Nene Marine 6), NNM301 (Nene Marine 301), and NNM302 (Nene Marine 302) oil Wells.
The Logview Profiles
The wetness logplot for NNM6 (Figure 1) shows a consistent trend from the reservoir to the Pointe Noire Formation. The iC4/nC4 ratio showed an increasing gradient downdip through the shales of the Pointe Noire Formation into the sandstone of the Pointe Indienne Formation.
The boundary of the Pointe Indienne formation and the Chela (salt) Formation reveal a partial restriction on the iC4/ nC4 ratio. The consistent profile of the wet gas and the iC4/ nC4 ratio infers a continuous migration from the reservoir through the caprock of the reservoirs to the overlying formations. Figures 2 & 3 of wells NNM 301 and NNM 302 respectively also show similar trend for the corresponding wells. The standard for interpretation is that iC4/nC4 ratio greater the 1.0 represents gases that are biogenic or biodegraded, normally with high wetness ranging up to 70%.
NNM 301 Well has gases that are less mature with a maximum wetness of 12% and iC4/nC4 ratio of 0.87. At the depth of 1.5KM to the surface there are erratic show of increasing iC4/nC4 and wetness similar trend is observed in Well 302. Well NNM6 show a significant difference of wetness which is 70%. The difference in compositional distribution of the gas as represented by the parametric ratios unravels the potential compartmentalization of the reservoirs. The vertical continuity suggests the presence of a vertical fault or fracture that penetrated the reservoir. The reservoirs of the wells are in the Djeno Formation [6].
The reservoirs of the wells occur at the Djeno Formation, however, the descriptive lithology varies, the reservoir of NNM 302 is consist of mainly sandstones, while the reservoir of NNM 301 is consist of sandstone, halite and few carbonate intercalations. The reservoir of NNM 6 well is that of sandstones with shale and carbonate intercalations. The significant difference in the descriptive lithology indicated lateral compartmentalization.
The completion report indicates the presence of a fault and fracture, a plausible reason for the observed vertical continuity and laterally compartmentalized reservoirs.
The Methane Profile
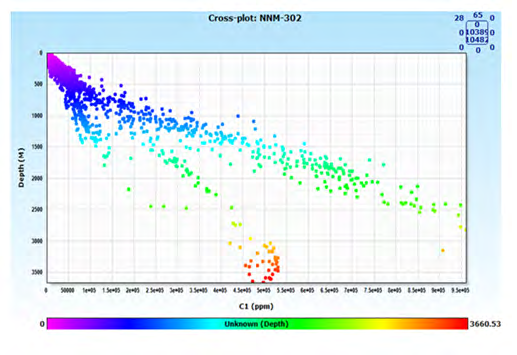
The methane profile downdip a well is an essential data, it informs the maturity and mixing depth for biogenic and thermogenic gas. The methane profile for NNM Well 6 as in Figure 4 shows an increasing trend depthwise with the highest concentration in the reservoir. A sudden spike in concentration is observed between the interface the Loeme Salt and the Chela Formation. The trend also infers that the gas is migration from the reservoir to more shallow formations. C1 profile for NNM Well 6 and NNM Well 301 (Figure 5) bear slightly similar trend however the C1 profile for NNM Well 302 (Figure 6) shows a trend for which the gas migrates from different compartments at the reservoir depth both mixes at a deep of 1.5km. The characteristics of the gas infers that the gas is not from same source and may also represent the migrational pathway of the gas, from different compartments showing some heterogeneity and an eventual homogenization (mixing) of the gases at more shallower depths (800m) [7, 8, 9]. Since the gases at the reservoir did not show similar genetic signature and compositional distribution then there is compartmentalization of reservoirs.
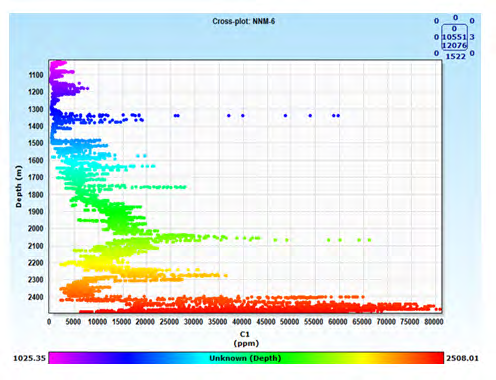
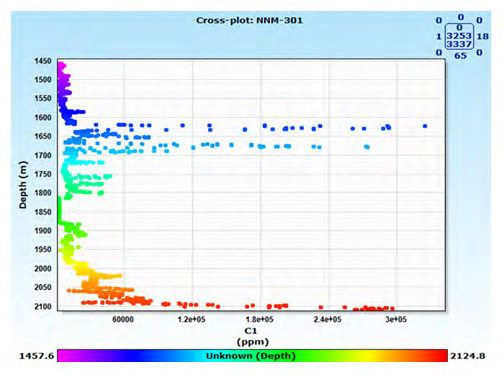
The migration of gas in Figures 4 and 5 are justified by the fact that there is a gradient of decreasing concentration of C1 from the reservoir to most shallow depth. The formations at the shallower depths are less mature and cannot generate insitu gases, thus migration from the reservoir, hydrocarbon always migrate upwards due to that buoyant pressure as a result of lower densities than water. Constant concentration of C1 between 1.650km and 1.350km can be attributed to dissipated pressure that region. The different trends of gas profiles in Figures 4-6 is due to the capillary pressure they will overcome while migrating and formation variability.
The Gas Wetness Profile
The gas wetness is expressed as (C2+C3+iC4+nC4)/ (C1+C2+C3+iC4+nC4) *100. The wetness profile in NNM Well 6 as in Figure 7, shows a more restricted trend in the reservoir compare to the shallower depth. The erratic occurrence of the wet gas in more shallow depth may be explained by the concept of insitu generation, where petroleum like hydrocarbons (PLHs) are generated as double bonded compounds which are later saturated by hydrogen to form alkanes, without necessarily attaining the thermal gradient for generation of petroleum [10]. Figure 8 shows the wetness profile for NNM Well 301, it portrays a more erratic occurrence of gases across the formations within the well. The observation is that of more gases in the shallower depth relative to the reservoirs. Figure 9 shows a significantly different trend of gas with 5% wetness at 100m which increases downdip to 80% at 2km but reduces to 45% at the reservoir (3.5km). The descriptive lithology explains the erratic occurrence to existence of intercalations of coarse sandstones and carbonated clays, silts, marls and bituminous layers. This observation potentially results in limitation in fluid flow with the intercalations behaving as baffles. The lithology change is vertical but the salt is a dome creating fractures, serving as better conduits for migration.
The iC4/nC4 Profile
The iC4/nC4 which is also the thermogenic signature provides the bases for differentiating the biogenic and thermogenic gases and the mixing tendencies. Figure 10 shows the iC4/nC4 profile in NNM Well 6, in the reservoir the gas is mature with a ratio less than 1.0. at ratios greater than 1.0 the n–alkanes are preferably depleted relative to the isoprenoid. The depth range of 1.1km to 1.9km is characterized by biodegradation. Figure 11, shows the iC4/ nC4 trend for NNM Well 301, basically similar to that of NNM Well 6 but with iC4/nC4 lower than 1, implying that the gases from the reservoir depth to the most shallow depth are mature.
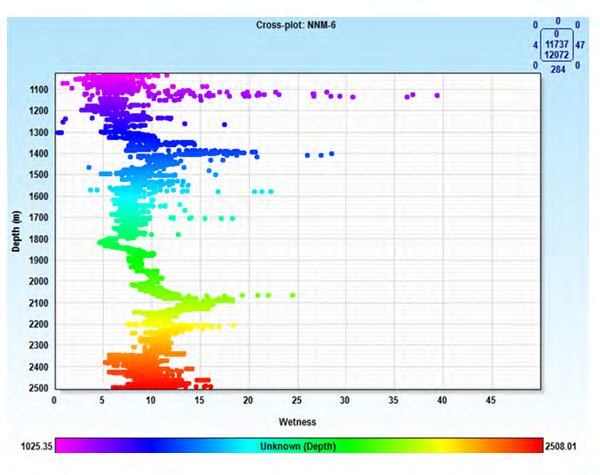
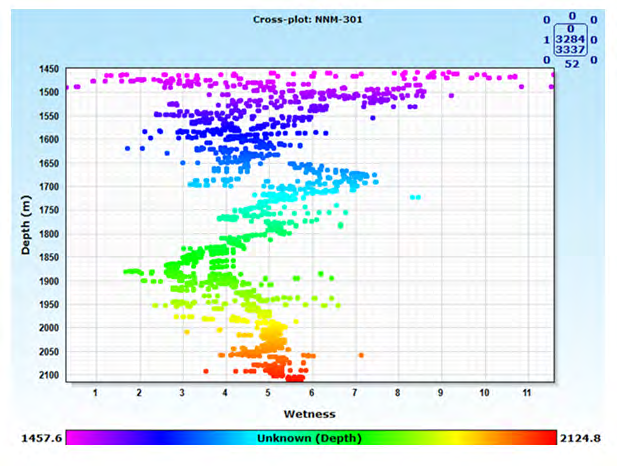
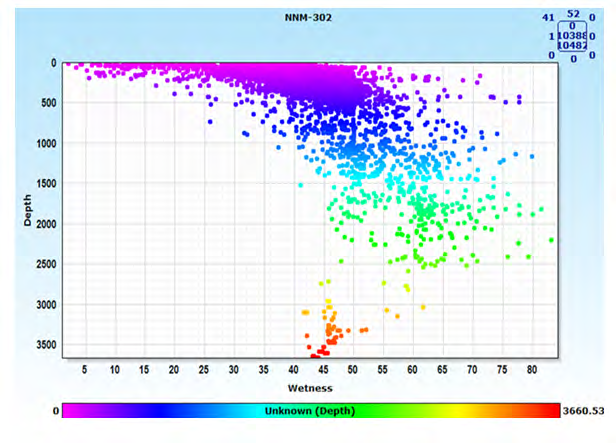
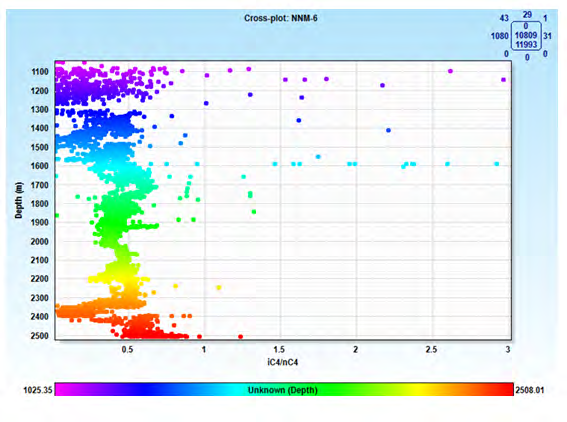
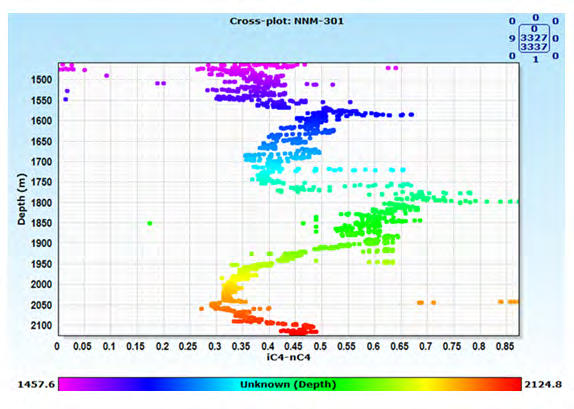
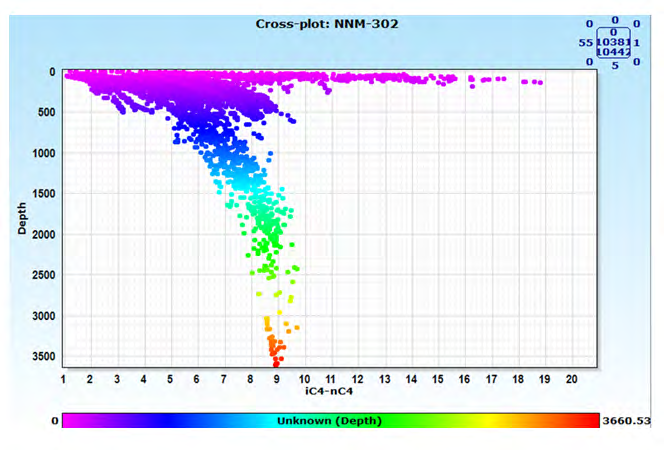
Figure 12 show that the iC4/nC4 profile reveal higher than 1.0 values across the well section, this infers greater tendency for the nC4 hydrocarbons to deplete relative to iC4 isomers. This portrays biodegradation throughout NNM Well 302 [10, 11]. It is observed that the profiles in different NNM Wells are significantly different, the heterogeneous nature of the compositional distribution of the gases invariably indicates the non-communicating nature of the reservoir compartments, and communicating reservoirs show homogeneity of the reservoir fluids, gas, oil, and water [12]. The gases generated into the reservoir may undergo mixing due to communication of the reservoirs via faults, fractures and extensive sandstone stringers [13, 14, 15, 16, 17].
Conclusion
The logview profiles of the gas across the depth dipwise of the different wells namely NNM Well 6, NNM Well301, and NNM Well 302 revealed that the wells have extensive vertical continuity which could be attributed to the fracture and fault system induced by the salt dome present in the field as a result of its diparic nature but the reservoirs are laterally/adjacently compartmentalized. The lateral compartmentalization is inferred by the differences in the compositional differences of wetness and iC4/nC4. The C1 profile for NNM Well 302 reveals gas migrating out from different compartments at the reservoir depth, however, the different pathways merge indicating mixing at the depth of 1km. The wetness and depth profile for NNM Well 302 also showed erratic occurrences of gas between the depth of 500 m and 1.5 km, this also corresponds to the fracture length above the reservoir in the Leome Salt Formation. The iC4/nC4 profile show that corresponding ratios downdip the well is greater than 1.0 indicating biodegradation. This may mean that a fault or fracture allows mixing at shallower depths.
References
-
Baldassare FJ, McCaffrey MA, Harper JA (2014) A geochemical context for stray gas investigations in the northern Appalachian Basin: Implications of analyses of natural gases from Neogene-through Devonian-age strata. AAPG Bulletin 98(2): 341-372.
-
Etiope G (2015) Natural Gas Seepage; The Earth’s Hydrocarbon Degassing. 1st(Edn.), Springer International Publishing AG Switzerland, London.
-
Mango FD (2001) Methane concentrations in natural gas: the genetic implications. Organic Geochemistry 32(10): 1283-1287.
-
Cole GA, Requejo AG, Ormerod D, Yu Z, Clifford A (2000) Petroleum geochemical assessment of the Lower Congo Basin. In: Mello MR, et al. (Eds.), Petroleum Systems of South Atlantic Margins. American Association of Petroleum Geologists, USA, 73.
-
Brownfield ME, Charpentier RR (2006) Geology and total petroleum systems of the West-Central Coastal Province (7203), West Africa. U.S. Geological Survey Bulletin 2207, Reston, Virginia.
-
Thrasher J, Fleet AJ, Hay SJ, Hovland M, Duppenbecker S, et al. (1996) Understanding geology as the key to seepage in exploration: spectrum of seepage styles. In: Schumacher D, et al. (Eds.), Hydrocarbon migration and its near–surface expressions. AAPG memoir, Tulsa, pp: 223-241.
-
Hu G, Li J, Shan X, Han Z (2010) The origin of natural gas and the hydrocarbon charging history of the Yulin gas field in the Ordos Basin, China. International Journal of Coal Geology 81(4): 381-391.
-
Hunt A, Darrah TH, Poreda RJ (2012) Determining the source and genetic fingerprint of natural gases using noble gas geochemistry: A northern Appalachian Basin case study. AAPG Bulletin 96(10): 1785-1811.
-
Jenden P, Drazan DJ, Kaplan IR (1993) Mixing of thermogenic natural gases in northern Appalachian Basin. AAPG Bulletin 77(6): 980-998.
-
Dembicki H (2017) Practical Petroleum Geochemistry for Exploration and Production. 1st(Edn.), Elsevier Inc., Amsterdam, Netherland.
-
Whiticar MJ (1994) Correlation of Natural gases with their sources. In: Magoon LB, et al. (Eds.), The petroleum system–from source to trap. AAPG, Tulsa, pp: 261-283.
-
Snedden JW, Vrolijk P, Sumpter L, Sweet ML, Barnes KR, et al. (2007) Reservoir Connectivity: Definitions, Examples, and Strategies. International Petroleum Technology Conference, Volume IPTC 11375, pp: 1-6.
-
Mearns EW, McBride JJ (1999) Hydrocarbon filling history and reservoir continuity of oil fields evaluated using 87S/86S isotope ratios variations in formation water with examples from the North Sea. Petroleum Geosciences 5(1): 17-27.
-
Ala M (2017) An Imperial College lectures in petroleum engineering. Volume 1, World Scientific Publishing Europe Ltd, Covent Garden, London.
-
Allen TO, Roberts AP (1989) Production Operations. 3rd (Edn.), Oil and gas Consultants International, Tulsa, Oklahoma.
-
Knipe RJ, Jones G, Fisher QJ (1998) Faulting, Fault Sealing and Fluid Flow in Hydrocarbon Reservoirs. The Geological Society of London, Piccadilly, London.
-
Zoback M (2007) Reservoir Geomechanics. Cambridge University Press, Cambridge, London.
- Nigeria’s Vulnerability in the Face of Global Energy Policy
- A Simulation Study of Investigation of Optimum Oil Production Performance by Applying Various Gas Injection Methods in Oil Reservoir
- Characterization of Permo-Triassic Reservoirs through Thermal Maturity Assessment of Westphalian Source Rocks in the Cheshire Basin
- Influence of Microwax on the Rheological and Thermal Behaviour of a Wax Crude Oil
- Real-Time Monitoring and Performance Optimization of Steam Injection in Heavy Oil Reservoirs Using Fiber Optic Sensing and Integrated Predictive Simulation Models
- Rapid On-Site Determination of the Total Petroleum Hydrocarbon Content of Soils by Handheld Fourier Transform Near-Infrared Spectroscopy: Development of a Global, Site- and Scanner- Independent Calibration Model