Statistical and Numerical Investigation of the Effect of Wellbore Trajectories in Williston Basin Horizontal Wells and their Effects on Production Performance
Unconventional plays development requires multistage hydraulically fractured horizontal wells; the wells’ trajectories are complexes and follow different patterns, such as toe-up, toe-down, hold-toe-up, and hold-toe- down. The trajectories patterns and undulations are caused by different factors and do have different consequences on the production performances, literature lacks field data highlighting the effect of the wells’ trajectories on production performance, thus the importance of the present paper’s statistical analysis. The objective of the study is to identify the influence of wells trajectories on their performances based on the public production database provided by the North Dakota Industrial Commission (NDIC) for Williston Basin wells. To achieve the objective, it is required to characterize the undulation and trajectories, Firstly, based on the literature review, drilling methods and technologies used during the lateral section drilling do have an impact, and their selection is crucial for final undulations status and trajectories which influences the production behavior of the wells. Secondly, using an in-house developed code, 22,867 North Dakota Williston Basin drilled horizontal wells are analyzed, and the average angle change (AAC) is calculated for each individual lateral leg, along with the angles arithmetic average (AAA) and Sinuosity Index (SI). Due to the apparent erratic production behavior, a parameter has been defined called Normalized Production Efficiency (NPE) for Oil, Water, and Gas phases, specifically defined to remove 1) the effect of spatially distributed productivity variation, i.e. center of the basin is more productive than the basin periphery. 2) different stimulation treatment sizes, and 3) Early time production peaks. And then the Normalized Production Efficiency was plotted through heat maps and through scatter plots to observe its dependence on the undulations-related parameters. First, it is found that the Williston basin is dominated by toe-down wells and based on the literature review the following statements are inferred, 1) In terms of production performances when compared to the toe-up trajectories, fewer flow instabilities are expected. 2) Higher risk of water and solids accumulation are to be considered, and 3) Larger gas-oil-ratio variation during well production is to be expected. Second, the Normalized production efficiency exhibits a weak inverse correlation to the AAC, where higher AAC tends to correspond to lower normalized production efficiency meaning lower cumulative oil produced. Interestingly the normalized production efficiency parameter forms a bell-shaped scatter plot with the AAA parameter suggesting a spatial dependency as it is expected to see fewer deviated wells in the basin center compared to its flanks. After plotting the NPE for oil, AVG, and AAC on a heat map across the basin, it is shown that no special dependency is exhibited. Similar results are observed for NPE of Water and Gas. The study concludes that flat and toe-down trajectories have the highest probability of showing higher productivity regardless of the well position in the basin or its stimulation treatment. Except the described trend No claim on a quantifiable relationship, with regards to trajectory or undulations can be made and a more detailed study is required, with better assessment of formation quality variability across the basin, and parent, child wells interactions.
Introduction
The Bakken and Three Forks oil-bearing formations, located in the Williston Basin, produced in North Dakota and Montana in the United States, and Saskatchewan and Manitoba in Canada. Most wells in this area are drilled in the Three Forks or Middle Bakken members. Currently, 65.8% of the existing wells are horizontal, the remaining are either vertical or directional [1]. Along with the development of hydraulic fracturing, horizontal drilling enabled the production of unconventional and tight formations basin- wide [1] Figure 1.
![Figure 1: North Dakota Williston Basin wells type vertical (blue), horizontal (orange), and directional (green), source [1].](/fulltextimages/9649/fig_1.png)
![Figure 2: Monthly oil production versus time, as a function of wellbore trajectory [1].](/fulltextimages/9649/fig_2.png)
Oil production, after being dominated by vertical wells in the past, is now obtained at 98% from the horizontal hydraulically fractured wells as shown in Figure 2. The 22,867 horizontal wells have an average lateral length of
8,500 ft for a total depth of 19,200 ft with an MD/TVD ratio of 2.25 on average. Since 2006, wells in the Williston basin were drilled using extended-reach drilling. Hence, the lateral section length is longer than what is usually practiced for conventional wells [1].
With advancement of technology, especially the bit design, the lateral length continuously increased over time as it is seen from Figure 3. This will increase production due to higher reservoir contact and larger numbers of hydraulic fracturing stages (see Figure 4), given the lower productivity of unconventional wells.
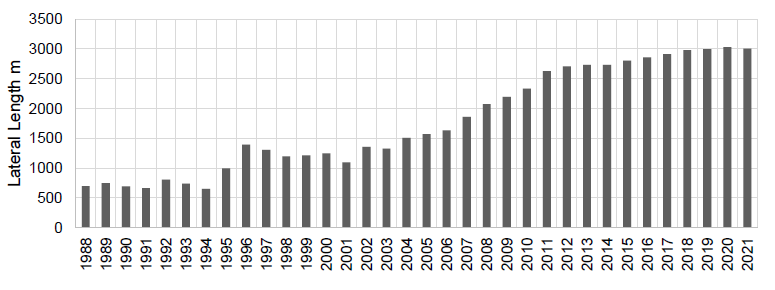
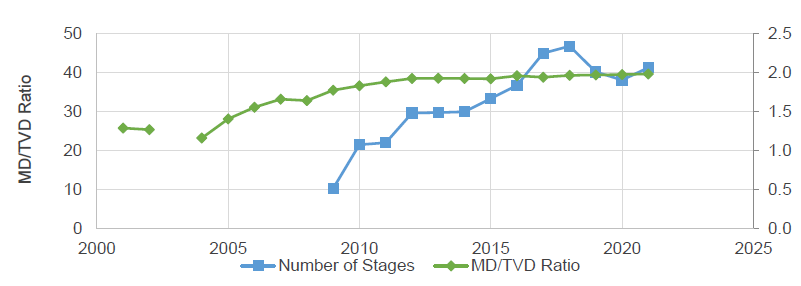
Over time, not only the lateral length increased, but so did the total length to true vertical depth ratio, a consequence of the domination of horizontal wells, as depicted in Figure
4. The average number of hydraulic fracturing stages first gradually increased to 47 from 2009 until 2019, then decreased and stabilized at 40 stages.
Two parameters are usually used by drilling engineering professionals: undulations and tortuosity. While the undulations are two-dimensional in terms of true vertical depth variation versus measured depth, the tortuosity takes into account the dogleg severity deviation between the planned well path and the as-drilled path. The latter is defined by the average excess of dogleg severity over the path, the mean unwanted dogleg severity, and the average angle change (AAC) as described by Weijermans, et al. [2], the latter of which has been adopted in this study. The lateral well path of the Nordeng 34X-23A well is shown in Figure 5, where the as-drilled path oscillates above and under the target envelope and its center is designed to follow the middle Bakken.
Intentional undulations are usually performed to enhance the inflow performances from the reservoir to the wellbore by increasing the contact area and reducing the dependency on the vertical permeability while enabling the access of multiple thin layers of reservoirs [3].
Unintentional undulations result from the directional drilling control limitations caused by either formation characteristics, directional drilling technology used, or both [3]. Several technologies have been developed to enhance the directional drilling rotary steerable systems (RSS) control and steerability, enabling the undulation reduction (amplitude and index), such as the continuous proportional steering method (CPSM) which reduces the average angle change by up to 4 folds [4].
In the literature, undulations are usually considered a well-centric parameter, and no basin, field, or statewide statistical analysis has been previously reported. An overview of the undulations’ magnitude and their spread over a wide range of wells, fields, and zones located in North Dakota provides a quantified view of how well paths deviate from an ideal one. On the other hand, the effect of undulations on production performances has been studied by Tang, et al. [5] and can be looked at from different angles. These can be reservoir inflow, wells liquids loading, sand transport and accumulation, and unstable slug flow. Excluding a deliberate and specific undulated configuration that increases reservoir- to-well contact, all the undulation effects are negative and jeopardize the production performances of the wells.
![Figure 5: Well Nordeng 34X-23A cross-section of the lateral leg, with targeted path, as-drilled path, top, bottom, and center of the target, formations top of Upper, Middle, and Lower Bakken [6].](/fulltextimages/9649/fig_5.png)
The present study discusses the statistical analysis with regards to Williston wells trajectories distribution, and their related vertical depth variation amplitude, with an effort to correlate the production performances to the trajectory and undulations of the well. Its novelty relies on the methodology, which requires newly defined KPIs’ and the large database from which it extracts the trajectory and production data and calculates the key performances indicators; the production efficiency index is a parameter defined for the sole objective of this study, trying to capture trajectories and undulations effect.
First, the database is analyzed, and wells that correspond to trajectory and production history criteria are selected; then, the production efficiency index of oil, water, and gas is calculated for each well along with the wells’ AAC, AAA, MA, and SI trajectory characteristics. The dominant trajectories are identified using the distributions of each parameter for an assessment of the explored data ranges and dominant structures. The final step is to assess whether a quantifiable correlation or trend can be captured between production efficiency indexes and trajectory or undulations related parameters.
Trajectory Effect on Severe Slugging Tendency and Production Performances
The effects of undulations on production performances are briefly reviewed in this section with reference to the lab experiments, field data, and simulation works performed by researchers.
Tang et al. [5] studied the effect of sinusoidal horizontal well lateral undulations on the slugging tendency of the multiphase flow. The study showed that undulation can onset slugging flow regime through a flow chocking due to heavier phases (water and oil) accumulations in sumps. In this vein, higher undulations amplitude reduces the slugs’ frequency and increases the slug volume or liquid inventory change.
Norris [7] conducted transient flow simulations for different well geometries and flow conditions. They showed that, as the pressure declines below the bubble point, severe slugging is expected. It is suggested that the toe-down geometry generates fewer instabilities compared to the toe- up configurations. The suggested remedial recommendations included higher surface pressures, smaller lateral section diameter, and vapor- liquid separation at the heel. Veeken, et al. [8] found that the simulations performed for liquid loading of a gas well, the simulations did not show an effect of the undulation on the critical gas velocity required to lift the liquid to the surface, while experiments showed that the undulations affect the critical gas velocity and the onset of the liquid loading.
Malekzadeh and Mudde [9], through their simulation works, analyzed the effect of undulations using Vogel’s modified inflow performance relationship for horizontal wells [10], which concluded that severe slugging may be initiated by the trajectory undulations occurring at the bottom of the well, and the pressure fluctuations can influence the reservoir performances.
Brito, et al. [11], after experimenting with a toe-up, toe- down, one hump, and one sump undulations observed that the slug lengths were up to four times higher than the ones reported in the literature. Additionally, the lateral deviation angle and length affect the vertical sections of the slug flow development, and the lateral section slug flow development is affected by the liquid fall back from the vertical section and lateral length. Slug Merging between lateral and vertical sections occurs by a decreased frequency and an increased slug length, while dissipation can be observed if short unstable slugs are generated at the lateral section.
Suarez-Rivera, et al. [12] based their study on 212 wells from the Eagle Ford and observed that the 5% to 20% reservoir quality (RQ) variation does not explain the large variation of the production performances. Pankaj, et al. [13] analyzed the effect of the wellbore quality (WQ) and completion quality (CQ) on production performances. With completion quality being related to the geometry of the hydraulic fractures, the wellbore quality is dependent on the wellbore pressure loss driving factors, such as the connection to the hydraulic fractures, the undulations, and production technique and flow back practices. The author considered the following trajectories: horizontal, toe-down, toe-up, hold-toe-up, and hold-toe-down. Pankaj, et al. [13] concluded that horizontal and toe-up trajectories have the highest productivity index, whereas the hold-toe- down has the lowest. The GOR variation is the largest for the hold toa e-down, while the water cut variation is the smallest for the same case. The toe-up and hold-toe-up trajectories, showed the earliest onset of unstable production, hence severe slugging due to higher liquid accumulations at the heel.
Important to note that the flat horizontal trajectory shows the highest cumulative, whereas the toe-down and hold toe-down, are the most underperforming trajectories, due to production impairment of the stages close to the toe, by water accumulation.
Tebowei, et al. [14] using Computational Fluids Dynamics (CFD), showed that the undulations influence sand transport in the horizontal laterals undulated liner, where the solid transport regime is significantly altered, and sand deposition occurs downstream of a sump (V-inclined) at much higher fluid velocities.
Tran, et al. [15] performed a simulation study and showed that during early years the trajectory has minimal impact, and significant effect on slugs’ severity at late years.
With highest instability observed for toe- up trajectories, low undulations increase the flow instability while large undulations reduce the severity of slugging. Toe-down shows the lowest instabilities and higher cumulative, the study conclude that undulations do have a negative effect on toe- down trajectories and a positive effect on toe-up trajectories, but no quantification is performed.
Khetib, et al. [16] captured the geomechanical effect of the severe slugging pressure variations on the hydraulic fracture aperture through effective stress variation and showed that for a typical Williston basin well completion and flowing condition the hydraulic fracture is subject to large aperture variation and proppant dis-embedment is possible. It is worth noting that Khetib, et al. [17] demonstrated experimentally and numerically that it is possible to dampen the flow instabilities by using a dampening pipe volume, such as the annular space of the well.
Williston Basin Statistical Analysis Methodology
Considering a lateral section starts at an angle lower than ±5° from the horizontal (85-95° from the vertical), a statistical analysis was conducted on 10,428 wells where the angles of the lateral section deviation survey were considered for the analysis. The 10,428 wells contained exclusively horizontal wells and re-entry, discarding the vertical and directional wells from the 38,140 wells database. Further criteria were used to refine the database down to a selection of wells suitable for our study:
- Drain length: To capture sufficiently long lateral sections, we selected only wells with a minimum length of 5000 ft (1,524 m), which represent the typical length of the unconventional well’s development in 2006, (Figure 5).
- Production pool: Only wells that target the Bakken pool were selected.
- Data availability: Only wells that have a significant production history, a deviation survey, stimulation data and formation thickness data were selected.
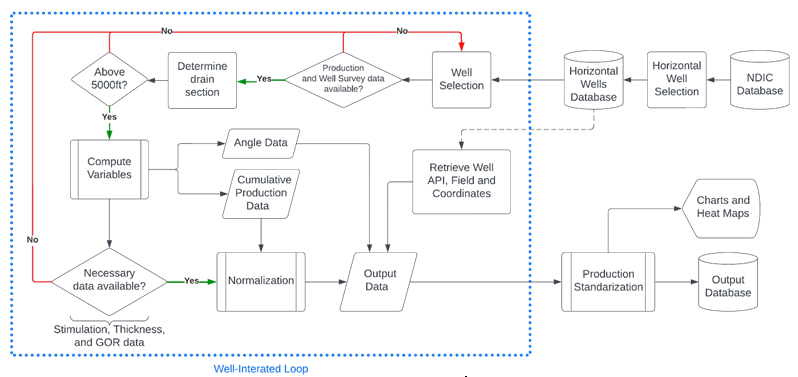
After applying the aforementioned criteria, the number of statistically analyzed wells was reduced to 2180 well. The code used to perform the analysis is available through GitHub Allam & Khetib [18], an illustrative schematic of it.
Parameters Definitions
Average Angle Change (AAC). To characterize the undulations, the Average Angle Change (AAC) from the horizontal direction parameter is used as suggested by Weijermans. et al. [2]:
1 1 1 2 + + = + − = − ∑ (1)
( )( ) 1 N α α −
MD MD AAC MD MD n n n n n M
N M Here, M and N are the first and last lateral survey point, respectively, 𝛼 is the difference between the angle at the survey point and the horizontal (90 deg).
The AAC represents the average deviation from 90 deg of each survey inclination data, and it is especially useful when non-equal distances data are available and can be considered the average angle change per unit length of each well.
Arithmetic Average Angle (AAA): It is a parameter, which is not related to the section length, was used to highlight the importance of the average angle change, which is defined for each well as: N α = ∑ (2) Sinuosity Index (SI): It is translating the magnitude of well trajectory deviation from a straight line is calculated to investigate its correlation with production performances, the sinuosity index is calculated as follows:
n n AAA N
1 Cos 2
( ) ( ) ( )
− = − ∑ ∑
1 N α − MD MD SI MD MD
1 n n n n M
+ = (3) ( )
1 N −
1 n n n M
+ = Maximum Amplitude (MA): It is for the lateral section of the wells, the maximum amplitude of vertical depth variation is calculated for each well, this parameter influences the hydrostatic pressure (Head) required to move a fluid particle from the lower most point to the uppermost point in the horizontal section and is calculated as below:
𝑀𝐴 = 𝑚𝑎𝑥 𝑇𝑉𝐷 − 𝑚𝑖𝑛 (4) Normalized Production Efficiency (NPE): It is to quantify the productivity of the hydraulically fractured horizontal oil wells and isolate the effect of reservoir quality, stimulation treatment, and early production performances which are not affected by the well’s trajectories, a production efficiency parameter has been defined and normalized to remove the effect of basin-wide spatial distribution. The NPE is calculated for each phase (Oil, Water and Gas) as below:
CumOil NPE Oil T STG PC h CumGOR = ∗ ∗ ∗∗ (5)
CumWater NPE Water T STG PC h CumGOR = ∗ ∗ ∗∗ (6)
CumGas NPE Gas T STG PC h CumGOR = ∗ ∗ ∗∗ (7)
Where CumOil, CumWater and CumGas, are the cumulative quantities of oil, water and gas, after 24 months of production. TO, TW and TG is the number of months considered for the cumulative Oil, Water or Gas respectively. STG is the number of hydraulic fracturing stages. PC is the Proppant concentration per feet. h is the formation thickness, CumGOR is the cumulative GOR.
Outlier values were eliminated from the NPE tables by taking only values that are equal or smaller than 3σ. After dividing by the latter, we obtain NPE values between 0 and 1.
The workflow used to perform the present study is shown in Figure 6, where a well-centric loop read data from NDIC Database, calculates all the required parameters, and stores the results locally.
Statistical Calculations Results Analysis
Well Trajectories Distribution
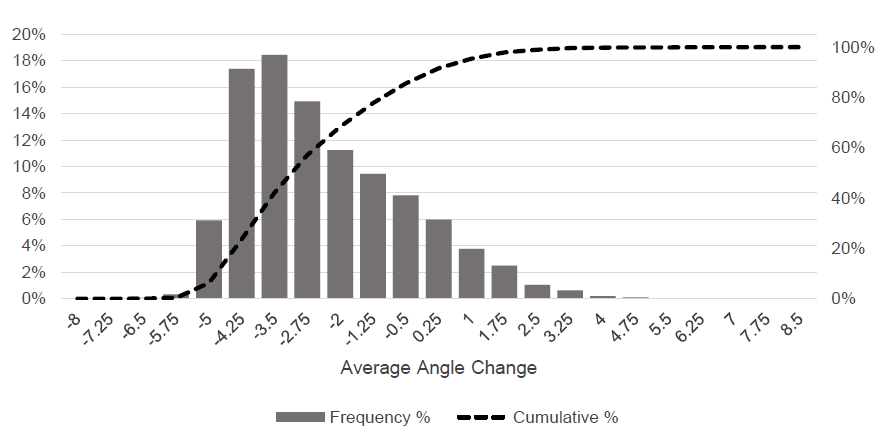
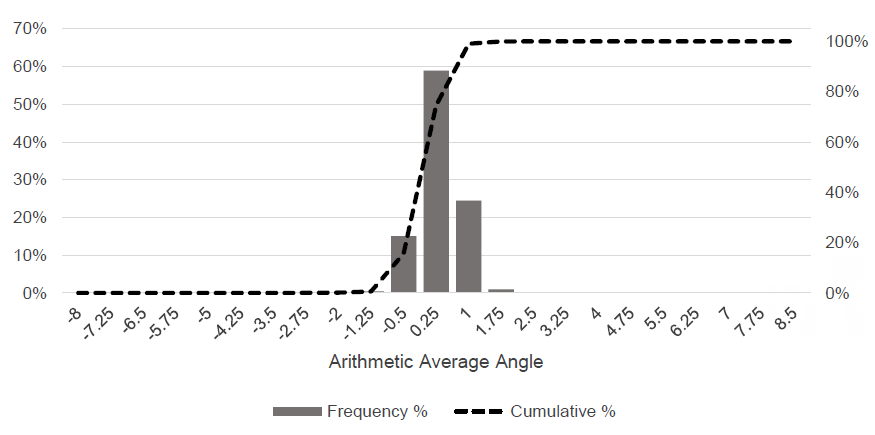
The frequency and cumulative distribution of the average angle changes are shown in Figure 7. It is seen, from this figure that, more than 84% of the average angle changes are negative, with only 15% being positive. This implies that the unconventional horizontal wells are dominated by a toe- down path, with most of the AAV’s being between -2.0 and -4.25.
The frequency distribution changes of AAA’s for the 5,372 wells are shown in Figure 8. From this figure, one can see that 15% of AAA’s are negative and 83% are positive, i.e.
the percentage of positive AAA’s is more than five times than that of the negative ones, which expresses a toe-up trend.
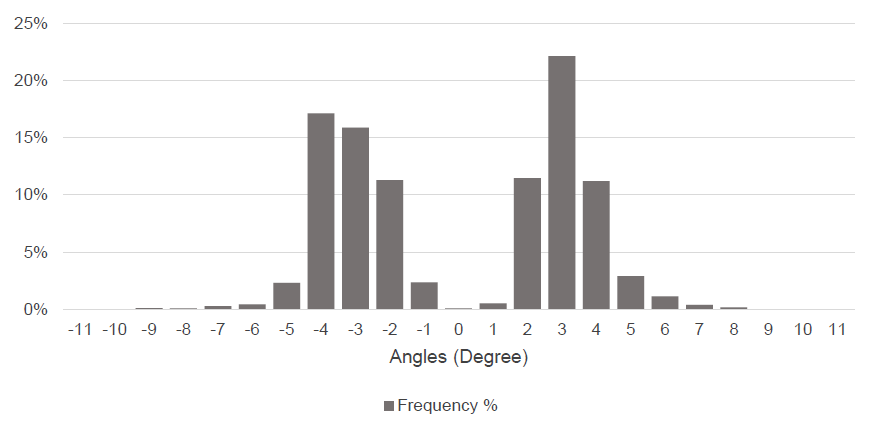
The AAC appears to be a more representative parameter to characterize the well configuration of horizontal wells, thus, most of the drilled lateral lengths are of negative slope, which influences production performances. Additionally, the dominant minimum angle is -3⁰ to -4⁰, while most maximum angles fall within the 3⁰ range. It is well known that an angle of ± 1⁰ affects the flow response and can cause slugging flow within the considered section [19]. As the absolute value of the dominant minimum angle is greater than the dominant maximum angle value, the dominance of the toe-down well path can be verified (Figure 9).
Individual example wells NDIC# 17451, and 24285 lateral angles distribution is shown in Figure 15 and Figure 17respectively, where Toe-Down, and Toe-down/Toe-Up trajectories are shown along with their respective deviation survey.
Maximum Amplitude Distribution
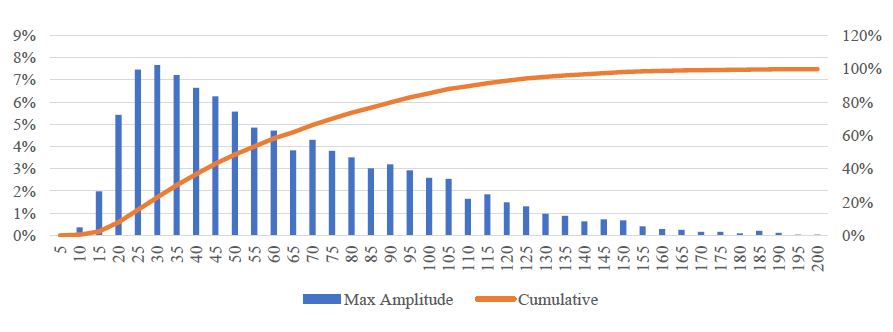
In terms of maximum amplitude, it can be seen in Figure 10 that the lateral section amplitude mean is at 30ft of vertical depth variation from heel to toe; no distinction is made between whether the angle is positive (toe-up) or negative (toe-down). A right-skewed gamma distribution type, with a relatively high standard deviation, with 46.5% of the cases showing a maximum amplitude variation from 20 to 50 ft.
Sinuosity Index Distribution
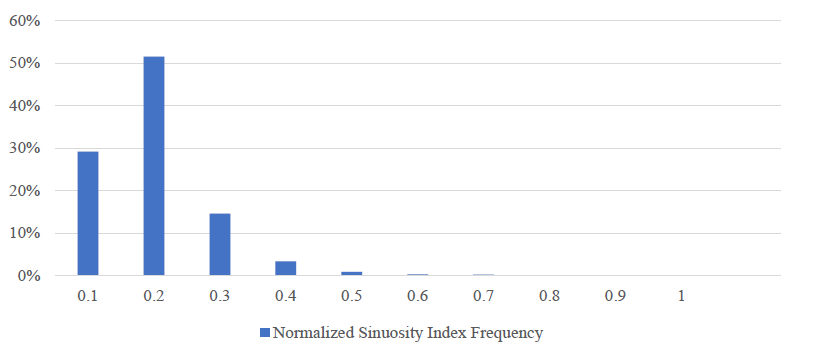
The sinuosity index distribution shows that most (80%) of the wells’ sinuosity does not exceed 20% of its observed values range, a very similar sinuosity index across the majority of the wells, which is assumed to be due to relative similarity in formation geomechanical characteristics, dip and drilling techniques. As shown in Figure 11.
Trajectories’ Influence on Production Performances
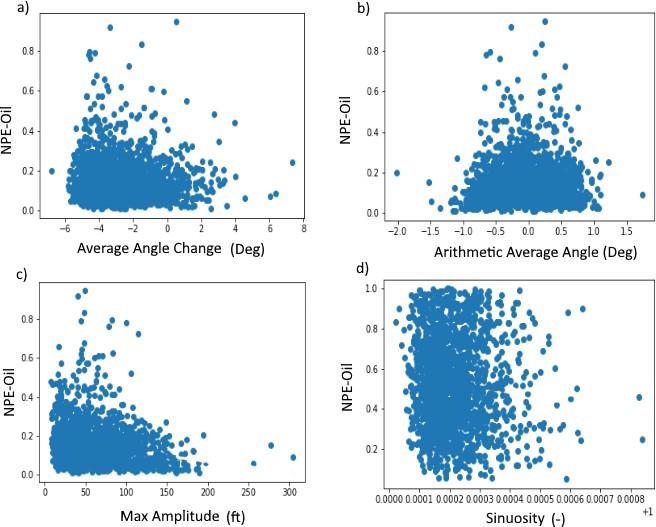
Trajectories’ influence is investigated by identifying the correlation between the Normalized Production Efficiency (NPE) parameter and the geometrical parameters as defined by Eq 1 to Eq 7, AAC, AAA, MA, SI, and the results as shown in Figure 12. It can be observed that a weak to no correlation is obtained for all the cases. Figure 12 a) shows an inverse correlation trend between NPE-Oil and AAC where lower AAC values (Toe-down) correspond to higher NPE-Oil.
Figure 12 b) shows a bell-shaped scatter plot centered at zero AAA suggesting that flat trajectories correspond to higher NPE-Oil. Figure 12 c) relates the NPE-Oil to the TVD variation amplitude which shows a similar trend as Figure 12 a), which means that lower TVD variation corresponds to higher production performance. Figure 12 d) shows that no Correlation or trend can be inferred in terms of sinuosity influence on the NPE-Oil Parameter. As previously explained the AAC is the pas a parameter that intrinsically considers the effect of length in the angle’s averages, which agrees with the maximum amplitude trend.
It is admitted that the central region of the basin is more productive due to the basin maturity and natural fractures network existence as shown by LaFollette, et al. [20] analysis. Thus, it was important to check for possible collinearity between the AAC, AAA, and NPE-Oil as shown in Figure 13, where it is assumed that the central region of the basin would contain flatter (Close to horizontal) wells’ lateral trajectories when compared to the flanks of the basin which imposes a certain trajectory depending on the targeted formation dip. To check for such spatial collinearity, a GIS Map of the calculated parameters is developed for each parameter.
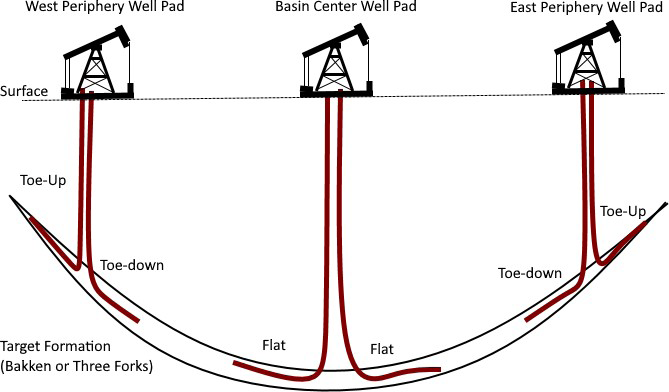
Figure 14 shows the spatial distribution of the AAC and AAA for the considered wells in the present analysis, no trend can be inferred with regards to basin core (Center) and Periphery (Flanks), hence the formation dip influenced trajectories hypothesis is disproved.

Transient Multiphase Flow Simulation Results
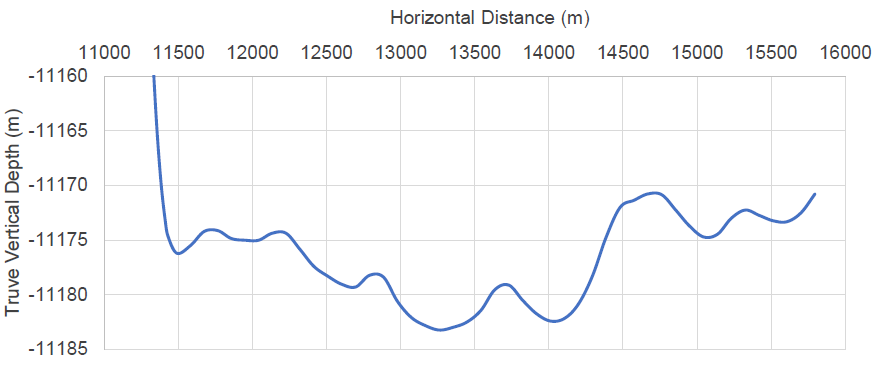
In order to show the effect of the well trajectory and undulations on the flow performances transient multiphase flow simulation models are built and simulated for two wells from the analyzed database, well THORVALD 1-6H (NDIC # 17451) from Rattlesnake point field, and well HAWKINSON 10-22H1 (NDIC # 24285) from Oakdale field, both targeting the Middle Bakken formation. The well THORVALD 1-6H is a straight toe- down well with a depth variation ~50ft as shown in Figure 15.
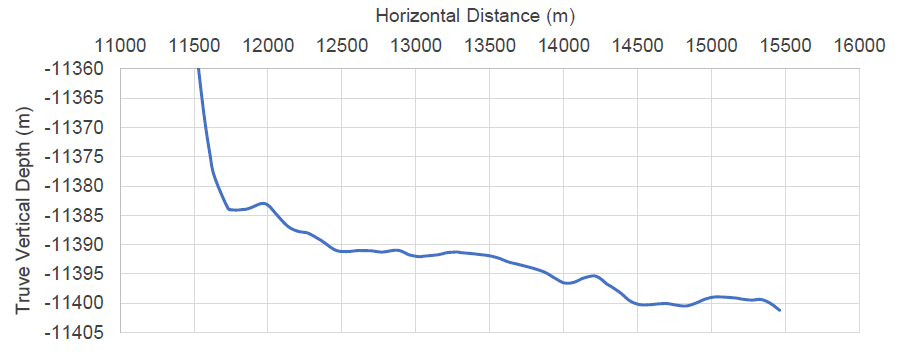
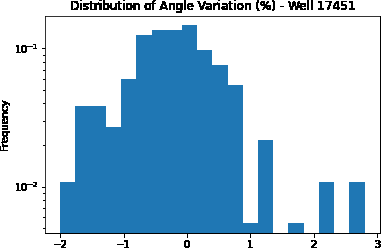
In terms of Angles variation distribution, the well do show majority of negative angles along its toe-down trajectory as shown in Figure 16, with an Average angle of -0.19, and average angle change of -0.689, a sinuosity index of 1.000089.
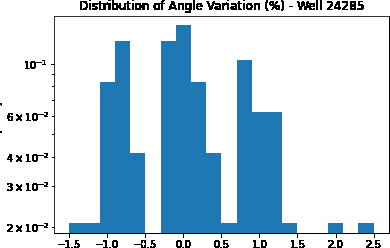
The second analyzed well show a large undulation with a toe-down section followed by a toe-up one as shown in Figure 17, a configuration particularly prone to flow instabilities.
The well trajectory does show three peaks of angles at different values, negative, null and positive, corresponding to the downward section, the straight and the upward section respectively as shown in Figure 18, the well have an average angle change of 0.0044, an average angle of 0.226, and a sinuosity index of 1.000124.
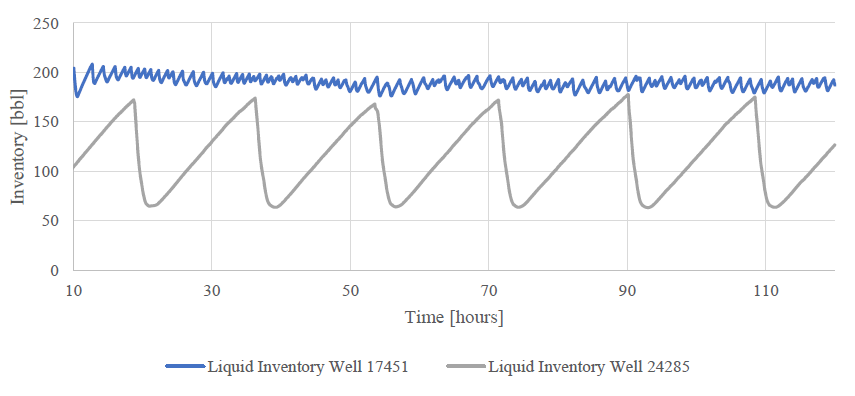
Two models built on the same fluid PVT data, and well productivity, only well trajectory differs, when comparing the two wells liquid inventory results the well 24285 is highly unstable compared to the 17451, for a simulation run of 5 days, the well generate approximately one slug per day, while the 17451 although unstable oscillations exist, but the magnitude is very small. As shown in Figure 19.
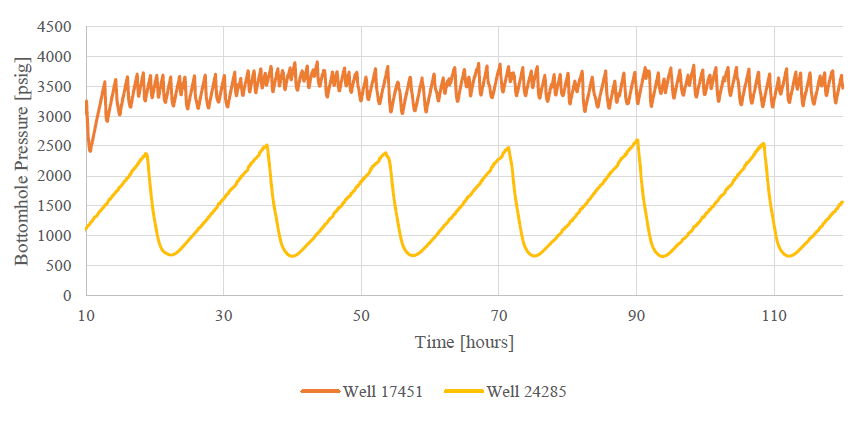
The inventory variation, creates different vertical column heads from one moment to another, inducing relatively large pressure variations in the well bottomhole pressure as shown in Figure 20.
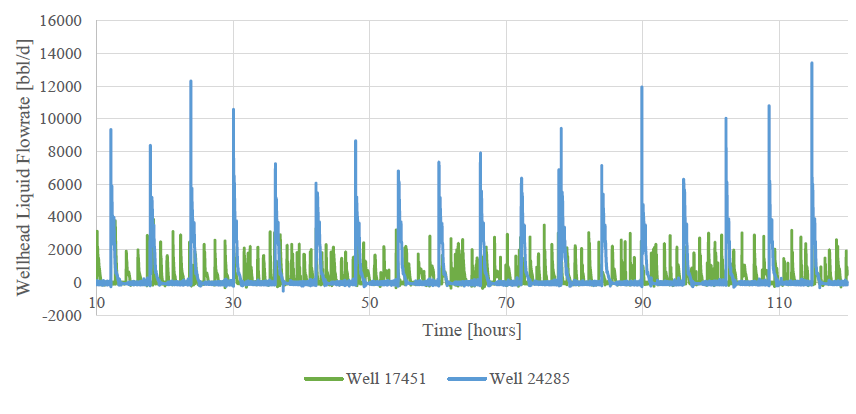
These instabilities translate also to wellhead flowrates, which intermittently produce liquids and gas as shown in Figure 21, contributing to surface equipment operational issues and control difficulties, promoting carryover and carry under for the three phase separation systems, and in case of compressions, increasing tripping risk.
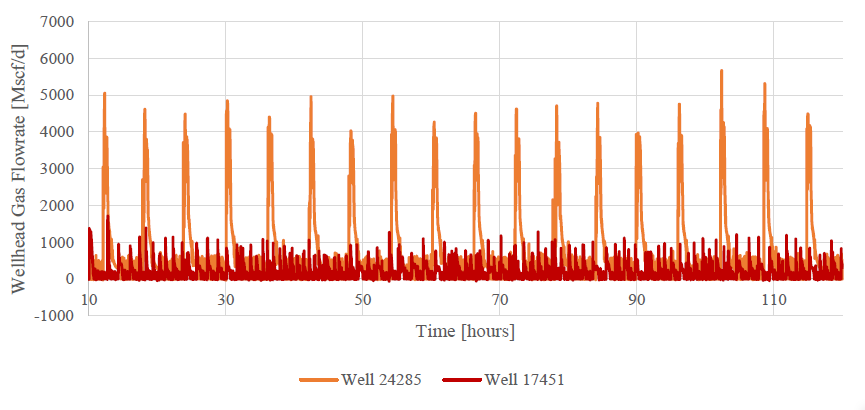
Same observation for gas flowrate which flows intermittently at wellhead with different severity (Peak flowrate and cycle duration), the well with one undulation is showing a more unstable flow (Figure 22).
Conclusion
The Average Angle Change (AAC) was successfully used to identify the lateral section orientation (Toe-up, Toe- down, hold and Toe-Up, hold and Toe-down, Horizontal). The frequency distribution may be used to characterize more complex configurations such as hold-toe-up, hold-toe- down, hold toe-down, and toe-up. Williston basin horizontal wells drilled in North Dakota are dominated by a toe-down configuration. From a flow assurance point of view, and based on the reported literature, this configuration influences production performances by reducing severe slugging, increasing the frequency, and reducing the slug lengths. However, potential sand production will block the flow close to the toe region. Furthermore, according to the literature, as observed in Eagle Ford wells and as demonstrated by the transient multiphase flow simulations results, the toe- down trajectory is less prone to flow instability (less severe slugging). At the same time, it promotes water accumulation and exhibits the highest variation in GOR between the early and late-life periods of the well.
The dominant maximum amplitude varies between 20 and 50ft of vertical depth variation between the heel and toe of the wells. In contrast, the dominant lateral section sinuosity is less than 20% of the observed range.
As a trend, higher Average Angle Change and TVD Maximum Amplitude correspond to lower Normalized Production Efficiency. With no quantifiable correlation or direct relationship to be mentioned.
In terms of arithmetic average angle, the observed trend shows a bell-shaped form with lower production efficiencies at higher deviation angles.
The sinuosity index didn’t show any interpretable results with regard to the relationship with production efficiency; thus, the effect of the undulations could not be captured.
Finally, an aerial assessment of the production efficiency distribution was made with the heat maps. Still, no pattern follows the tier 1, tier 2, and tier 3 production performances as generally observed across the Williston basin in North Dakota.
Although it is tempting to confirm that the defined production efficiency does not depend on the location of the well in the basin, is not affected by the formation dip, and is not affected by the parent-child well effect. No solid conclusion can be drawn on the existence or not of a co-correlation between these factors. More refined data and methodology are required to state the effect of these parameters on production performances.
Acknowledgment
We acknowledge the financial support of the North Dakota Industrial Commission (NDIC). We also acknowledge Enverus Company for providing access to the Drilling Info database.
References
-
Enverus (2022) Enverus Drilling Info.
-
Weijermans P, Ruszka J, Jamshidian H, Matheson M (2001) Drilling with Rotary Steerable System Reduces Wellbore Tortuosity. SPE/IADC Drilling Conference, Amsterdam, Netherlands.
-
Rungtip K (2007) Modeling performance of horizontal, undulating, and multilateral wells. Texas A&M University, USA, pp: 1-149.
-
Wilson A (2018) Proposed Steering Mechanism Reduces Tortuosity in Horizontal Wells. Journal of Petroleum Technology 70(11): 79-81.
-
Tang Y, Wolff M, Condon P, Ogden K (2007) A dynamic wellbore modeling for sinusoidal horizontal well performance with high water cut. SPE Annual Technical Conference and Exhibition, pp: 11-14.
-
Dakota Industrial Commission (2022) Directional Survey Data.
-
Norris HL (2012) The use of a transient multiphase simulator to predict and suppress flow instabilities in a horizontal shale oil well. SPE Annual Technical Conference and Exhibition, pp: 8-10.
-
Veeken K, Hu B, Schiferli W (2010) Gas-Well Liquid- Loading-Field-Data Analysis and Multiphase-Flow Modeling. SPE Production & Operations 25(3): 275-284.
-
Malekzadeh R, Mudde RF (2012) A modelling study of severe slugging in wellbore. North Africa Technical Conference and Exhibition, pp: 20-22.
-
Cheng AM (1990) Inflow Performance Relationships for Solution-Gas-Drive Slanted/Horizontal Wells. SPE Annual Technical Conference and Exhibition, pp: 23-26.
-
Brito R, Pereyra E, Sarica C (2018) Well trajectory effect on slug flow development. Journal of Petroleum Science and Engineering 167: 366-374.
-
Rivera RS, Gonten WDV, Graham J, Ali S, Degenhardt J, et al. (2016) Optimizing lateral landing depth for improved well production. SPE/AAPG/SEG Unconventional Resources Technology Conference, pp: 1-3.
-
Pankaj P, Shukla P, Yuan G, Zhang X (2018) Evaluating the Impact of Lateral Landing, Wellbore Trajectory and Hydraulic Fractures to Determine Unconventional Reservoir Productivity. SPE Europec Featured at 80th EAGE Conference and Exhibition, pp: 11-14.
-
Tebowei R, Hossain M, Islam SZ, Droubi MG, Oluyemi G (2018) Investigation of sand transport in an undulated pipe using computational fluid dynamics. Journal of Petroleum Science and Engineering 162: 747-762.
-
Tran NL, Orazov B, Karami H (2022) Impacts of Well Geometry and Gas Lift on Flow Dynamic and Production of Unconventional Horizontal Wells. SPE Artificial Lift Conference and Exhibition – Americas, USA, pp: 23-25.
-
Khetib Y, Ling K, Ifrene GEH, Allam L, Omar B, et al. (2022) Experimental and Simulation Investigation of Severe Slug Flow Attenuation Using a Dampening Pipe Volume. Journal of Petroleum Science and Engineering, pp: 1-19.
-
Khetib Y, Rasouli V, Rabiei M, Chellal HAK, Abes A, et al. (2022) Modelling Slugging Induced Flow Instabilities and Its Effect on Hydraulic Fractures Integrity in Long Horizontal Wells. 56th US Rock Mechanics/Geomechanics Symposium held in New Mexico, USA, pp: 26-29.
-
Lotfi A, Youcef K (2021) AAC_Statistical Calculator. GitHub.
-
Ove B (2013) Pipe flow 2: Multi-phase Flow Assurance.
-
LaFollette RF, Izadi G, Zhong M (2013) Application of Multivariate Analysis and Geographic Information Systems Pattern-Recognition Analysis to Production Results in the Bakken Light Tight Oil Play. SPE Hydraulic Fracturing Technology Conference, USA, pp: 4-6.
- Nigeria’s Vulnerability in the Face of Global Energy Policy
- A Simulation Study of Investigation of Optimum Oil Production Performance by Applying Various Gas Injection Methods in Oil Reservoir
- Characterization of Permo-Triassic Reservoirs through Thermal Maturity Assessment of Westphalian Source Rocks in the Cheshire Basin
- Influence of Microwax on the Rheological and Thermal Behaviour of a Wax Crude Oil
- Real-Time Monitoring and Performance Optimization of Steam Injection in Heavy Oil Reservoirs Using Fiber Optic Sensing and Integrated Predictive Simulation Models
- Rapid On-Site Determination of the Total Petroleum Hydrocarbon Content of Soils by Handheld Fourier Transform Near-Infrared Spectroscopy: Development of a Global, Site- and Scanner- Independent Calibration Model