Origin, Depositional Environment and Thermal Maturity of some Source Rocks from Niger Delta Basin, Nigeria
Eleven (11) core samples from Agbada and Akata formations in the Niger Delta, Nigeria, were analyzed using gas chromatography-mass spectrometry to evaluate their paleodepositional conditions and source input as well as to determine their thermal maturity. The distribution of n-alkanes, isoprenoids, and biomarkers indicate a mixture (marine/terrigenous) organic matter source input for Agbada and Akata formation sediments deposited in marine environment. Low values of Phytane/nC18 (0.45 to 1.32) and Pristane/nC17 (0.37 to 1.8) indicates Marine organic matter contribution and anoxic-suboxic (Type II/III kerogens) depositional conditions of extract for Agbada and Akata Formations. The Carbon Preference Index (CPI) values for all analysed samples are slightly greater than 1.0 indicate a mixed input of marine and terrigenous organic matter deposited under relatively reducing (dysoxic) conditions. The high concentration of Oleanane in studied samples reveals that source rocks are tertiary age and belong to marine deltaic depositional environment. Moderate to higher Gammacerane index values ranging from 0.06 to 0.11, suggests water-column stratification, potentially due to hypersalinity for Isan oilfield well samples from Agbada formation. Biomarker maturity parameters suggest that the sediments have reached the early stages of hydrocarbon generation.
Introduction
Petroleum geochemistry is used as the basic science to understand the properties of source rocks, productive and non-productive areas, oil migrations, oil field development and sustainable production [1]. To evaluate source rock, various laboratory advanced geochemical analyses methods, rapid and inexpensive, are used [2]. Among these techniques, we can cite Rock-Eval pyrolysis, organic petrography (kerogen type analysis, maceral analysis, vitrinite reflectance), scanning fluorescence, gas chromatography, and stable isotope analyses. Gas chromatography-mass spectrometry provides valuable data on the chemical composition of solvent-soluble organic matter in samples that can help identify sources of contamination as well as support and enhance interpretations based on organic petrology and pyrolysis techniques.
Biomarker parameters have been widely used effectively in the characterization of the environmental conditions during the deposition of organic matter, the source input and the assessment of maturation level of potential source rocks [2, 3].
Preliminary organic geochemical studies of samples from the Niger Delta conducted with gas chromatography- mass spectrometry (GC-MS) by Ekweozor CM, et al. [4] using αβ-hopanes and oleananes for fingerprinting crude oil with respect to their source, demonstrated the same result concerning the two main source rocks which were the Agbada and Akata formations as obtained by Evamy BD, et al. [5]. Bustin RM [6] found that composition of the organic matter and the relatively high pristane/phytane ratio indicate a predominantly detrital terrestrial source. However, the decrease in the pristane/phytane ratio in the younger strata is difficult to explain, but may reflect a decrease in oxidation associated with faster burial.
According to Haack RC, et al. [7], the principal sources for oil and gas in the Niger Delta are Type II, Type II/III and Type III kerogens and assumed that oil and gas in the Niger Delta originated mainly from terrigenous and nearshore marine source rock. The occurrence of oleanane in Nigerian oils points to Late Cretaceous or younger source rocks [8]. In the Niger Delta province, Tuttle, et al. [9] have highlighted one petroleum system: the tertiary petroleum system of the Niger Delta (Akata-Agbada). They claimed that the main source rock is the Upper Akata Formation, the delta marine shale facies, possibly with the contribution of interbedded marine shales of the Lower Agbada Formation. This result is not adequacy with the work of Akinlua A, et al. [10] based on geochemical analysis of rock samples from three offshore fields and oil samples from offshore and onshore fields in the western Niger Delta revealed complex mixtures of organic matter and showing early mature to mature source rocks deposited in alternating oxic and anoxic environments; the results of this study highlighted that the Niger Delta has two petroleum systems, though the terrigenous system is more predominant.
The studies of Onojake, et al. [11], Ekpo BO, et al. [12], conducted on oil samples from Niger Delta revealed mixed sources (marine and terrestrial kerogen), thermally mature and deposited under oxidizing condition. And the recent study of Faboya OL, et al. [13] concluded that the distribution of molecular biomarkers and isotopic composition in the oils indicated that they were formed from thermally mature source rocks of a mixed source but with greater input from marine organic matter deposited under suboxic conditions.
Aware of the diverse and contradictory results on Niger Delta source rocks characterization, this present study aims to improve our knowledge and provide relevant information needed to answer exploration questions related to type of source input, conditions of depositional environment and thermal maturity of some source rocks of the basin.
Geological Setting of Niger Delta Basin
The Niger Delta is one of the most prolific petroleum provinces in the world, it is located in the Southern Nigeria margin of the Gulf of Guinea., with latitude 4°49’ N and longitude 6°0’ E [14]. The Niger Delta sedimentary basin covers an area of about 256,000 km2 [15]. It is bounded to the south by the Gulf of Guinea and the north by older tectonic elements (Cretaceous) including the Anambra Basin, the Abakaliki uprising and the Afikpo syncline, and to the east and west by the Cameroon volcanic line and the Dahomey basin respectively (Figure 1b). The Niger Delta basin began to form in the Cretaceous when the African plate separated from the South American plate; the basin is delimited by rift faults on its northwest and northeast edges [16].
After the rifting, gravity tectonics became the main deformation process [9]. Pre- and syn-sedimentary tectonics described by Evamy BD, et al. [5] and Knox GJ, et al. [17] characterized the evolution of the Niger Delta basin. The regressive clastic sequence in the Niger Delta began to form in the Paleocene and has since formed sediments which now reaches a thickness of 12,000 m [5]. The Niger Delta Basin consists of three main lithostratigraphic units of Cretaceous to Holocene origin (Figure 1a). These units represent the prograding depositional environments which are distinguished mainly based on shale-sand ratios and are continental, transitional, and marine environment [18]. This Tertiary sequence in the Niger Delta consists of the three formations that are locally designated in ascending order (from the bottom) the Akata Formation, Agbada Formation, and Benin Formation [9, 19].
At the base of the system is the Akata Formation, a sequence of planktonic foraminifera-rich non-compacted transgressive Paleocene-to-Holocene marine shale, clays, and silt. This interstratified unit of sandstone and shale is called the Agbada Formation (Recent Eocene). The Agbada Formation represents the delta system (delta front, fluvio- deltaic facies) of the sedimentary sequence [9]. The Agbada Formation is overlain by the third formation, the Benin Formation, a last continental deposit from the Eocene to Recent alluvial and upper coastal plains [20].
![Figure 1: (a) Stratigraphic column showing the three formations of the Niger Delta [18]. (b) Niger Delta Map showing Province outline (petroleum system) and bounding structural features [9].](/fulltextimages/9647/fig_1.png)
Materials and Methods
After Rock-Eval analysis, Biomarker analysis was performed on Eleven (11) core samples with good Total Organic Carbon (TOC more than 1 wt.%) and good petroleum potential using gas chromatography-mass spectrometry (GC- MS). Three (3) samples from Agbada formation wells and Eight (8) samples from Akata formation wells. The fractions of bitumen obtained after Soxhlet extraction were dissolved in n-_hexane and analyzed using gas chromatography-mass spectrometry (GC-MS). The GC-MS analysis was performed using Perkin Elmer GC/MS Clarus 500. Chromatograms were acquired in scanning: 35–700 molecular weight and selected-ion-monitored (SIM) for compound identification and integration. The distribution of organic compounds in the bitumen extracts is monitored by fragmentograms of _n-alkane (m/z 85), terpanes and hopanes (m/z 191) and steranes (m/z 217). The relative concentrations of particular compounds were calculated from peak areas.
Biomarkers were identified by comparison with previously published accounts [3, 21, 22]. These analyses were done in the laboratory of PETROCI (Société National d’Opération Pétrolière de la Cote d’Ivoire).
Result and Discussion
Biomarker distributions
Normal alkanes and isoprenoids distribution The n-alkane hydrocarbons were distributed differently in samples obtained from different wells (m/z 85). The distributions were unimodal in these samples, and the dominant peaks of the samples from Agbada and Akata formations are distributed mainly between n_C16 and _n_C23, and the carbon number is distributed mostly between _n_C13 and _n_C37 (Figure 2). The _n-_alkane distribution in the Agbada and Akata core samples is dominated by short- chain n-alkanes suggesting sources of marine algae. Odd to Even predominance (OEP) has been observed in many recent sedimentary systems and is linked to contributions from algae, bacteria, fungi, and yeast [23]. The presence of terrestrial plant-derived organic matter is typically verified based on the presence of predominantly odd molecular weight _n-alkanes, between C25 and C35, which are linked with inputs of wax lipids derived from higher plants [23]. Isoprenoids (Pristane and Phytane) are present in significant amounts in the analyzed samples (Figure 2).
Triterpanes and Steranes Distribution
Triterpane and sterane distributions of the analyzed samples were determined based on m/z 191 (Figure 3) and m/z 217 (Figure 4) traces respectively. Peak identifications of the m/z 191 and m/z 217 fragmentograms were made on the basis of retention times and published literatures Peters KE, et al. [3], Hakimi MH, et al. [24], Weiss HM, et al. [25], Waples DW, et al. [26]. The identified peaks are listed in Table 1 and Table 2, and the calculated ratios are shown in Table 3 and Table 4. The m/z 191 mass chromatograms of the saturated hydrocarbon fractions of all the analyzed samples show moderate abundances of tricyclic terpanes with lower amounts of tetracyclic terpanes.
Tricyclic and tetracyclic terpanes are usually common in a marine environment and are believed to have their origin in algae, especially Tasmanites and bacteria [27, 28, 29]. Tricyclic terpanes (TT) C20TT (t20) to C29TT (t29) were identified in the shale samples of Agbada and Akata formations. The most prominent peak in the tricyclic terpanes series was that of C23TT (t23), as shown in Figure 3, which is a clear indication of a marine input [29, 30]. Hopanoids are important biomarkers for indicating organic matter that was derived from bacteria [31]. Their composition and distribution are similar in most of the samples and mainly consist of C28 to C35 17α,21β(H)-hopanes with C29αβ and C30αβ hopanes as major compounds (Figure 3). The predominance of C30 hopane is often associated with clay-rich source rocks [23, 32]. Moreover, pentacyclic terpanes from C27 to C35 were present. Of these, C30 (hopane) had the highest relative abundance samples of Agbada formation and moderate in Akata formations, whereas the abundance of C28 was unusually low. Trisnorhopane (C27) and homohopanes (C31+) appeared as doublets (18α(H)-trisnorneohopane (Ts) and 17α(H)-trisnorhopane (Tm) isomers); 22S and 22R epimers, respectively) in the Ion chromatograms for all of the studied shale samples (Figure 3).
The 17β,21α(H)-moretane was also detected in almost all the samples (Figure 3), though in moderate concentrations in the Akata samples. Moretanes are more abundant in organic material of terrestrial origin, but it is not known if they come from terrestrial plants or from microorganisms associated with those particular depositional environments [26].
The 18α(H)-oleanane, which is an important land plant- derived biomarker, was identified in high proportion in all the analyzed samples particularly in high concentrations in the rock extracts from Akata formation (Figure 3), supporting the presence of terrigenous organic matter input in the sediments [3, 23]. Gammacerane is present in the sample from oilfield Isan (Figure 3), indicating a stratified water column in lacustrine depositional environments of source rock which resulted from hypersalinity [33]. The investigated rock extracts for Agbada formation wells are characterized by relatively moderate concentrations of 5α(H),14β(H),17β(H)-Cholestane or C27-cholestane (30%) and low to slightly moderate abundance of 24-methyl- 5α(H),14α(H),17α(H)-cholestane or C28-ergostane (12– 18%) and 24-ethyl-5α(H),14β(H),17β(H)-cholestane or C29- stigmastane (50–58%) respectively (Figure 4 and Table 2), that indicate a marine and mixed marine/terrigenous origin [3]. Diasteranes is referred to as rearranged steranes and are present in significant amounts in all samples analyzed (Figure 4 and Table 2).
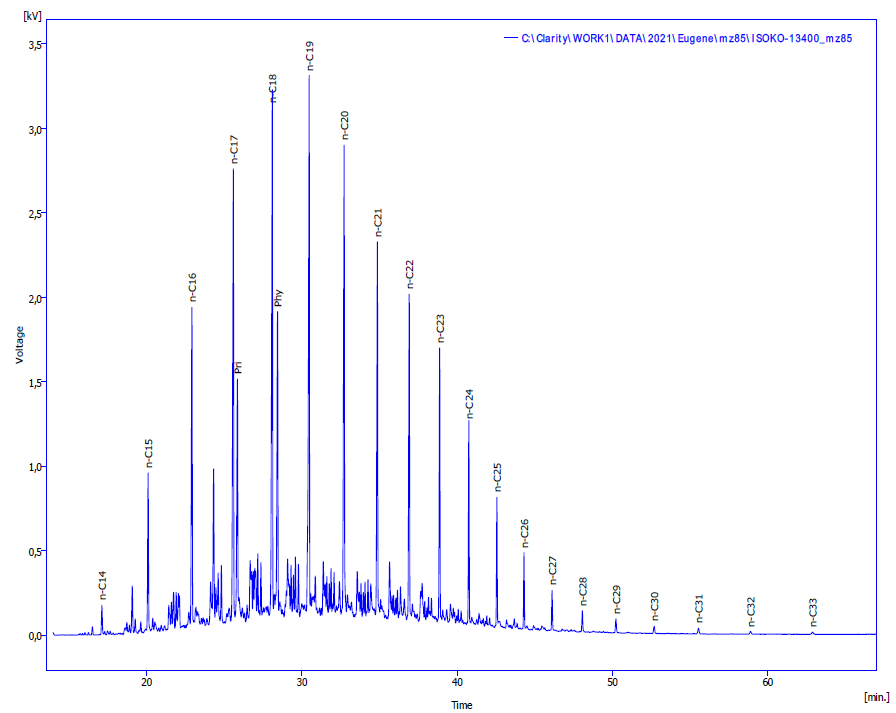
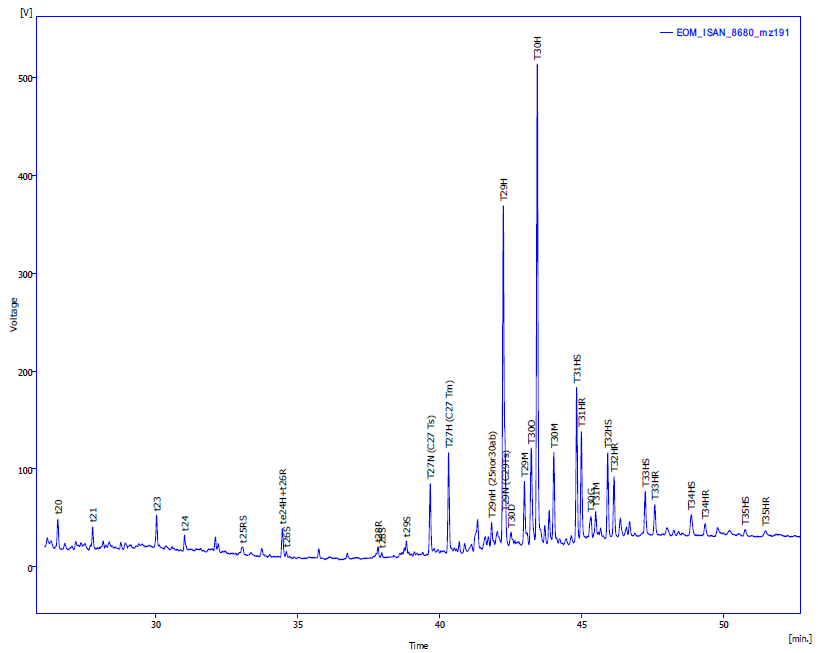
Figure 3: The m/z 191 mass fragmentogram of a saturated hydrocarbon fraction of rock extracts from Agbada formation samples.
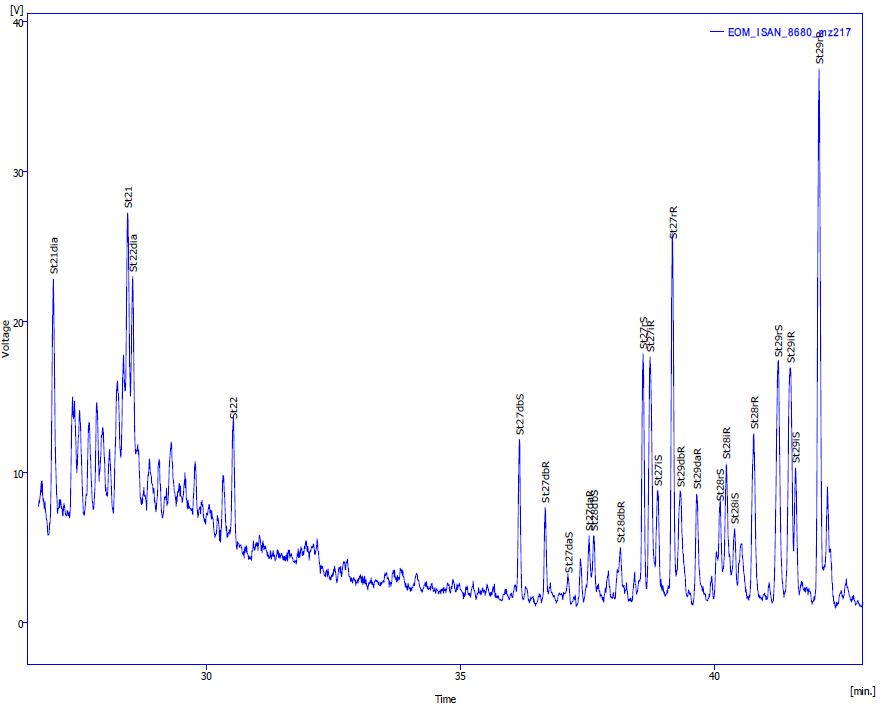
Figure 4: The m/z 217 mass fragmentogram of a saturated hydrocarbon fraction of rock extracts from Agbada formation samples.
| Peak | Compound |
| t20 | C20 Tricyclic terpane (Cheilanthane) |
| t21 | C21 Tricyclic terpane |
| t23 | C23 Tricyclic terpane |
| t24 | C24 Tricyclic terpane |
| T25RS | C25 Tricyclic terpane 22S + 22R |
| te24H | C24 Tetracyclic terpane |
| t26S | C26 Tricyclic terpane 22S |
| t26R | C26 Tricyclic terpane 22R |
| T26RS | C26 Tricyclic 22S + 22R |
| t28R | C28 Tricyclic terpane 22R |
| t28S | C28 Tricyclic terpane 22S |
| t29R | C29 Tricyclic terpane 22R |
| T29S | C29 Tricyclic terpane 22S |
| T27N(C27 Ts) | 18α(H), 22,29,30-trisnorneohopane(Ts) |
| T27H(C27 Tm) | 18α(H), 22,29,30-trisnorneohopane(Tm) |
| T28nH(C28ab) | 17α(H), 21β(H)-28,30-bisnorneohopane |
| T29nH(25nor30ab) | 17α(H), 21β(H)-25-norhopane |
| t30R | C30 Tricyclic terpane 22R |
| t30S | C30 Tricyclic terpane 22S |
| T29H | 17α,21β(H)-30-norhopane |
| T29N(C29Ts) | 18α(H)-30-norneohopane |
| T30D | 17α(H)-diahopane |
| T29M | 17β,21α(H)-moretane |
| T30O | 17α(H)-oleanane |
| T30H | 17α,21β(H)-Hopane |
| T30M | 17β,21α(H)-moretane |
| T31HS | 17α,21β(H)-homohopane 22S |
| T31HR | 17α,21β(H)-homohopane 22R |
| T30G | Gammacerane |
| T31M | 17β(H), 21α(H)-homohopane(moretane) |
| T32HS | 17α,21β(H)-bishomohopane 22S |
| T32HR | 17α,21β(H)-bishomohopane 22R |
| T33HS | 17α,21β(H)-trishomohopane 22S |
| T33HR | 17α,21β(H)-trishomohopane 22R |
| T34HS | 17α,21β(H)-tetrakishomohopane 22S |
| T34HR | 17α,21β(H)-tetrakishomohopane 22R |
| T35HS | 17α,21β(H)-pentakishomohopane 22S |
| T35HR | 17α,21β(H)-pentakishomohopane 22R |
Table 1: Identification of peaks in triterpanes (m/z 191) mass spectrograms.
| Peak | Compound |
| t20 | C20 Tricyclic terpane(Cheilanthane) |
| t21 | C21 Tricyclic terpane |
| t23 | C23 Tricyclic terpane |
| t24 | C24 Tricyclic terpane |
| T25RS | C25 Tricyclic terpane 22S+22R |
| te24H | C24 Tetracyclic terpane |
| t26S | C26 Tricyclic terpane 22S |
| t26R | C26 Tricyclic terpane 22R |
| T26RS | C26 Tricyclic 22S+22R |
| t28R | C28 Tricyclic terpane 22R |
| t28S | C28 Tricyclic terpane 22S |
| t29R | C29 Tricyclic terpane 22R |
| T29S | C29 Tricyclic terpane 22S |
| T27N(C27 Ts) | 18α(H),22,29,30-trisnorneohopane(Ts) |
| T27H(C27 Tm) | 18α(H),22,29,30-trisnorneohopane(Tm) |
| T28nH(C28ab) | 17α(H),21β(H)-28,30-bisnorneohopane |
| T29nH(25nor30ab) | 17α(H),21β(H)-25-norhopane |
| t30R | C30 Tricyclic terpane 22R |
| t30S | C30 Tricyclic terpane 22S |
| T29H | 17α,21β(H)-30-norhopane |
| T29N(C29Ts) | 18α(H)-30-norneohopane |
| T30D | 17α(H)-diahopane |
| T29M | 17β,21α(H)-moretane |
| T30O | 17α(H)-oleanane |
| T30H | 17α,21β(H)-Hopane |
| T30M | 17β,21α(H)-moretane |
| T31HS | 17α,21β(H)-homohopane 22S |
| T31HR | 17α,21β(H)-homohopane 22R |
| T30G | Gammacerane |
| T31M | 17β(H),21α(H)-homohopane(moretane) |
| T32HS | 17α,21β(H)-bishomohopane 22S |
| T32HR | 17α,21β(H)-bishomohopane 22R |
| T33HS | 17α,21β(H)-trishomohopane 22S |
| T33HR | 17α,21β(H)-trishomohopane 22R |
| T34HS | 17α,21β(H)-tetrakishomohopane 22S |
| T34HR | 17α,21β(H)-tetrakishomohopane 22R |
| T35HS | 17α,21β(H)-pentakishomohopane 22S |
Table 2: Identification of peaks in steranes (m/z 217) mass spectrograms.
Source Input and Depositional Environment
The biomarker distributions measured from GC-MS are used to interpret the organic matter source and depositional environment in this study. The ions m/z 85, m/z 191 and m/z 217 mass chromatograms are monitored in order to determine the peak area of n-alkanes, terpanes and steranes, respectively, which can be calculated as parametric ratios, is shown in Table 3 and Table 4.
Pr/Ph values range from 0.9 to 1.02 for Agbada formation and 0.73 to 1.23 for Akata formation (Table 3). These Pr/Ph values suggest alternating anoxic and dysoxic conditions during deposition of the sediments in these formations. A cross-plot of Pr/_n_C17 and Ph/_n_C18 values (Figure 5) suggests predominant mixed organic facies with some samples having strong contributions of terrestrial marine organic matter. Marine organic matter contribution and anoxic-suboxic (Type II/III kerogen) depositional conditions of extract for Agbada and Akata Formations are indicated by low Phytane/ _n_C18 (0.45 to 1.32) and Pristane/_n_C17 (0.37 to 1.8).
Carbon preference index (CPI) of n-alkanes between _n_C22 and _n_C30 was also calculated to provide some insights into the source input and depositional conditions of the organic matter. CPI value that is less than 1.0 would indicate reducing depositional conditions [34]. The CPI values for all the analysed samples are slightly greater than 1.0 (Table 3). This indicates a mixed input of marine and terrigenous organic matter deposited under relatively reducing (dysoxic) conditions. The cross-plot of CPI against Pr/Ph (Figure 6) further supports this interpretation [34, 35, 36].
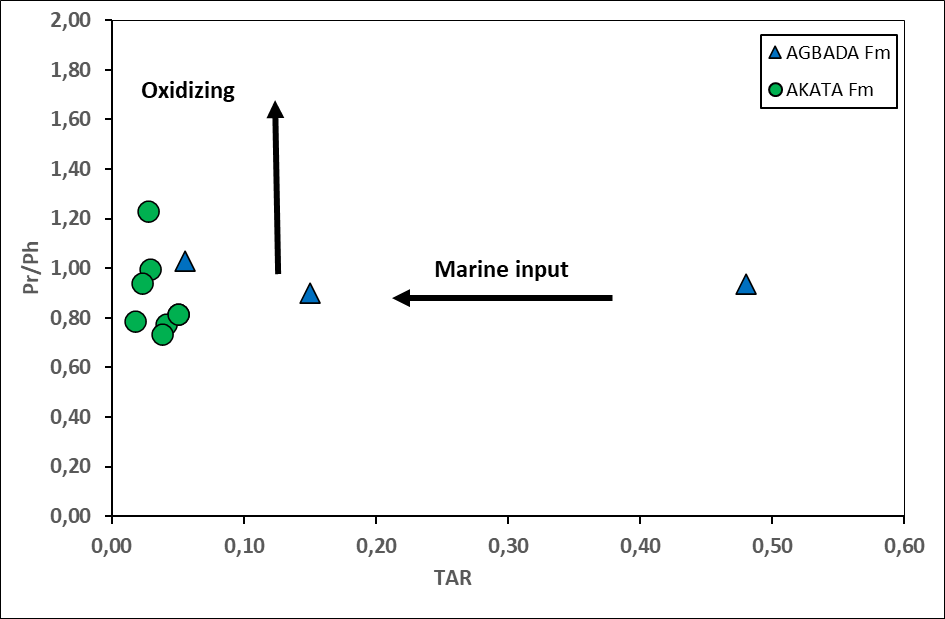
Waxiness index may be used to determine the amount of land-derived organic materials in the sediments [23]. The degree of Waxiness is expressed by the ΣC21-C31/ΣC15-C20 ratios. Samples from Agbada and Akata formations generally contain low to moderate waxy ratios (0.13 - 1.07), reflecting mixed marine and land plant-derived biomarkers. The cross- plot of waxiness and Pr/Ph ratio further corroborates this interpretation (Figure 7). The terrigenous/aquatic ratio (TAR) is also used as a valuable parameter of relative terrigenous versus aquatic organic matter input. TAR gives an additional way to assess the relative contributions of terrigenous (e.g., terrestrial plant) and aquatic (e.g., aquatic algae) organic matter, by comparing the abundances of short and long-chain n-alkanes. TAR values in Agbada and Akata core samples range between 0.02 to 0.48 (Table 3). These low values indicate a dominantly aquatic organic matter source (Figure 8), with more algal organic matter input as compared to vascular plants [37].
Marine and lacustrine crude oils are best discriminated using C31R/C30 hopane in combination with C26/C25 tricyclic terpanes parameters [23, 38]. Akata formation samples display C26/C25 tricyclic ratios around 1.0 and C31R/C30 hopane ratios range between 0.23 to 0.35, indicating marine environment. However, Agbada formation studied samples show C26/C25 tricyclic ratios that are greater than 1.0, with C31R/C30 hopane ratios ranging from 0.23 to 0.59, indicating their mixed origin (Figure 9).
| Formation | Wells | Depth (ft) | Pr/Ph | Pr/nC17 | Ph/nC18 | TAR | Waxiness | CPI |
|---|---|---|---|---|---|---|---|---|
| Agbada Akata | Isan 9 Benin West Isan 9 Ubefan Ughelli Appara Kokori Eriemu Warri River Udeduma Cr. Isoko | 6760 7840 8680 9800 11120 11800 12140 12200 12260 12340 13400 | 0,9 1,03 0,94 1 1,23 0,79 0,82 0,78 0,73 0,94 0,82 | 1,8 0,61 0,62 0,47 0,67 0,37 0,56 0,57 0,55 0,49 0,56 | 1,33 0,68 0,68 0,48 0,77 0,45 0,6 0,62 0,63 0,49 0,6 | 0,15 0,06 0,48 0,03 0,03 0,02 0,05 0,04 0,04 0,02 0,05 | 0,68 0,30 1,07 0,32 0,13 0,33 0,54 0,43 0,54 0,25 0,54 | 1,48 1,04 1,23 1,19 1,19 1,15 1,16 1,11 1,14 1,23 1,16 |
Table 3: Triterpane (m/z 191) and Sterane (m/z 217) biomarker parameters calculated from mass chromatograms of the analyzed sampl
![Figure 5: Plot of pristane/n-C17 versus phytane/n-C18 for the investigated samples (After [23]).](/fulltextimages/9647/fig_5.jpeg)
| Formations | Wells | Depth (ft) | Ts/ (Ts+Tm) | Ol/ C30H | C31 22S/22R+22S | Ga/ C30H | C31R/ C30H | C26/C25 Tricyclic | C29 20S/ (20S+20R) | C29 ββ/ (ββ+αα) |
|---|---|---|---|---|---|---|---|---|---|---|
| Agbada | Isan 9 | 6760 | 0,36 | 0,36 | 0,45 | 0,11 | 0,35 | 2,65 | 0,11 | 0,66 |
| Benin West | 7840 | 0,74 | 0,32 | 0,54 | 0 | 0,33 | 2,6 | nd | nd | |
| Isan 9 | 8680 | 0,42 | 0,27 | 0,57 | 0,07 | 0,23 | 1,53 | 0,3 | 0,62 | |
| Akata | Ubefan | 9800 | 0,32 | 0,84 | 0,57 | 0 | 0,39 | 1,09 | nd | nd |
| Ughelli | 11120 | nd | nd | nd | Nd | nd | Nd | nd | nd | |
| Appara | 11800 | 0,33 | 0,73 | 0,5 | 0 | 0,33 | 1,36 | nd | nd | |
| Kokori | 12140 | 0,46 | 1,03 | 0,51 | 0 | 0,28 | 1,29 | nd | nd | |
| Eriemu | 12200 | 0,24 | 0,71 | 0,55 | 0 | 0,3 | 0,9 | nd | nd | |
| Warri River | 12260 | 0,38 | 0,31 | 0,59 | 0 | 0,37 | 1 | nd | nd | |
| Udeduma Cr. | 12340 | 0 | 1,19 | 0,55 | 0 | 0,23 | 1,15 | nd | nd | |
| Isoko | 13400 | 0,47 | 0,32 | 0,43 | 0 | 0,56 | 0,8 | nd | nd |
Table 4: Triterpane (m/z 191) and Sterane (m/z 217) biomarker parameters calculated from mass chromatograms of the analyzed sampl
Table 4: Triterpane (m/z 191) and Sterane (m/z 217) biomarker parameters calculated from mass chromatograms of the analyzed samples. Ts/(Ts+Tm)=18α-22,29,30-trisnorneohopane/(18α-22,29,30-trisnorneohopane+17α-22,29,30-trisnorhopane); Ga/C30H = gammacerane/ C30 17α(H),21β(H)-hopane ; Ol/C30H =18α(H)-oleanane/C30 17α(H),21β(H)-hopane ; BNH/C30H = 17α(H), 21β(H)- 28,30-bisnorhopane/C30 17α(H),21β(H)-hopane ; C31 22S/(22S+22R) = C3117α(H),21β(H) 22S/[C3117α(H),21β(H) 22(R + S)] ; C29H/C30H = C2917α(H),21β(H)-hopane/C3017α(H),21β(H)-hopane ; C26/C25 tricyclic= C26 tricyclic terpane/C25 tricyclic terpane; ββ/(ββ + αα) = [5α(H),14β(H),17β(H)(20R + 20S)C29sterane]/[5α(H),14β(H),17β(H)(20R + 20S) + 5α(H),14α(H),17α(H)(20R + 20S)]C29 steranes ; 20S/(20S + 20R) : C29 5α(H),14α(H),17α(H),20S/[C29 5α(H),14α(H),17α(H),20(S + R)].
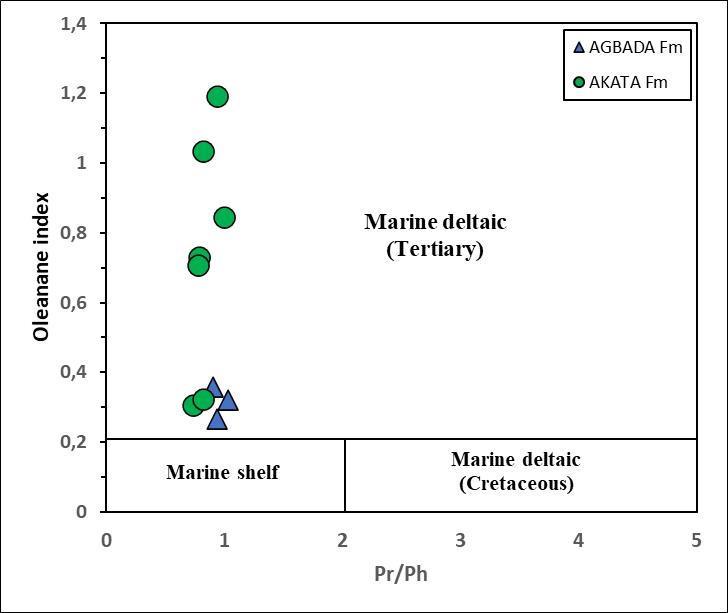
Oleanane is present in all the samples studied. It is believed to be derived from pentacyclic triterpenes in some angiosperms [39]. The results in Table 4 show that all studied samples display Oleanane Index (Ol/C30H) values more than 0.2, which indicates that these samples were generated from the Tertiary source rocks, with the presence of terrigenous organic matter input in the sediments [3, 23]. Figure 10 indicates that the studied source rocks belong to marine deltaic depositional environment for the Tertiary source rock [39]. Samples Isan 9 (6760 ft) and Isan 9 (8680 ft) have moderate to higher Gammacerane index (Ga/C30H) values ranging from 0.06 to 0.11 (Table 4), that suggest water- column stratification, potentially due to hypersalinity [33].
![Figure 6: Plot of Pristane/phytane versus CPI, indicating the depositional environment conditions of the studied samples [35].](/fulltextimages/9647/fig_6.png)
![Figure 7: Cross-plot of waxiness index versus pristane/phytane ratios, indicating the depositional environment conditions of the studied samples (Modified after [40]).](/fulltextimages/9647/fig_7.png)
![Figure 9: Plot of C26/C25 tricyclic terpane versus C31 22R/C30 hopane cross-plot for Agbada and Akata formation samples, showing depositional environments (modified after [23]).](/fulltextimages/9647/fig_9.png)
Thermal Maturity Assessment
To understand the change of organic matters in rocks during diagenetic process the study of thermal maturity is used [41]. Biomarkers maturity parameters such as CPI, Ts/ (Ts + Tm), C31 22S/(22S + 22R) Hopane, 20S/(20S + 20R) and ββ/(ββ + αα) C29 sterane ratios were used as maturity indicators.
The Agbada formation samples have Carbon preference index (CPI) values that range from 1.04 to 1.48 (Table 3), which suggests moderate thermal maturity to immature source rocks. The extracts of Akata shale were all between 1.11 and 1.23 (Table 3), indicating immature to early mature source rocks. None of the samples were above 1.5.
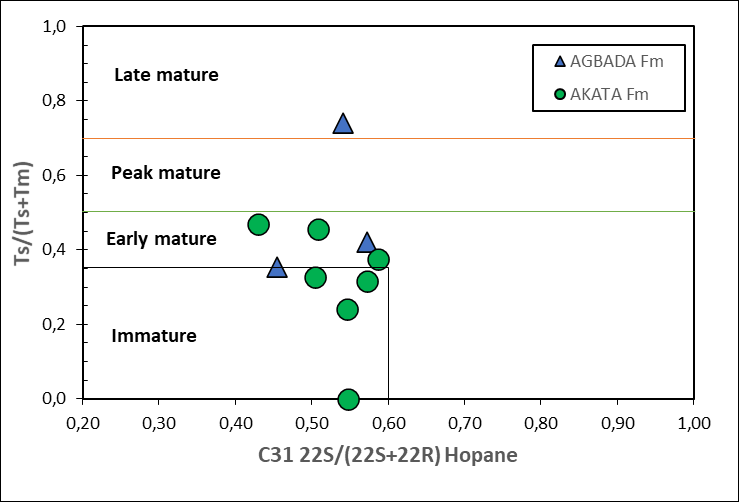
C31 homohopane 22S/(22S+22R) isomerization ratio determines the configuration of homohopane molecules between biological form (22R) and geological form (22S). Ratio ranges from 0 to 0.6 indicating equilibrium during maturation. Early stage of oil generation values between 0.50 and 0.54. The Homohopane isomerization ratio can be calculated from any or all of C31–C35 homohopanes. In this study, C31 homohopane is used as biomarker maturity indicator showing 22S/(22S+22R) ratio ranging from 0.45 to 0.57 for Agbada formation samples and ranging from 0.43 to 0.59 for Agbada formation samples (Table 4). The ratios suggest that organic matters have been reached at immature stage to early oil window (Figure 11).
The ratio of Ts (C27 18α(H),22,29,30-trisnorneohopane) and Tm (C27 17α(H),22,29,30-trisnorhopane), so called Ts/ (Ts+Tm), is used to determine thermal maturity stage. Tm is less stable and converts to Ts during catagenesis. Therefore, the high value of this ratio represents low amounts of Tm with higher thermal maturity of organic matter [42]. The studied samples are mainly from siliciclastic rocks derived from terrestrial source. Thus, the variation of Ts/Tm ratios appears to be more strongly influenced by maturity instead of source inputs. Ts/(Ts+Tm) ratios from Agbada formation samples range from 0.36 to 0.74 suggesting early mature to late mature organic matter. Ts/(Ts+Tm) ratios from Akata formation samples range from 0 to 0.47 as presented in Table 4 indicating that the organic matter is in immature to early mature stage. The result of Ts/(Ts+Tm) ratios consistent with hopane isomerization ratio (Figure 11). The Plot of Pristane/_n_C17 versus Phytane/_n_C18 shows also immature to early mature organic matter for all investigated samples (Figure 5). Other maturity parameters calculated from the m/z 217 ion mass fragmentograms are the C29-5α,14α,17α(H)-20S/(20S + 20R) and the ββ/(ββ + αα) for C29 steranes. These ratios increase with increasing thermal maturity [23]. Although it has been stated that the 20S/ (20S + 20R) ratio equilibrates at 0.52 to 0.55 [43]. The values of 20S/(20S + 20R) and ββ/ (ββ + αα) for the Agbada formation samples range from 0.11 to 0.3 and 0.62 to 0.66, respectively. These values suggest that the analyzed samples are early mature to thermally mature for hydrocarbon generation (Table 4).
Conclusion
The molecular geochemical analyses of selected samples from Agbada and Akata formations from Niger Delta (Nigeria) revealed that source rocks are type III (Terrestrial) and mixed origin (II/III - marine and terrigenous), deposited under anoxic to dysoxic conditions. The distribution of biomarkers and metrics such as Pr/Ph, CPI, Waxiness, and TAR suggests a mixed intake of marine and terrigenous organic matter deposited under reducing (dysoxic) conditions. Low Phytane/ _n_C18 (0.45 to 1.32) and Pristane/_n_C17 (0.37 to 1.8) values in Agbada and Akata formation rock extracts suggest marine organic matter contribution and anoxic-suboxic (Type II/ III kerogens) depositional settings. The Oleanane Index (Ol/ C30H) values in all of the samples studied are more than 0.2, suggesting that they were produced from Tertiary source rocks containing terrigenous organic matter in the sediments. In a marine deltaic depositional context, the Tertiary source rocks developed. The presence of Gammacerane in samples from the Isan oilfield’s Agbada deposit indicated water- column stratification, perhaps owing to hypersalinity. The Agbada formations were the only formations that showed lacustrine characteristics. It could suggest a link with the Neocomian source rock of the Lower Cretaceous which is lacustrine and most of the tar sands of the western Niger Delta show lacustrine features. Biomarkers maturity metrics such as CPI, Ts/(Ts+Tm), 22S/(22S+22R) C31 Hopane, 20S/ (20S+20R), and ββ/(ββ+αα) C29 sterane ratios were used as maturity indicators. These maturity indicators indicate that hydrocarbon production in the sediments is still in its early phases.
Nomenclatures/Abbreviations
| C | Carbon |
|---|---|
| C 29 | Total number of carbon present in a biomarker |
| CPI | Carbon Preference Index |
| DCAR | CENTRE OF ANALYSIS AND RESEARCH DIRECTION |
| Ga | Gammacerane |
| GC-MS | Gas chromatography-mass spectrometry |
| H | Hopane |
| m/z | Mass to charge ratio |
| OEP | Odd to Even Predominance |
| Ol | Oleanane |
| PETROCI | NATIONAL SOCIETY OF PETROLEUM OPERATIONS OF COTE D’IVOIRE |
| Ph | Phytane |
| Pr | Pristane |
| R | Asymmetric carbon in ring that obeys clockwise conventions |
| S | Asymmetric carbon in ring that obeys anticlockwise convention |
| SIM | Selected ion monitored |
| t | Terpane |
| TAR | Terrigenous to aquatic ratio |
| TT | Tricyclic terpanes |
| á | Asymmetric carbon in ring with functional group (usually H) down |
| â | Asymmetric carbon in ring with functional group (usually H) up |
References
-
El Nady MM, Ramadan FS, Hammad MM, Lofty NM (2015) Evaluation of organic matters, hydrocarbon potential and thermal maturity of source rocks based on geochemical and statistical methods: Case study of source rocks in Ras Gharib oilfield, central Gulf of Suez, Egypt. Egyptian Journal of Petroleum 24(2): 203-211.
-
Peters KE, Walters CC, Moldowan JM (2005a) The Biomarker Guide. Volume 1: Biomarkers and Isotopes in the Environment and Human History. 1st (Edn.), Cambridge University Press, New York.
-
Peters KE, Walters CC, Moldowan JM (2005a) The Biomarker Guide. Vol 1, 1st(Edn.) Cambridge University Press, New York.
-
Ekweozor CM, Okogun JI, Ekong DEU, Maxwel JR (1979) Preliminary organic geochemical studies of samples from the Niger Delta (Nigeria: Part 1, analysis of crude oils for triterpanes. Chemical Geology 27(1-2): 11-28.
-
Evamy BD, Haremboure J, Kamerling P, Knaap WA, Molloy FA, et al. (1978) Hydrocarbon habitat of Tertiary Niger Delta. American Association of Petroleum Geologists Bulletin 62(1): 1-39.
-
Bustin RM (1988) Sedimentology and characteristics of dispersed organic matter in Tertiary Niger Delta: origin of source rocks in a deltaic environment. American Association of Petroleum Geologists Bulletin 72: 277- 298.
-
Haack RC, Sundararaman P, Diedjomahor JO, Xiao H, Gant NJ, et al. (2000) Niger Delta petroleum systems, Nigeria. In: Mello MR (Ed.), Petroleum systems of South Atlantic margins. Am Assoc Petrol Geol Memoir 73: 213-231.
-
Ekweozor CM, Daukoru EM (1994) Northern delta depobelt portion of the Akata-Agbada(!) petroleum system, Niger delta, Nigeria. In: Magoon LB (Eds.), The petroleum system-from source to trap. Am Assoc Petrol Geol Memoir 60: 599-614.
-
Tuttle MLW, Charpentier RR, Brownfield ME (1999) Tertiary Niger Delta (Akata-Agbada) Petroleum System (No. 719201), Niger Delta Province, Nigeria, Cameroon, and Equatorial Guinea, Africa. U.S Geological Survey.
-
Akinlua A, Torto N (2011) Geochemical evaluation of Niger Delta sedimentary organic rocks: a new insight. Int J Earth Sci (Geol Rundsch) 100: 1401-1411.
-
Onojake MC, Osuji LC, Abrakasa S (2015) Source, depositional environment and maturity levels of some crude oils in southwest Niger Delta, Nigeria. Acta Geochimica 34(2): 224-232.
-
Ekpo BO, Essien N, Neji PA, Etsenake RO (2017) Geochemical fingerprinting of western offshore Niger Delta oils. Journal of Petroleum Science and Engineering 160: 452-464.
-
Faboya OL, Sonibare OO, Liao Z (2019) Biomarkers and isotopic characteristics of crude oils from a central Niger delta depobelt field, Nigeria. Petroleum Science and Technology 37(3): 346-353.
-
Doust H, Omatsola E (1990) Niger delta. In: Edwards JD (Eds.), Divergent/Passive Margin Basins. American Association of Petroleum Geologists Bulletin 45: 201- 238.
-
Adegoke OS, Oyebamiji AS, Edet JJ, Osterloff PL, Ulu OK, et al. (2017) Cenozoic Foraminifera and Calcareous Nannofossil Biostratigraphy of the Niger Delta.
-
Whiteman AJ (1982) Nigeria: Its petroleum geology, resources and potentials. Graham and Trotman, London, U.K. pp: 166.
-
Knox GJ, Omatsola EM (1989) Development of the Cenozoic Niger Delta in terms of the ‘Escalator Regression’ model and impact on hydrocarbon distribution. In: van der Linden WJM, et al. (Eds.), Coastal Lowlands. Springer, Dordrecht, pp: 181-202.
-
Corredor A, Lessenger MA, Capentino P (2005) Comparative source rock evaluation of opuama channel complex and adjacent producing areas of Niger Delta. American Association of Petroleum Geologists 2(6): 10- 27.
-
Short KC, Stauble AJ (1967) Outline of geology of Niger Delta. American Association of Petroleum Geologists Bulletin 51(5): 761-779.
-
Avbovbo AA (1978) Tertiary Litho-stratigraphy of Niger Delta. American Association of Petroleum Geologists Bulletin 62(2): 295-300.
-
Jones PJ, Philp RP (1990) Oils and source rocks from Pauls Valley, Anadarko Basin, Oklahoma, U.S.A. Applied Geochemistry 5(4): 429-448.
-
Philp RP (1985) Fossil Fuel Biomarkers. Elsevier, New York.
-
Peters KE, Walters CC, Moldowan JM (2005b) The Biomarker Guide. Vol 2, 2nd (Edn.), Cambridge University Press, New York.
-
Hakimi MH, Hasiah AW, Shalaby MR (2011) Organic geochemical characteristics and depositional environments of the Jurassic shales in the Masila Basin of Eastern Yemen. Geo Arabia 16(1): 47-64.
-
Weiss HM, Wilhelms A, Mills N, Scotchmer J, Hall PB, et al. (2000) NIGOGA - The Norwegian Industry Guide to Organic Geochemical Analyses. 4th (Edn.), Hydro N Statoil Nor G SINTEF Petroleum Research and the Norwegian Petroleum Directorate, pp: 1-102.
-
Waples DW, Machihara T (1991) Biomarkers for Geologists. American Association of Petroleum Geologists.
-
Marynowsky L, Narkiewicz M, Grelowski C (2000) Biomarkers as environmental indicators in a carbonate complex, example from the Middle to Upper Devonian, Holy Cross Mountains, Poland. Sediment Geol 137(3-4): 187-212.
-
Volkman JK, Banks MR, Denwer K, Aquino Neto FR (1989) Biomarker composition and depositional setting of Tasmanite oil shale from northern Tasmania Australia. 14th International Meeting on Organic Geochemistry, Paris, pp: 18-22.
-
Aquino Neto FR, Trendel JM, Restle A, Connan J, Albrecht PA (1983) Occurrence and formation of tricyclic and tetracyclic terpanes in sediments and petroleums. In: Bjoroy M (Eds.), Advances in organic geochemistry_,_ Chichester, Wiley, pp: 659-667.
-
Ogbesejana AB, Bello OM, Tijjani A, Uduma UA, Kamaluddeen SK, et al. (2020) Geochemical significance of tricyclic and tetracyclic terpanes in source rock extracts from the Offshore Niger Delta Basin, Nigeria. Acta Geochim 148-198.
-
Ourisson G, Albrecht P, Rohmer M (1979) Hopanoids: palaeochemistry and biochemistry of a group of natural products. Pure Appl Chem 51: 709-729.
-
Gürgey K (1999) Geochemical characteristics and thermal maturity of oils from the Thrace Basin (western Turkey) and western Turkmenistan. J Pet Geol 22(2): 167-189.
-
Sinninghe Damsté JS, Kenig F, Koopmans MP, Köster J, Schouten S, et al. (1995) Evidence for gammacerane as an indicator of water column stratification. Geochimica et Cosmochimica 59(9): 1895-1900.
-
Meyers PA, Snowdon LR (1993) Types and maturity of organic matter accumulated during Early Cretaceous subsidence of the Ex-mouoh Plateau, Northwest Australia margin. American Association of Petroleum Geologists Studies in Geology 37: 119-130.
-
Akinlua A, Ajayi TR, Adeleke BB (2007) Organic and inorganic geochemistry of Northwestern Niger Delta oils. Geochemical Journal 41: 271-281.
-
Meyers PA (1997) Organic geochemical proxies of paleooceanographic, paleolimnlogic, and paleoclimatic processes. Organic Geochemistry 27(5-6): 213-250.
-
Zeb SF, Zafar M, Jehandad S, Khan T, Siyar SM, et al. (2020) Integrated geochemical study of Chichali Formation from Kohat sub‑basin, Khyber Pakhtunkhwa, Pakistan. Journal of Petroleum Exploration and Production Technology 10: 2737-2752.
-
Hail Hakimi M, Al-Sufi SA (2018) Organic geochemistry investigations of crude oils from Bayoot oilfield in the Masila Basin, east Yemen and their implication for origin of organic matter and source-related type. Egyptian Journal of Petroleum 27(1): 37-54.
-
El-Sabagh SM, El-Naggar AY, El Nady MM, Ebiad MA, Rashad AM, et al. (2018) Distribution of triterpanes and steranes biomarkers as indication of organic matters input and depositional environments of crude oils of oilfields in Gulf of Suez, Egypt. Egyptian Journal of Petroleum 27(4): 969-977.
-
El Diasty WS, Moldowan JM (2012) Application of biological markers in the recognition of the geochemical characteristics of some crude oils from Abu Gharadig Basin, north Western Desert–Egypt. Mar Pet Geol 35(1): 28-40.
-
Chaiseanwang P, Piyaphong C (2020) Organic geochemical characteristics of Mae Teep coal deposits, Thailand. Science Asia 46S: 102-109.
-
Seifert W, Moldowan MJ (1986) Use of biological markers in petroleum exploration. In: Johns RB (Eds.), Methods in Geochemistry and Geophysics. Elsevier, Amsterdam 24: 261-290.
-
Gallegos EJ, Moldowan JM (1992) The effect of hold time on GC resolution and the effect of collision gas on mass spectra in geochemical “biomarker” research. In: Moldowan JM, et al. (Eds.), Biological Markers in Sediments and Petroleum. Prentice Hall, Englewood Cliffs, pp: 156-181.
- Nigeria’s Vulnerability in the Face of Global Energy Policy
- A Simulation Study of Investigation of Optimum Oil Production Performance by Applying Various Gas Injection Methods in Oil Reservoir
- Characterization of Permo-Triassic Reservoirs through Thermal Maturity Assessment of Westphalian Source Rocks in the Cheshire Basin
- Influence of Microwax on the Rheological and Thermal Behaviour of a Wax Crude Oil
- Real-Time Monitoring and Performance Optimization of Steam Injection in Heavy Oil Reservoirs Using Fiber Optic Sensing and Integrated Predictive Simulation Models
- Rapid On-Site Determination of the Total Petroleum Hydrocarbon Content of Soils by Handheld Fourier Transform Near-Infrared Spectroscopy: Development of a Global, Site- and Scanner- Independent Calibration Model