Biogenic SiO2 Nanoparticle-based Nanofluid for Fines Migration Control
Fines migration in reservoirs has a major impact on the oil industry, causing damage to formations due to micrometric particle mobilization and a consequent reduction in well productivity, thus resulting in significant economic damage. An emerging alternative for solving this problem is the use of nanofluids to mitigate fines migration. Due to their physicochemical properties, the mesoporous nanoparticles present in nanofluids interact with fines in the well, diminishing their mobility without an important decrease in permeability. In this work, the effect of a nanofluid composed of biogenic SiO2 mesoporous nanoparticles on fines migration control was studied. A biogenic mesoporous nanosilica was synthesized from rice husks and dispersed in a fluid composed of a mixture of diesel and xylene. Laboratory core-flooding experiments with crude oil were performed. The compositions of the crude oil and the collected material were measured to determine the changes in the crude oil after it interacted with the nanofluid. Fines production was significantly reduced by the use of the nanofluid. The results showed that 0.4% SiO2 nanoparticle fluid decreased fines migration by up to 60% with a small variation in permeability. The results of the GPC-ICP-HRMS analysis of the crude oil after treatment showed that the nanoparticles adsorbed a fraction of the asphaltenes in the crude oil and served as nucleation centers for the agglomeration of fines, forming larger structures with high porosity and allowing the fines to be retained in the core with a low decrease in permeability.
Introduction
A nanofluid is common terminology used to refer to a colloid solution consisting of solid materials or nanoparticles (NPs) with a particle size of less than ∼100 nm when dispersed in fluid. The dispersant, also known as the base fluid, can be a liquid, organic solvent or gas [1, 2, 3]. In recent years, the use of nanofluids in the oil industry has increased, and their use in drilling fluids to mitigate formation damage has shown good results. Recent publications show the diverse applications of nanotechnologies for solving problems in the oil industry [4, 5, 6, 7, 8, 9, 10, 11, 12, 13]. In these works, the authors describe how the nanoparticles act by changing the properties of the formation or the interactions of the fines with the formation rock. The term formation damage refers to a decline in well productivity. Fines formations are defined as any loose or unconsolidated particles in the pore space of porous media. The formation damage mechanism related to fines migration includes surface attachment, pore-throat bridging or straining and infiltration sedimentation. These fines are small enough to pass through 400 U S mesh screen or pore throats [14]. The migration of fines in reservoirs is one of the main problems that occurs during the different life stages of oil wells. These fine particles block the pore throats in porous media, affecting reservoir permeability and decreasing productivity and injectivity. Different studies of oil and gas production provide evidence of the significant decrease in productivity by near-wellbore permeability reduction due to the accumulation of fines [15, 16, 17]. This phenomenon commonly occurs due to the formation damage associated with the mobilization of fine particles with typical sizes of approximately 37 μm [15]. The mechanical equilibrium of attaching electrostatic force and detaching drag and lifting forces is disturbed by geothermal fluids with a high velocity or reduced ionic strength [18].
Usually, acidizing treatments are used for remediating formation damage by fines [15, 19], with the treatments involving chemicals such as CH2O2, CH3COOH, HCl, and HF [20]. These chemicals are used in different mixtures and dosages to control fines migration by dissolving clay fines, unblocking pore throats, and increasing the permeability of porous media. However, there are some difficulties associated with deep live-acid penetration [15] and the consequent modification of the properties of the crude oil due to the crude oil interacting with the acid medium.
Nanotechnology has been widely used in recent years in the oil and gas industry. Some advantages of the use of Si- based nanofluids associated with IFT reduction, wettability alteration, and viscosity enhancement have been reported [1, 21, 22, 23]. Nanoparticles have a high surface-to-volume area, which allows them to enter small pore throats without changing the porosity and permeability of the formation [24]. Silicon dioxide, also known as silica, is one of the most abundant compounds on earth and is the principal constituent of sand and sandstone. Therefore, silica nanoparticles are one of the most commonly used and cost-effective types of nanoparticles [24]. Recently, nanoparticles have been used to control fines migration. Hasannejad, et al. [25] reported that using nanosilica at different concentrations can increase the critical flow rate and reduce fines migration. Ogolo, et al. [26] reported a recovery factor of 25% after waterflooding when a medium crude oil (API 22.4) was displaced using 0.3 wt % Si-NPs dispersed in ethanol from a sand pack. Abhishek and Hamouda [27] studied the effect of nanosilica on modifying the surface of Berea sandstone to control fines migration. Two types of nanosilica were used in the experimental work: silica with a stabilizer (3-mercaptopropyltrimethoxy silane) and sulfonate-functionalized silica. The results showed that silica NPs could reduce fines migration and improve water injectivity in Berea sandstone. In this work, the main pathway by which nanoparticles act is by modifying the rock surface or changing the properties of the fluid to alter the interfacial properties.
On the other hand, Mera, et al. [28] evaluated the migration of alumina fines in two sand pack beds with oil and water wettability using a silica nanoparticle-based nanofluid as a treatment at a 2.0% mass fraction dosage and the suspension of fines constituted by alumina microparticles. The results showed the great affinity between the fines and nanoparticles, and this was the main factor of increasing retention in the porous media regardless of the wetting state of the sand [28].
Most research aimed at studying the mitigation of fines generation during production is carried out using simple model systems to approximate real systems that more complex. In the present work, we study the effect of a nanofluid based on mesoporous silica in the mitigation of fines generation during production. A setup of pure crude oil and an assembled core with very similar characteristics to the real core was used. The whole system and procedure simulated the conditions of production. The results showed the effect of the nanofluid on both the dynamics of fines migration and the variations in the composition of the crude oil as an effect of the crude oil interacting with the nanofluid. A dispersion of 0.4% SiO2 nanoparticles in fluid decreased fines migration by up to 60% with a small variation in the permeability of the core. Analysis of the crude oil after contact with the nanofluid and of the material attached to the nanoparticles showed that the main interaction occurred between the asphaltene fraction of the crude oil and the nanoparticles, which contributed to the capturing of the fines, forming a porous filter cake that efficiently retained the fines and allowed the fluid phase to pass throughout the cake.
Materials and Methods
Materials
Toluene and xylene (HPLC grade, ≤99% purity) were obtained from Aldrich (US). Sand pack: Mixtures of 85% m31 sand (D50= 339 µm) + 10% Arizona fines (dust 10-20 µm, D50 = 15 µm), diesel and Dalia crude oil with an API gravity of 24 and 0.5% asphaltenes were obtained from CSTJF
TotalEnergies (Pau, France).
Biogenic SiO2 Nanoparticle Synthesis
Biogenic silica nanoparticles (NPs) were synthesized from rice husks using a calcination method previously reported by Castillo, et al. [29, 30, 31]. In brief, prewashed rice husks were lixiviated with hydrochloric acid for 24 h and washed with water until a neutral pH was measured. The rinsed rice husks were dried in an oven at 110°C for 3 h, and then the temperature was raised to 700°C for 6 h. Finally, NPs were obtained after 12 h of grinding in a ball mill. The average size of the NPs was measured by dynamic light scattering, and the specific surface area was measured by BET. The nanofluid was prepared by dispersing an adequate quantity of biogenic SiO2 NPs in a diesel:xylene mixture.
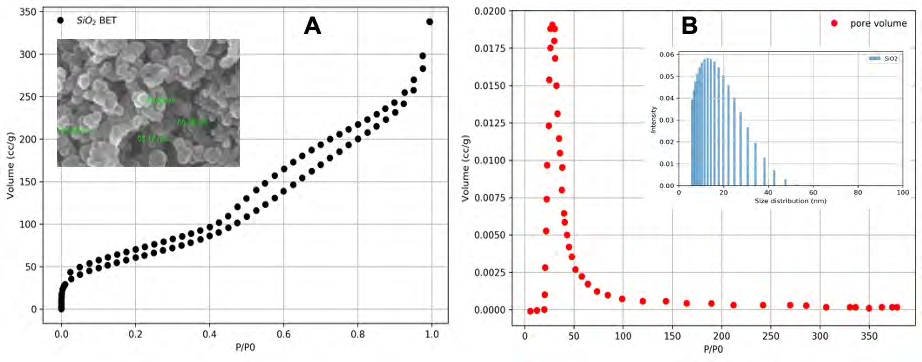
Figure 1A shows the BET nitrogen adsorption curve and an SEM image (in the inset) of the SiO2 nanoparticles used. The BET graph illustrates the typical behavior of mesoporous materials with a hysteresis loop plot indicative of a type IV isotherm. The average particle size was measured by SEM and dynamic light scattering (inset in Figure 1B) with an average size of 40 nm and a pore with an average pore size of 2.3 nm, as shown in Figure 1B. The specific surface area calculated from the BET curve was 234 m2/g. This result confirmed that the nanoparticles used to prepare the nanofluid were nanometric and highly porous.
Core Assembly
A core was made by mixing m31 sand and Arizona fines at ratios of 85% and 15% in a stainless-steel Hassler cell that was 46 cm long, 14 cm in external diameter and 10.5 cm in internal diameter, as shown in Figure 2.
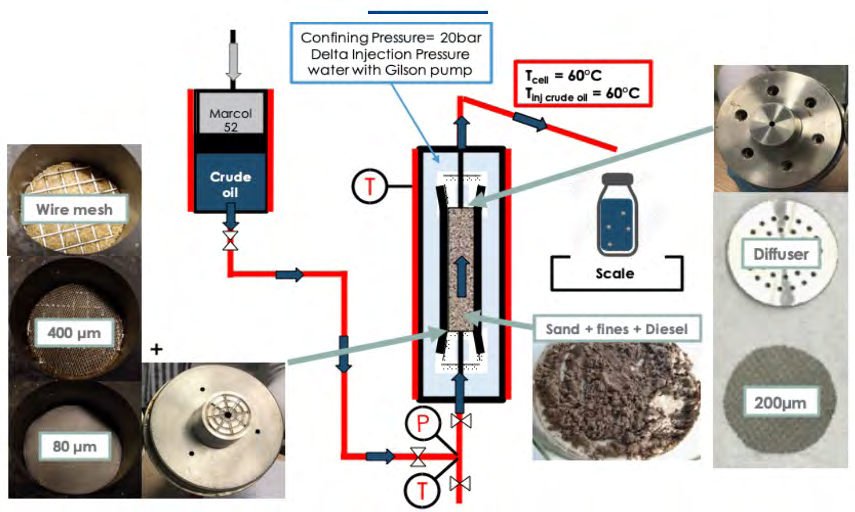
Inside the Hassler cell, a Viton sleeve with retainers of 80 and 400 μm served as the core holder. The sand and fines mixture was washed with an excess of diesel and mixed, ensuring that the mixture was completely impregnated with diesel, and then the excess solvent was removed. The mixture was left in the oven at 110°C for 7 hours and then left in a fume hood overnight. The system was packed with a 200 μm filter, a fluid diffuser was set, the core was sealed with a piston, and the Hassler cell was closed. The Hassler cell was completely filled with water to a confining pressure of 20 bar over the injection pressure and a temperature of 60°C.
Four experiments were carried out: the first experiment was performed a) to evaluate the production of fines without treatment by injecting crude oil through the cell, the second experiment was performed b) with the base fluid (diesel: xylene), and the other two experiments were performed (c and d) to study the influence of the nanofluid at two different concentrations.
Crude Oil Injection
After the experimental setup was assembled, the system was allowed to reach equilibrium for 12 hours. Then, the crude oil was injected in the direction of production, as shown in Figure 2 (arrows), and the crude oil was pumped by a piston pump to the Hassler cell with a variable flow rate between 0.5 and 50 ml/min. The core was placed in the Hassler cell with a confining pressure of 20 bar and a temperature of 60°C. The crude oil was collected at the cell outlet in vials for further analysis. The system was left for approximately 20 hours to reach equilibrium. The same procedure was performed in all the experiments.
Reference Test 1: In this experiment, crude oil was injected in the direction of production, with a flow of 0.5 ml/ min, and 4 samples of 20 grams were collected. Then, the injection flow was increased from 0.5 to 1, 2.5, 5, 10, 20 and 50 ml/min, and 4 samples were taken at each flow rate. In each run, the maximum amount of fines migrating through the core was recorded, and the degree of interaction of nanoparticles with the crude oil at different flow rates was determined. This results of this experiment served as a reference for the interaction of the crude oil with a nucleus with fines to determine the migration of fines under normal conditions.
Reference Test 2: In this experiment, the core was washed with the diesel/xylene base mixture, and the washing solution was injected in counter flow, simulating what happens in a field experience during stimulation. A volume of twice the volume of the nucleus was injected, with a flow of approximately 0.5 ml/min.
The fluid was allowed to interact with the core for 20 hours under experimental conditions. Finally, crude oil was injected in the direction of production, and samples were collected at different flow rates of 0.5 to 1, 2.5, 5, 10, 20 and 50 ml/min.
Nanofluid Tests
For the nanofluid tests at concentrations of 0.4 and 0.6%, the protocol used was the same as that for reference test 2. The nanofluid was injected and allowed to interact with the nucleus for 24 hours until equilibrium was reached. Then, crude oil was injected in the direction of production, and samples were collected at different flow rates of 0.5 to 1, 2.5, 5, 10, 20 and 50 ml/min.
Filtration
The size distribution of the fines was between 10-20 µm, and each sample taken in each experiment was dissolved with toluene and filtered with an 8 μm Millipore filter. The solvent used to wash the filtrate was the same as that used to filter the entire sample, and the samples were stored in sealed vials for posterior analysis. The fines were recovered with the filter, the solvent was allowed to evaporate, and then the recovered fines was weighed to determine the mass of fines present in each sample.
GPC ICP HR MS Analysis
A fraction of the filtered solutions from each experiment was also studied by GPC-ICP HR MS to analyze the composition of the original crude oil once it interacted with the nanofluid. To maintain the solutions at the same concentration, an aliquot of each of the solutions was evaporated under a stream of nitrogen until constant weight. Subsequently, the mass of crude oil in each of the samples was determined, and solutions were prepared at the same concentration in THF.
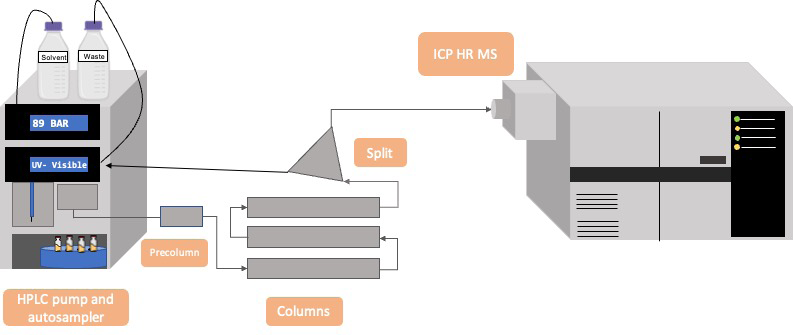
For each sample, 20 μL was injected and eluted isocratically at a flow rate of 1 mL.min−1 of THF for 120 min using a Dionex (Amsterdam, The Netherlands) HPLC system consisting of an UltiMate 3000 microflow pump, an UltiMate 3000 autosampler, and a low port-to-port dead- volume microinjection valve. A postcolumn splitter was used to divide the flow (20:1). The eluent from the low-flow outlet (50 μL/min) was sent to the ICP-HRMS instrument using a DS-5 microflow, and the eluent from the high-flow outlet (950 μL/min) was sent to waste. A similar system was previously described [32, 33, 34, 35].
In our separation scheme, the eluent for GPC separation was pure THF, which maximized the solubility of all the components in crude oil and limited the adsorption in the stationary phase. The detailed conditions used for ICP- HRMS detection have been previously reported [33, 34, 35], and a summarized description is given below. In Figure 3, a scheme of the system is presented. A Thermo Scientific Element XR sector field ICP-HRMS instrument operated at a resolution of 4000 (medium resolution) was used to measure spectrally interfering isotopes of 60Ni, 32S, and 51V. The spectrometer was equipped with a Fassel-type quartz torch shielded with a grounded Pt electrode and a quartz injector (1.0 mm i.d.). A Pt sampler (1.1-mm orifice diameter) and a Pt skimmer (0.8 mm orifice diameter) were used. O2 flow was continuously supplied to the nebulizer Ar gas flow. The MS was fitted with a modified DS-5 microflow total consumption nebulizer (CETAC, Omaha, NE) mounted on a custom-made, low-volume (8-mL), single-pass jacketed glass spray chamber without a drain, as described elsewhere [28]. The spray chamber was thermostated to 60 °C with water using a Neslab RTE-111 (Thermo Fisher Scientific, Waltham, MA) temperature-controlled bath circulator. Separations were conducted using three Styragel styrene-divinylbenzene gel permeation columns connected in series (7.8 × 300 mm). These columns were HR4 (particle size, 5 μm; exclusion limit, 600,000 Da polystyrene [PS] equivalent), HR2 (particle size, 5 μm; exclusion limit, 20,000 Da), and HR0.5 (particle size, 5 μm; exclusion limit, 1000 Da) columns. A Styragel guard column (4.6 × 30 mm) was incorporated before these three columns to protect them and prolong their lifetimes. The separation achieved by the columns was evaluated using a mixture of PS standards ranging from 2630 kDa to 381 Da with the combination of GPC and a refraction index detector. The ICP-HRMS conditions were controlled and optimized daily using a 1.0 ng g−1 multielement (V, Ni and S) tuning solution in THF delivered via a syringe pump. The peaks of the isotopes chosen at these conditions were baseline-resolved from the interferences. A built-in software application was used to integrate the recorded signal. The data acquisition method was updated with a mass offset determined for each isotope to compensate for the mass drift resulting from the magnet sector.
Results
Fines Production
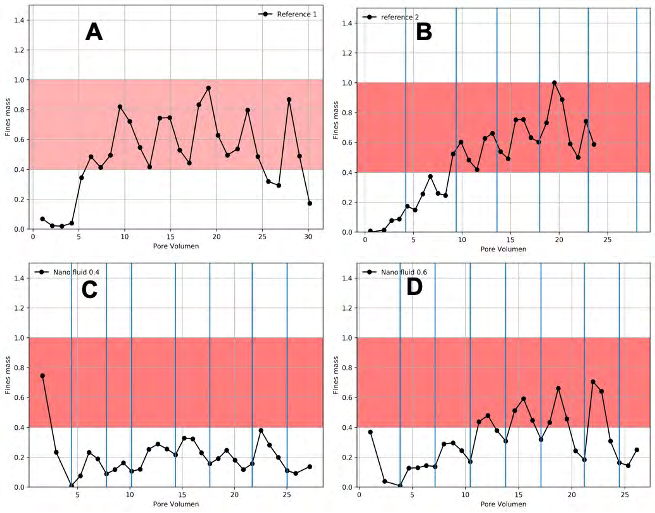
In the first experiment, the amount of fines generated as the fluid passed through the core was measured. Figure 4A shows the reference test 1 experiment where a constant generation of fines was observed from 5 pore volumes. When the crude oil was passed through the mixture (sand and fines), it induced the migration of small particles to the outside of the core. Initially, the particles were retained in the core, and then as the amount of fluid increased, they were constantly and progressively detached.
The percentage of fines generated remained constant when the flow rate of crude oil remained constant, and the pressure underwent small variations. As the flow rate was increased, the generation of fines increased proportionally, as did the pressure.
The results of reference test 2 are shown in Figure 4B, where the core was washed with a mixture of diesel/xylene. The effect of the washing induced a viscosity decrease in the initial fluid, and the fines in the core began to detach with the first volumes of crude oil injected and detached progressively and in greater quantities until reaching values similar to those obtained in the reference test 1 experiment (Figure 4A). The dark zone in Figure 4 indicates the zone of high fines production in the reference test experiments.
For the experiments in which the nanofluid was passed at concentrations of 0.4% and 0.6% (Figure 4C and D), a significant decrease in the generation of fines was observed. In both cases, there was a low production of fines when the crude oil was passed through the core after nanofluid treatment. When the flow of crude oil was increased, the increase in pressure produced a greater output of fines, which then decreased rapidly. This effect was most noticeable in reference tests and is the normal behavior of the system. These results clearly show that treating the core with the nanofluid significantly reduced the amount of fines generated at each flow of oil passed through the core.
Pressure Variation
An important parameter to control in the mitigation of fines control is the pressure difference between the core inlet and outlet. Figure 5 shows the pressure variation at different flow rates of crude oil passing through the core. Reference test 1 resulted in a relatively small variation, reaching saturation at 50 mL/min. In the case where the nanofluid was used, an increase in the pressure variation was observed due to the effect of fines retention produced by the interaction of fines with the nanoparticles present in the nanofluid. In both cases, an increase in pressure was observed, reaching saturation at relatively low pressure values for those observed in real conditions.
k Q p µ = ∆ (1)
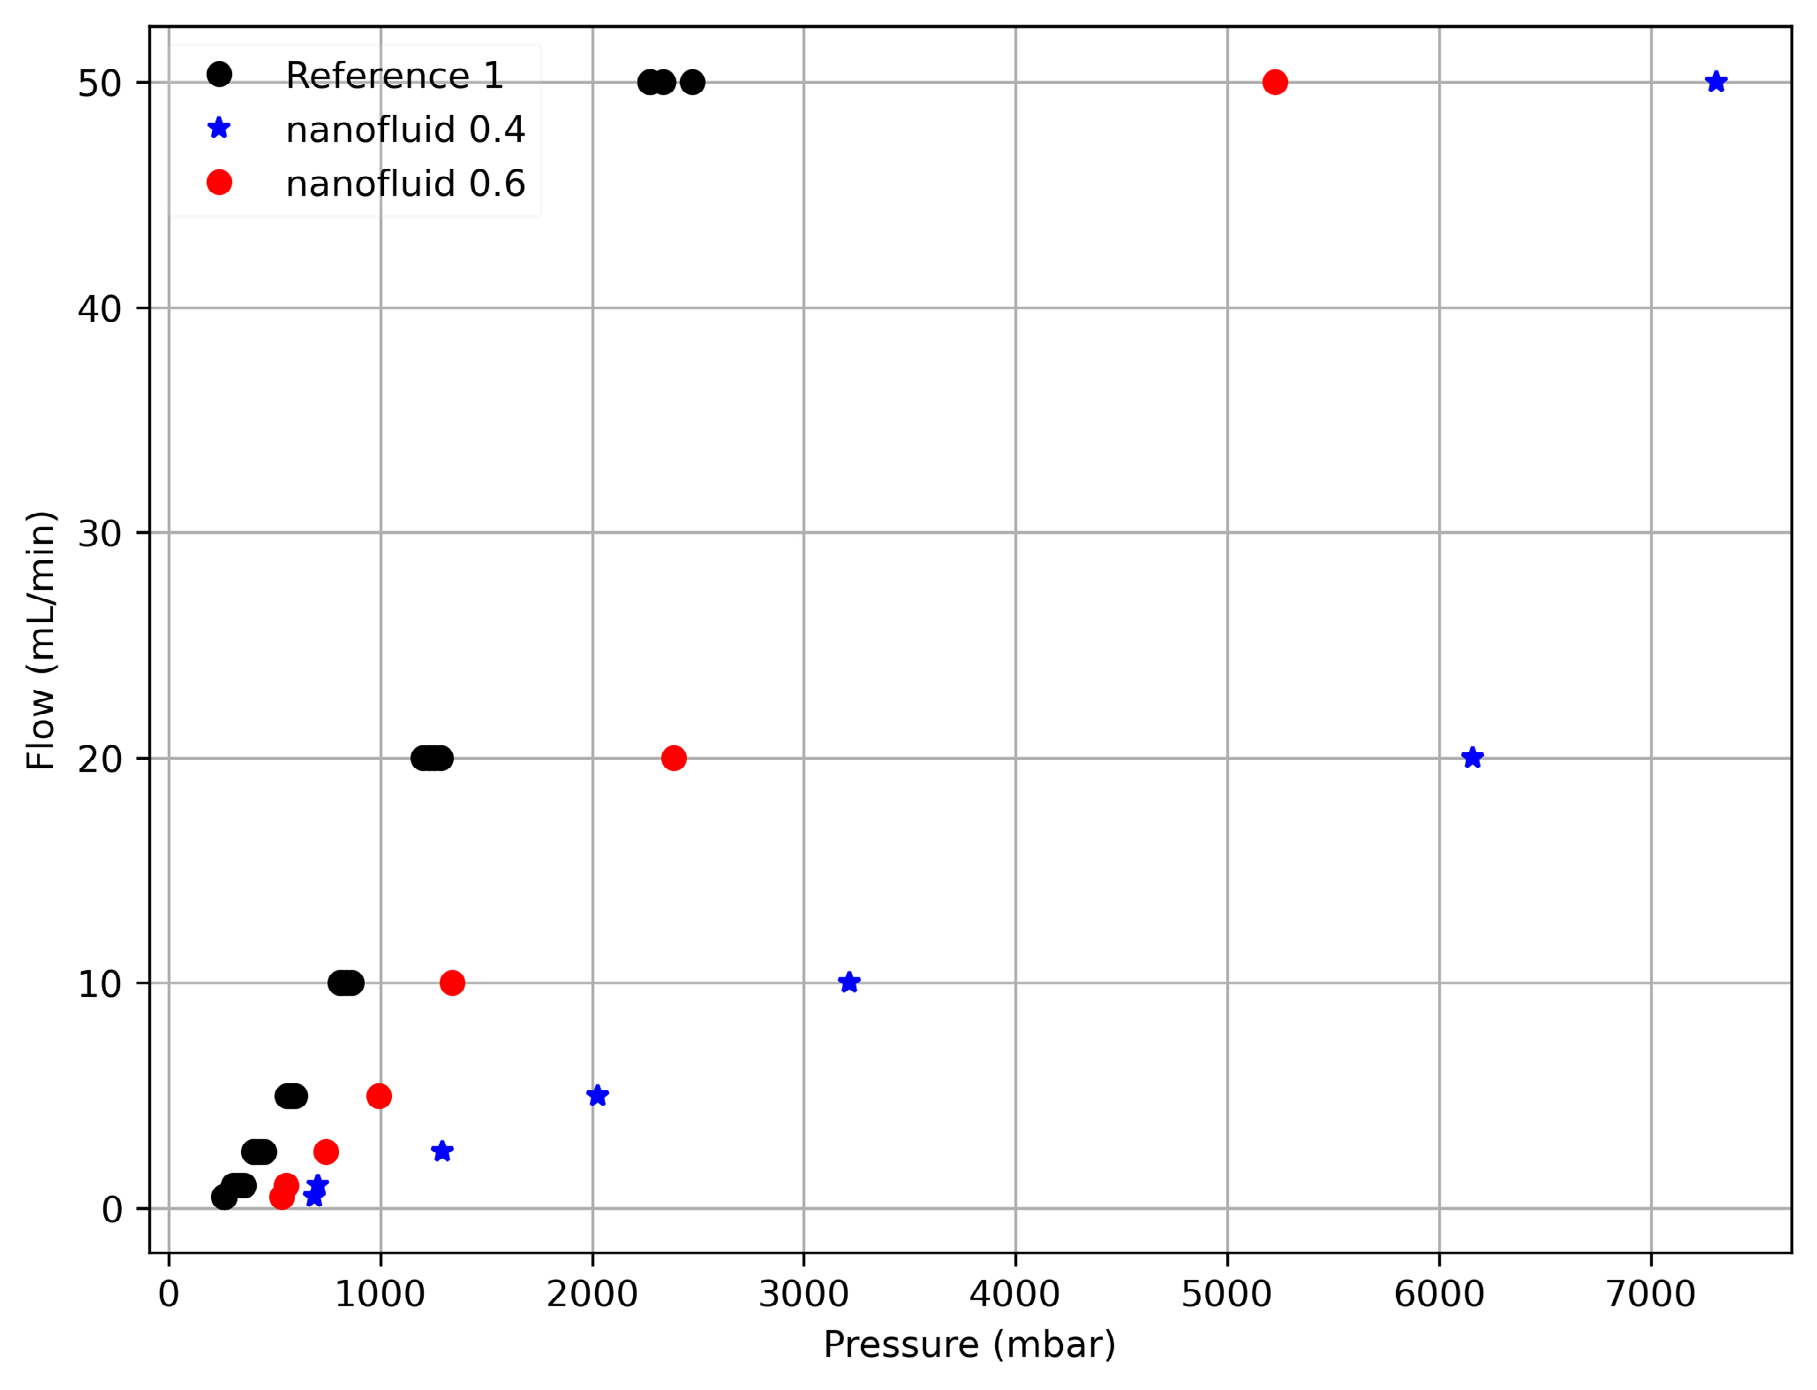
Figure 5: Flow variation as a function of pressure variation for the reference test experiment (diesel/xylene) and the experiments with different nanofluid concentrations. Dark circles indicate the reference test data, stars indicate the data for the experiment with the nanofluid at 0.4% concentration, and clear circles indicate the data for the experiment with the nanofluid at 0.6% concentration.
The relationship between the flow of a fluid through a medium was determined by Darcy’s law (Equation 1), where the flow (Q) is proportional to the pressure drop and the permeability k and viscosity m. According to Darcy’s law, there is a proportional variation in the pressure drop with the flow, modulated by the permeability of the medium; for a fluid with constant viscosity, the slope of the curve is the permeability of the medium [36]. In our case, the treatment with the nanofluid generated a decrease in the permeability of the core due to the entrapment of fines. This difference was due to variations in the permeability of the core due to the migration of fines. After treatment with nanofluid, two phenomena occurred: the first was a decrease in permeability, since the retention of fines caused the packing of fines in the core, leaving fewer empty spaces for the fluid to pass through; and the second effect was the nonlinear behavior of the permeability, making these changes less noticeable. The pressure variations that occurred due to the retention of fines with the nanofluid were only a fraction of the pressure variations that occurred in the reference systems. In the reference systems, the permeability was constant in the work range, and the variation in the pressure was linear with the flow increment [36].
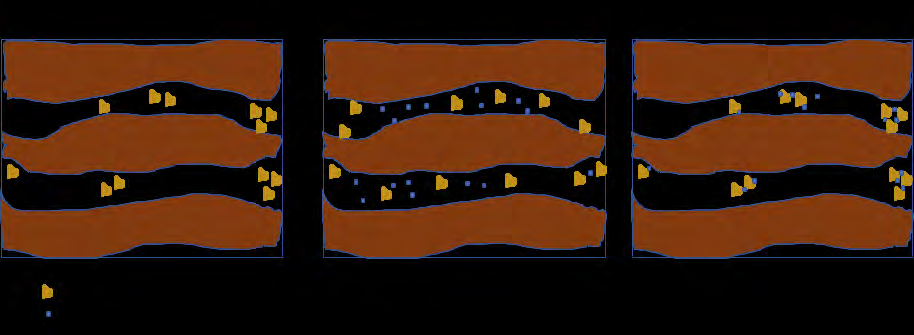
Figure 6 shows a sketch of the hypothesis of the action mechanism of the nanoparticles for retaining fines. Image 6A shows the crude oil flow with fines in channels throughout the porous media of the core. In this case, the fines are free to move and migrate as fast as the fluid can transport. Image 6B represents the flow with the nanofluid, and image 6C represents the nanoparticles after interacting with the crude oil trapping the fines grains. The sketch shows our hypothesis that the nanoparticles adsorbed a polar fraction in the crude oil and agglomerated the fines, forming a huge aggregate. The mesoporous characteristic of the nanoparticles allowed the fluid to move throughout the pores with a low increment in the pressure of the system.
Total Fines Production
Figure 7 summarizes the results obtained for all the tests. The amount of fines in each of the samples in each experiment was measured, and the results were plotted as the fraction of fines retained as a function of the mass of crude oil. The behavior in all cases was similar in general, with a decrease in the mass of fines retained in the core as the volume of treated crude oil increased. Three differences can be noted in the curves: the starting point of fines generation, the slope or rate of generation and the maximum amount generated.
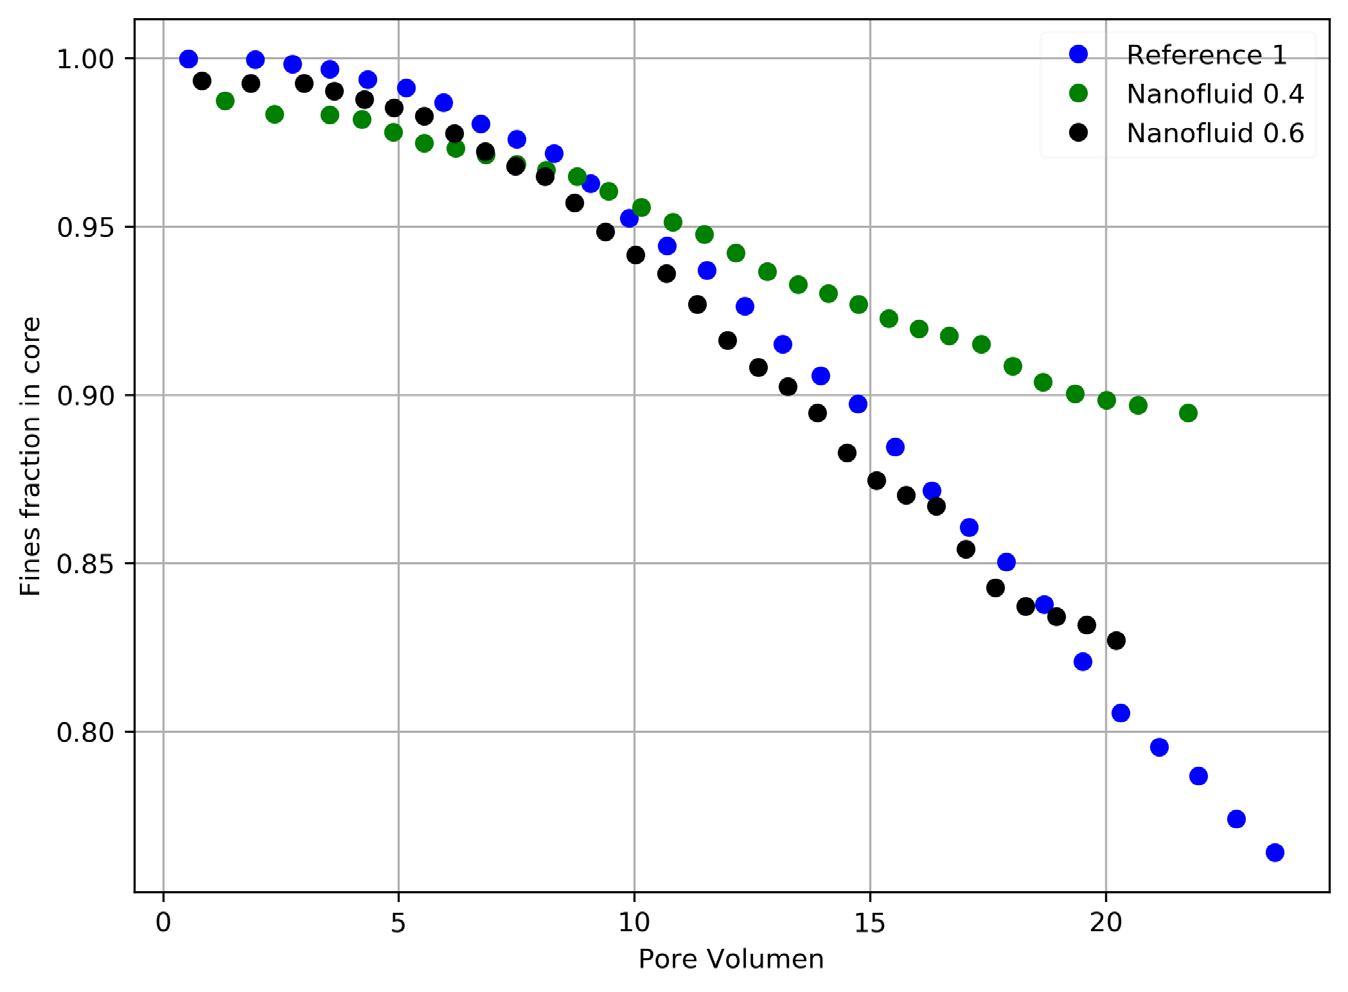
In general, the behavior indicated by all the plots was very similar. For reference test 1 with the first samples, a small amount of fines was detached from the core at low flow, and the amount of fines retained decreased in the subsequent measurements as the flow increased. For the 0,2 and 0,4% nanofluid concentration samples, few fines were retained in the first samples. As the flow rate increased, the amount of fines generated increased but at a lower level for the 0.2% nanofluid treatment and an even lower level for the 0.4% nanofluid treatment. The experiments with nanofluid treatment delayed the production of fines that did not adhere well to the core, and then there was a stabilization of the flow with a marked decrease in the fines produced, regardless of the flow used. The variation in the slopes of the curve before NP treatment reflected a lower rate of mass deposition.
Crude Oil Composition
To test our hypothesis, samples of the original crude oil and samples of the crude oil after being in contact with the fines were analyzed. The filtrated solutions were analyzed by GPC ICP HR MS with detection of vanadium and sulfur, and the solutions taken at the same time in each experiment were compared, as shown in Figure 8.
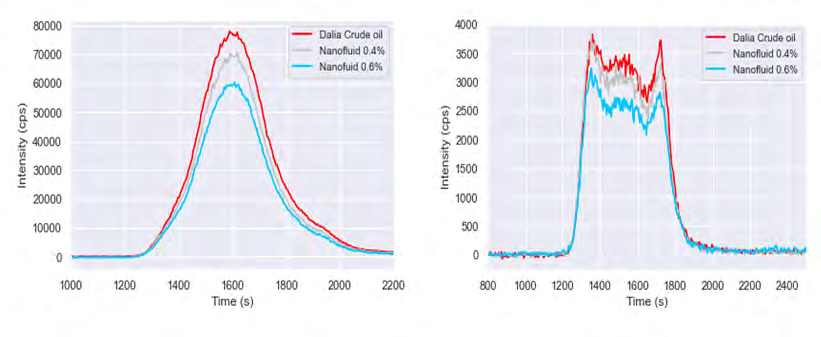
Figure 8 shows the decrease in the intensity profile of the size distribution that was observed in the detection of sulfur and vanadium. It was shown that the nanoparticles adsorbed a small portion of the asphaltenes despite being present in low concentrations.
The fines were retained more effectively with the nanofluid at a concentration of 0.4%, which decreased its level of interaction with the crude oil fractions, and very small changes in the GPC ICP HR MS chromatograms were observed. On the other hand, the 0.6% concentration of NPs in the nanofluid retained less of the fines but had a greater level of interaction with the crude oil, and a portion of the crude oil was adsorbed on the NPs. An important point to note is that the sulfur and vanadium signals are the ones that show the most important decreases, which has a very important meaning since the retention of sulfur compounds or compounds with high vanadium contents generates important improvements at the refining level.
Conclusions
A nanofluid composed of a diesel/xylene mixture and silica nanoparticles was prepared. The nanofluid at a concentration of 0.4% formed a stable dispersion for more than 48 hours. Injection of the nanofluid into a core with up to 15% fines was shown to decrease fines migration, decreasing production by more than 50% without a significant increase in production pressure. At flow rates below 10 ml/min (0.6 L/H), the pressure increase was negligible in production. GPC-ICP HR MS analysis showed that the nanoparticles in the nanofluid interacted with the asphaltenes and promoted the entrapment of fines in the core, forming a porous filter cake that aided in the retention of fines without significantly increasing the inlet pressure of the system.
Acknowledgment
The financial support provided by the CSTJF TotalEnergies (Pau, France) is gratefully acknowledged.
References
-
Nguele R, Sreu T, Inoue H, Sugai Y, Sasaki K (2019) Enhancing oil production using silica-based nanofluids: preparation, stability, and displacement mechanisms. Industrial & Engineering Chemistry Research 58(32): 15045-15060.
-
Li Y, Zhou J, Tung S, Schneider E, Xi S (2009) A review on development of nanofluid preparation and characterization. Powder Technology 196(2): 89-101.
-
Suleimanov BA, Ismailov FS, Veliyev EF (2011) Nanofluid for enhanced oil recovery. Journal of Petroleum Science and Engineering 78(2): 431-437.
-
Kong X, Ohadi MM (2010) Applications of micro and nano technologies in the oil and gas industry-an overview of the recent progress. Abu Dhabi international petroleum exhibition and conference, Abu Dhabi.
-
Zabala R, Franco CA, Cortés FB (2016) Application of nanofluids for improving oil mobility in heavy oil and extra-heavy oil: a field test. SPE improved oil recovery conference, Tulsa, Oklahoma, USA.
-
Huang TT, Evans BA, Crews JB, Belcher CK (2010) Field case study on formation fines control with nanoparticles in offshore wells. SPE annual technical conference and exhibition, Florence, Italy.
-
El-Diasty AI, Ragab AM (2013) Applications of nanotechnology in the oil & gas industry: latest trends worldwide & future challenges in Egypt. North Africa technical conference and exhibition, Cairo, Egypt.
-
Roustaei A, Bagherzadeh H (2015) Experimental investigation of SiO2 nanoparticles on enhanced oil recovery of carbonate reservoirs. Journal of Petroleum Exploration and Production Technology 5(1): 27-33.
-
Ramezanpour M, Siavashi M (2019) Application of SiO2–water nanofluid to enhance oil recovery. Journal of Thermal Analysis and Calorimetry 135(1): 565-580.
-
Madadizadeh A, Sadeghein A, Riahi S (2022) The use of nanotechnology to prevent and mitigate fine migration: a comprehensive review. Reviews in Chemical Engineering 38(1): 1-16.
-
Alnarabiji MS, Husein MM (2020) Application of bare nanoparticle-based nanofluids in enhanced oil recovery. Fuel 267: 117262.
-
Moghadasi R, Rostami A, Hemmati-Sarapardeh A, Motie M (2019) Application of nanosilica for inhibition of fines migration during low salinity water injection: experimental study, mechanistic understanding, and model development. Fuel 242: 846-862.
-
Yuan B, Moghanloo RG, Wang W (2018) Using nanofluids to control fines migration for oil recovery: nanofluids co-injection or nanofluids pre-flush? -A comprehensive answer. Fuel 215: 474-483.
-
Mansour M, Eleraki M, Noah A, Moustafa E-A (2021) Using nanotechnology to prevent fines migration while production. Petroleum 7(2): 168-177.
-
Giraldo LJ, Diez R, Acevedo S, Cortés FB, Franco CA (2021) The effects of chemical composition of fines and nanoparticles on inhibition of formation damage caused by fines migration: insights through a simplex-centroid mixture design of experiments. Journal of Petroleum Science and Engineering 203: 108494.
-
Rahman SS, Arshad A, Chen H (1994) Prediction of critical condition for fines migration in petroleum reservoirs. SPE Asia Pacific oil and gas conference, Melbourne, Australia.
-
Russell T, Chequer L, Borazjani S, You Z, Zeinijahromi A, et al. (2018) Formation damage by fines migration: mathematical and laboratory modeling, field cases. In: Yuan B, et al. (Eds.), Formation damage during improved oil recovery: fundamentals and applications. Elsevier, Edinburgh, UK, pp: 69-175.
-
You Z, Badalyan A, Yang Y, Bedrikovetsky P, Hand M (2019) Fines migration in geothermal reservoirs: laboratory and mathematical modelling. Geothermics 77: 344-367.
-
Yuan B, Wood DA (2018) A comprehensive review of formation damage during enhanced oil recovery. Journal of Petroleum Science and Engineering 167: 287-299.
-
Crowe C, Masmonteil J, Thomas R (2020) Trends in matrix acidizing.
-
Franco CA, Zabala R, Cortés FB (2017) Nanotechnology applied to the enhancement of oil and gas productivity and recovery of Colombian fields. Journal of Petroleum Science and Engineering 157: 39-55.
-
Taborda EA, Franco CA, Lopera SH, Alvarado V, Cortés FB (2016) Effect of nanoparticles/nanofluids on the rheology of heavy crude oil and its mobility on porous media at reservoir conditions. Fuel 184: 222-232.
-
Manshad AK, Ali JA, Haghighi OM, Mohammad Sajadi S, Keshavarz A (2022) Oil recovery aspects of ZnO/SiO2 nano-clay in carbonate reservoir. Fuel 307: 121927.
-
Negin C, Ali S, Xie Q (2016) Application of nanotechnology for enhancing oil recovery – a review. Petroleum 2(4): 324-333.
-
Hasannejad R, Pourafshary P, Vatani A, Sameni A (2017) Application of silica nanofluid to control initiation of fines migration. Petroleum Exploration and Development 44(5): 850-859.
-
Ogolo NA, Olafuyi OA, Onyekonwu MO (2012) Enhanced oil recovery using nanoparticles. SPE Saudi Arabia section technical symposium and exhibition, Al-Khobar, Saudi Arabia.
-
Abhishek R, Hamouda AA (2017) Effect of various silica nanofluids: reduction of fines migrations and surface modification of berea sandstone. Applied Sciences 7(12): 1216.
-
Mera CM, Ariza CAF, Cortés FB (2013) Uso de nanopartículas de sílice para la estabilización de finos en lechos empacados de arena Ottawa. Informador Técnico 77(1): 27.
-
Castillo J, Vargas V, Gonzalez G, Ruiz W, Bouyssiere B (2022) Evidence of selective asphaltene subfraction adsorption on SiO2 nanoparticles studied by UV-vis absorbance and fluorescence spectroscopy. Journal of Dispersion Science and Technology 43(6): 873-879.
-
Castillo J, Gonzalez G, Bouyssiere B, Vargas V (2023) Asphaltenes, subfractions A1 and A2 aggregation and adsorption onto RH-SiO2 nanoparticles: solvent effect on the aggregate size. Fuel 331 (Part 1): 125635.
-
Acevedo N, Vargas V, Piscitelli V, Le Beulze A, Bouyssiere B, et al. (2021) SiO2 biogenic nanoparticles and asphaltenes: interactions and their consequences investigated by QCR and GPC-ICP-HR-MS. Energy & Fuels 35(8): 6566-6575.
-
Vargas V, Castillo J, Ocampo Torres R, Bouyssiere B, Lienemann CP (2017) Development of a chromatographic methodology for the separation and quantification of V, Ni and S compounds in petroleum products. Fuel Processing Technology 162: 37-44.
-
Desprez A, Bouyssiere B, Arnaudguilhem C, Krier G, Vernex-Loset L, et al. (2014) Study of the size distribution of sulfur, vanadium, and nickel compounds in four crude oils and their distillation cuts by gel permeation chromatography inductively coupled plasma high- resolution mass spectrometry. Energy & Fuels 28(6): 3730-3737.
-
Caumette G, Lienemann CP, Merdrignac I, Paucot H, Bouyssiere B, et al. (2009) Sensitivity improvement in ICP MS analysis of fuels and light petroleum matrices using a microflow nebulizer and heated spray chamber sample introduction. Talanta 80(2): 1039-1043.
-
Giusti P, Ordóñez YN, Philippe Lienemann C, Schaumlöffel D, Bouyssiere B, et al. (2007) μFlow-injection–ICP collision cell MS determination of molybdenum, nickel and vanadium in petroleum samples using a modified total consumption micronebulizer. Journal of Analytical Atomic Spectrometry 22(1): 88-92.
-
Rosti ME, Pramanik S, Brandt L, Mitra D (2020) The breakdown of Darcy’s law in a soft porous material. Soft Matter 16(4): 939-944.
- Nigeria’s Vulnerability in the Face of Global Energy Policy
- A Simulation Study of Investigation of Optimum Oil Production Performance by Applying Various Gas Injection Methods in Oil Reservoir
- Characterization of Permo-Triassic Reservoirs through Thermal Maturity Assessment of Westphalian Source Rocks in the Cheshire Basin
- Influence of Microwax on the Rheological and Thermal Behaviour of a Wax Crude Oil
- Real-Time Monitoring and Performance Optimization of Steam Injection in Heavy Oil Reservoirs Using Fiber Optic Sensing and Integrated Predictive Simulation Models
- Rapid On-Site Determination of the Total Petroleum Hydrocarbon Content of Soils by Handheld Fourier Transform Near-Infrared Spectroscopy: Development of a Global, Site- and Scanner- Independent Calibration Model