Treatment of Effluents Containing Hydroquinone in a Batch Reactor: Optimization Technique via RSM, MAGM and Kinetic Modelling
The objective of the present work was to study a synthetic solution containing an initial hydroquinone concentration (C0) of 500 mg L–1 by using the advanced oxidation process (AOP) in a batch reactor. Furthermore, the aim was to propose an optimization process based on hydroquinone degradation (HD) and mineralization of the total organic carbon (TOC) by using hydrogen peroxide as a source of free hydroxyl radicals (•OH). In designing was used to optimize the process, initial hydrogen potential (pH), temperature of the liquid effluent (T), air flow supply (QAF), and stoichiometric molar ratio of organic toxic compounds to hydrogen peroxide (RH) on the process of degradation and TOC conversion of toxic organic compounds. The initial hydroquinone concentration was quantified and identified by high-performance liquid chromatography (HPLC). The optimal conditions for a given HQ degradation (100%) and TOC conversion (>80%) were identified. The kinetic model used to describe the profile of the TOC conversion remaining for the HQ was the lumped kinetic model (LKM), used to determine the kinetic constants of the reaction and provide an accurate determination of the residual fraction of organic compounds.
Introduction
The great technological growth of the chemical industry has led to the discovery of numerous substances; however, it has also led to the production of hazardous organic compounds, byproducts of industrial processes, or simply residues present in their effluents, which are harmful to human health and the environment [1, 2]. The main sources of such waste are refineries that transform crude oil, petrochemical plants, organic compound processing apparatus, and factories operating in the food industry, mineral industry, or in the manufacture of pulp and paper, pharmaceuticals, plastics, and metals [3, 4, 5, 6, 7, 8]. The class of chemical compounds derived from industrial processes typically present high levels of toxic and recalcitrant organics, such as phenols, and benzene, toluene, ethylbenzene and xylenos (collectively known as BTEX) [9, 10]. According to Resolution 430 of the Conselho Nacional do Meio Ambiente–CONAMA (National Council on the Environment) [11], which follows the environmental guidelines described in Standard Methods for the Examination of Water and Wastewater, Brazil set the maximum total concentration of phenols at 0.5 mg L–1 for all effluents originating from any polluting source that can be released into water bodies, as of May 13, 2011.
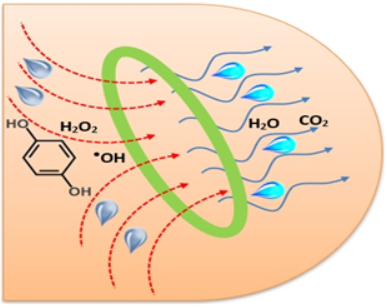
Currently, many technologies have been employed for the treatment of industrial wastewater, the three main groups being biological, chemical, and physical. A combination of processes, e.g., biological and chemical, it is also used, and the advantages of these treatments enable them to become efficient in the degradation of complex and toxic compounds, such as phenols, hydroquinone, catechol, BTEX, among others that are harmful and toxic to the ecosystem and the health of living [12, 13, 14, 15, 16, 17, 18, 19]. AOPs use various combinations of oxidants to generate intermediate reactions involving the hydroxyl radical (•OH), a species that is unstable and very reactive owing to its high oxidizing power (2.8 V) in acidic media, and is formed from the degradation of toxic organic pollutants. These methods are capable of converting almost all the most recalcitrant organic compounds that cannot be destroyed by conventional methods into carbon dioxide and water, a process called mineralization. This step results from oxidation-reduction reactions as well as from reactions involving other free radicals, except those involving simpler organic compounds such as oxalic acid, maleic acid, and acetone [20]. The AOPs can be divided into homogeneous and heterogeneous systems, with hydroxyl radical generation occurring in the presence or absence of ultraviolet radiation. Recently, Brandão, et al. [21] described the use of different treatments using AOPs for the removal of organic contaminants, including homogeneous systems [21, 22, 23, 24, 25]. The heterogeneous systems include for example the photocatalysis and electron-Fenton process [22, 23, 24, 25].
Currently, several computational tools are used to optimize these technological processes. Among these techniques, which include linear or nonlinear programming methods, and simultaneous modeling of multiple responses, the use of statistical software is highlighted. Thus, these statistical tools are increasingly being used to optimize chemical processes, which is remarkably effective for creating process models that reduce the time and cost of analysis [26, 27, 28]. The aim of the current work was mainly to propose an optimization and modelling process to obtain the maximum hydroquinone degradation (HD) and the highest percentage of total organic carbon (TOC) conversion. Thus, this research was important to assess a synthetic solution containing an initial concentration of hydroquinone as a typical poison, with the applicability of an advanced oxidation process (AOP) in a batch reactor with a constant agitation speed of 500 rpm, in order to propose an optimization and modelling process for HD and TOC conversion. This study presents the first example of process modeling with optimization by the use of a statistical software, and with hydrogen peroxide (H2O2) as a source of free hydroxyl radicals (•OH) for HD and TOC conversion. The kinetic model used to describe the profile of the TOC conversion was the lumped kinetic model (LKM). The modelling methods (response surface methodology‒RSM) were used to determine the relationship between input and output variables.
Materials and Methods
Chemicals
Experimental trials accomplished in a batch reactor were achieved with the employment of a synthetic hydroquinone solution (99% PA, Dinâmica), hydrogen peroxide, H2O2, analytical grade (35% PA, Vetec). Sulfuric acid (0.1 M) and sodium hydroxide (0.1 M) were prepared by adjusting the initial pH of the effluent as required. Methanol (UV/HPLC, 99.9% PA, Vetec) was used in the chromatographic analysis, and phosphoric acid (25% PA, Vetec) was used in the TOC analysis.
Experimental Setup
Figures 1A and 1B show a photograph and a schematic representation of the PARR stainless steel reactor, model 4848, used in the experiments. The reactor is a batch-type system, mechanically agitated, and has a capacity of 1.8 L (1.3 L usable volume), with simultaneous control of pressure, temperature, and stirring speed.
![Figure 2: Response surface methodology for TOC conversion. A) T(0C) versus pH; B) RH(%) versus pH; C) RH(%) versus T(0C). Brandão, et al. [36] using the DiCTT technique to treat phenolic organic effluents reported the production of hydroquinone, catechol, and parabenzoquinone intermediates during the degradation and mineralization of phenol. These authors also related that the highest percentage mineralization was obtained using a large amount of free hydroxyl radicals (•OH) in the medium. According to studies by Oliveira, et al. [37], in the phenol oxidation stage, the appearance of secondary compounds in the form of organic acids and, in the subsequent stages, of aldehydes and alkenes, reduces intermediates during the phenol degradation reaction.](/fulltextimages/10039/fig_2.png)
Initially, 1.3 L of a synthetic liquid effluent with an initial hydroquinone concentration (C0) of 500 mg L–1 was prepared by adjusting the initial pH of the effluent with 0.1 M H2SO4 or 0.1 M NaOH as required and transferred to a batch-type reactor containing a stirring system. A rotation rate of 500 rpm was used, with a temperature control corresponding to the factorial planning for each test, and the apparatus was then connected to the cooling system. The pressure used in the experiments was 1.0 kgf cm–2. An small fraction of the mole ratio of hydroquinone to hydrogen peroxide (RH) was introduced into the reactor to initiate hydroquinone oxidation in the liquid phase. For each assay, samples of approximately 20 mL of solution were collected in triplicate at successive times in dark plastic bottles and refrigerated. A sample of 20 mL of treated water without HQ was also collected to represent a blank for the hydroquinone solutions.
Analytical Method
High-Performance Liquid Chromatography (HPLC): The hydroquinone concentrations was monitored by a HPLC equipment (Shimadzu, prototypical LC-20AT, with included acquisition numbers by means of a UV detector and a CLC- ODS (M)/(C-18) column (Shimadzu) that was 250 mm in long and 4.6 mm in diameter. An isocratic elution method was used under the following conditions: oven temperature of 35 °C and injection volume of 20 μL. The flow rate 0.75 mL.min-1 used 10% methanol and 90% phosphoric acid with pH adjusted of 2.2; and UV detector wavelength, 270 nm to detect hydroquinone.
Total Organic Carbon (TOC): The percentage obtained in the TOC conversion was determined from the TOC equipment (VCSH prototypical, Shimadzu) to quantify the mineralization of the hydroquinone concentration [29].
Application of the Mole Stoichiometric Ratio and Definition of Response Variables
A molar stoichiometric of hydroquinone in the addition of hydrogen peroxide of 100% was used to totally convert 1 mole of hydroquinone into carbon dioxide and water in agreement with the reaction stoichiometry defined in the subsequent equation:
$$ C _ {6} H _ {4} \left(O H\right) _ {2} + 1 3 H _ {2} O _ {2} \rightarrow 6 C O _ {2} + 1 6 H _ {2} O \tag {1} $$ This molar ratio other than 100% was determined comparably by means of the stoichiometry in Equation (1). The percentage fraction of Hydroquinone Degradation (HD) obtained as a response variable, which is oxidizing during the advanced oxidative process was evaluated.
$$ H _ {D} (\%) = \frac {C _ {0} - C}{C _ {0}} x 1 0 0 \tag {2} $$
( )
0 where: C0= initial hydroquinone concentration in liquid effluent; C= hydroquinone concentration in liquid effluent at a given time.
The percentage conversion of TOC was obtained as a response variable, measures the sum of Total Organic Carbon (TOC) converted into CO2 and H2O. The % adjustment of TOC was determined using the subsequent calculation:
$$ T O C (\%) = \frac {T O C _ {0} - T O C}{T O C _ {0} - T O C _ {B}} x 1 0 0 \tag {3} $$ ( )
0 % 100
0 B where: TOC0= initial total organic carbon in liquid effluent; TOC= total organic carbon in liquid effluent at the given instant; TOCB= total organic carbon in the pure water (blank).
Experimental Methods
A statistical technique was used in the experiment to optimize the process and to assess the effects, on the process for hydroquinone degradation (HD) and TOC conversion, of the following operating variables: the initial hydrogen ionic potential of the reaction medium (pH, set at values of 4, 7, and 10); the temperature of the liquid effluent (T, 60, 70, and 80 °C); the air flow rate (QAF, 50, 100, and 150 L h–1); and the molar stoichiometric ratio of hydroquinone to hydrogen peroxide ($R_{AP}$ 25%, 50%, and 75%). First, a $2^4$ factorial design was carried out for the classification order of the significant variables ($pH$, $T$, $Q_{AP}$, and $R_{ij}$). Second, the maximum ascending gradient method (MAGM) was used to determine the optimum point of the process for the same variables ($pH$, $T$, $Q_{AP}$, and $R_{ij}$). In this stage, the air flow rate was fixed at 50 L h$^{-1}$, and the temperature from the third assay was constant at 90 °C. Third, the kinetic model used to describe the profile of the mineralization of the hydroquinone concentration was the lumped kinetic model (LKM).
Statistical Techniques: According to Galdámez and Carpinetti [30] and Silva [31], the meaning of specific parameters for a data analysis is always relevant to good experimental planning. The control factors are the parameters that aim to evaluate the effects produced in the response variables.
In this first stage, the tests carried out to obtain the experimental complete factorial design with factorial $k$, $2^4$, included 16 runs and four repetitions at the central point, totaling 20 runs, with sample collection at times $t=0$, 45, 90, 135, and 180 min, in junction to optimization by means of the statistical analysis software package Statistic 8.0. The best conventional classification of the linear model was used for RSM in the experimental project [32, 33, 34].
In this second phase, the MAGM was applied to the region to determine the optimum point of the process for the same variables ($pH$, $T$, $Q_{AP}$, and $R_{ij}$). From the analysis of the complete factorial, the parameters for the calculation of $x_i$, $\Delta x_i$ and $\xi_i$ were obtained.
For application of the statistical calculation, variables $x_i$ and $\Delta x_i$ were estimated according to:
$$x_i = \frac{\xi_i - C_{\xi}}{(\Delta \xi)}$$
where: $x_i$ = variable $i$ encoded; $C_{\xi}$ = central point of the variable $\xi_i$; $\xi_i$ = level of the various $i$ uncoded; $\Delta \xi_i$ = difference between the maximum (or minimum) level and the central point of the uncoded variable $\xi_i$.
$$\dot{A}x_i = \frac{\dot{\beta}_i}{\dot{\beta}_j / \dot{A}x_j} \quad i = 1, 2, \ldots, k; \quad i \neq j$$
where: $\Delta x_i$ = increment (pitch size) of the coded variables $x_i$; $\dot{\beta}_j$ = regression coefficient in module of the generated model ($y = \beta_0 + \beta_1 x_1 + \ldots + \beta_k x_k + \varepsilon$) for TOC variable; $\dot{\beta}_j$ = higher regression coefficient in module of the generated model ($y = \beta_0 + \beta_1 x_1 + \ldots + \beta_k x_k + \varepsilon$) for TOC variable; $\Delta x_i$ = difference between the maximum (or minimum) level and the center point of the $x_j$ encoded variable.
In this third phase, kinetic modeling, based on the lumped (or grouped) kinetic model (LKM), was used for HQ oxidation.
**Kinetic Modeling**
In obtaining the kinetic model for the HQ oxidation, the lumped (or grouped) kinetic model (LKM) proposed by Li, et al. [35] was used for the total organic carbon (TOC) conversion response factor. Proposed scheme for hydroquinone oxidation in the parallel stages is given by Equation 6
$$\begin{align*} k_3 & = A \\ k_1 & = B \\ k_2 & = C \\ k_3 & = D \\ k_1 & = E \\ k_2 & = F \\ k_3 & = G \\ k_1 & = H \\ k_2 & = I \\ k_3 & = J \\ k_1 & = K \\ k_2 & = L \\ k_3 & = M \\ k_1 & = N \\ k_2 & = O \\ k_3 & = P \\ k_1 & = Q \\ k_2 & = R \\ k_3 & = S \\ k_1 & = T \\ k_2 & = U \\ k_3 & = V \\ k_1 & = W \\ k_2 & = X \\ k_3 & = Y \\ k_1 & = Z \\ \end{align*}$$
where: A–Initial contaminant (hydroquinone); B–Refractory organic species resulting from the oxidation of A; C–Carbon dioxide formed from the complete oxidation of species (complete mineralization, CO$_2$ and H$_2$O).
The mass balance for each group of species is given by Equation 7, 8 and 9
$$\frac{dC_A}{dt} = -(k_1 + k_3)C_A$$
$$\frac{dC_A}{dt} = -(k_1 + k_3)C_A$$
$$\frac{dC_A}{dt} = -(k_1 + k_3)C_A$$
where: $k_1$, $k_2$, and $k_3$ are the velocity constants of reactions from A to B, from B to C, and from A to C, respectively.
Grouped Kinetic Model (Lumped Kinetic Model–LKM):
Optimization methods are used to determine the best values of the variables that minimize or maximize an objective function.
The experimental constants $k_1$, $k_2$, and $k_3$ were determined by applying the LKM model (Equation 10) to the data obtained in the HQ optimization (mineralization at the optimum point) using the solver from Excel software.
$$\frac{TOC_{(i)}}{TOC_{(0)}} = \left( \frac{k_1}{k_1 - k_2 + k_3} \right) e^{-k_2 t} - \left( \frac{k_2 - k_3}{k_1 - k_2 + k_3} \right) e^{-(k_1 + k_3) t}$$
Results and Discussion
Stability Evaluation for Hydroquinone Mineralization
Table 1 shows the measures of the experimental assay to evaluate the hydroquinone mineralization, without the existence of an oxidant such as hydrogen peroxide (H2O2) and at the temperature of 70 °C. In this process, the TOC conversion was 1.2% after 180 min. This result shows that hydroquinone oxidation depends on other factors, such as the increment of an oxidant, the pH, and the temperature. The results obtained were analyzed using statistical software, with a significance level of 95% confidence.
| Time (min) | TOC (mg.L-1) | TOC (%) |
|---|---|---|
| 0 | 330.6 | 0 |
| 90 | 327.4 | 1 |
| 180 | 326.7 | 1.2 |
Table 1: Experimental results for TOC conversion in the nonexistence of an oxidant. Operational Parameters: pH= 7; T= 70 0C; QAR=
Table 1: Experimental results for TOC conversion in the nonexistence of an oxidant. Operational Parameters: pH= 7; T= 70 0C; QAR= 100 L h–1; RH= 0. Table 2 shows the experimental complete factorial 24. The HD and maximum TOC conversion achieved were 41.5% and 94.8%, respectively, for assay number 16, when the factors were used at their maximum levels.
| Tests | Time (min) | pH (-) | T (0C) | QAF (L.h-1) | R (%) H | TOC (%) | H (%) D |
|---|---|---|---|---|---|---|---|
| 1 | 180 | 4 | 60 | 50 | 25 | 4.17 | 37.55 |
| 2 | 180 | 10 | 60 | 50 | 25 | 3.48 | 32.36 |
| 3 | 180 | 4 | 80 | 50 | 25 | 12.2 | 51.25 |
| 4 | 180 | 10 | 80 | 50 | 25 | 25.84 | 83.21 |
| 5 | 180 | 4 | 60 | 150 | 25 | 2.19 | 16.95 |
| 6 | 180 | 10 | 60 | 150 | 25 | 1.09 | 37.66 |
| 7 | 180 | 4 | 80 | 150 | 25 | 18.97 | 56.92 |
| 8 | 180 | 10 | 80 | 150 | 25 | 21.27 | 59.17 |
| 9 | 180 | 4 | 60 | 50 | 75 | 3.44 | 13 |
| 10 | 180 | 10 | 60 | 50 | 75 | 5.37 | 40.32 |
| 11 | 180 | 4 | 80 | 50 | 75 | 31.61 | 72.49 |
| 12 | 180 | 10 | 80 | 50 | 75 | 30.11 | 76.19 |
| 13 | 180 | 4 | 60 | 150 | 75 | 4.08 | 35.56 |
| 14 | 180 | 10 | 60 | 150 | 75 | 6.27 | 28.12 |
| 15 | 180 | 4 | 80 | 150 | 75 | 30.09 | 75.22 |
| 16 | 180 | 10 | 80 | 150 | 75 | 41.45 | 94.83 |
| 17* | 180 | 7 | 70 | 100 | 50 | 10.4 | 45.6 |
| 18* | 180 | 7 | 70 | 100 | 50 | 9.67 | 39.26 |
| 19* | 180 | 7 | 70 | 100 | 50 | 12.2 | 42.3 |
| 20* | 180 | 7 | 70 | 100 | 50 | 8.94 | 36.03 |
Table 2: The experimental complete factorial 24. The reaction time (t) was 180 min.
*CP: Central Point Table 2: The experimental complete factorial 24. The reaction time (t) was 180 min.
Statistical Analysis of the TOC Conversion
Full factorial (24): Table 3 shows the variance analysis with the results obtained from the full factorial for the TOC conversion, containing the regression coefficient values, b1 (pH), b2 (T), b3 (QAF), b4 (RH), b12 (pH.T), b13 (pH.QAF), b14 (pH. RH), b23 (T.QAF), b24 (T.RH) and b34 (QAF.RH) the quadratic sum values, the degrees of freedom, the quadratic average, the F test, and the significance level p-values (p) of 0.19, 0.82, 0.98, 0.08, 0.09, and <0.05, respectively. This indicates that the linear coefficients (pH), (T), and (RH) as well as the coefficients (pH.T) and (T.RH) are all significant at the 95% confidence level (p-value <0.05). However, the linear coefficient (QAF) and the coefficient (pH.QAF), (pH.RH), (T.QAF) and (QAF.RH) are not significant at the 95% confidence level (p-value < 0.05) in the model.
- The determination coefficient (R2) and adjusted determination coefficient (R2
- Adj) values for the model were
- 94.04% and 87.42%, respectively, for four factors: one block,
- 20 runs, and a pure error of 1.957. The analysis of the data
- Experimental Complete Factorial, (24), Full Factorial
- (1) pH
- 49.424
- 1
- 49.424
- 25.25
- 0.0151
- (2) T
- 2058.052
- 1
- 2058.052
- 1051.441
- 0
- (3) QAF
- 5.286
- 1
- 5.286
- 2.7
- 0.1989
- (4) RH
- 249.843
- 1
- 249.843
- 127.643
- 0.0015
- 1 by 2
- 34.408
- 1
- 34.408
- 17.579
- 0.0247
- 1 by 3
- 0.12
- 1
- 0.12
- 0.061
- 0.8204
- 1 by 4
- 0.002
- 1
- 0.002
- 0.001
- 0.9782
- 2 by 3
- 13.787
- 1
- 13.787
- 7.044
- 0.0767
- 2 by 4
- 136.603
- 1
- 136.603
- 69.789
- 0.0036
- 3 by 4
- 11.455
- 1
- 11.455
- 5.852
- 0.0942
- Lack of Adjustment
- 156.35
- 6
- 26.058
- 13.313
- 0.0288
- Pure Error
- 5.872
- 3
- 1.957
- QS Total
- 2721.201
- 19
- QS= Quadratic Sum; DF= Degrees of Freedom; QA=Quadratic Average; F= F Test; p= p-value.
- R2= 0.94039; R2
- Adj= 0.87415.
- Experimental Complete Factorial, (24), Significant Terms
- (1) pH
- 49.424
- 1
- 49.424
- 25.25
- 0.0151
- (2) T
- 2058.052
- 1
- 2058.052
- 1051.441
- 0
- (4) RH
- 249.843
- 1
- 249.843
- 127.643
- 0.0015
- 1 by 2
- 34.408
- 1
- 34.408
- 17.579
- 0.0247
- 2 by 4
- 136.603
- 1
- 136.603
- 69.789
- 0.0036
- Lack of Adjustment
- 186.999
- 11
- 17
- 8.685
- 0.0506
- Pure Error
- 5.872
- 3
- 1.957
- QS Total
- 2721.201
- 19
- QS= Quadratic Sum; DF= Degrees of Freedom; QA=Quadratic Average; F= F Test; p= p-value.
- R2= 0.9290; R2
- Adj= 0.9080.
Table 3: Analysis of variance for TOC conversion.
Figure 2A shows that variation in the initial pH had little influence on the mineralization of HQ. However, a high temperature of the liquid effluent was more important in increasing the mineralization rates of the organic compounds analyzed. The TOC conversion increased (>35%) when the levels of these factors (pH and T) increased to T= 80ºC and pH>7, showing a positive interaction between these two variables for the mineralization of hydroquinone, with the temperature having the greatest effect. Figure 2B presents the highest hydroquinone mineralization with a TOC conversion (>35%) for pH and RH values at their maximum levels of >7 and 75%, respectively, while for their minimum levels, the mineralization exhibited the lowest values for TOC conversion (<20%). The variable RH had the greatest effect. Figure 2C shows the influence of the interaction between RH and T on hydroquinone mineralization. The highest mineralization values with a TOC conversion >35% occurred for the maximum levels of RH and T, 75% and 80 ºC, respectively. The action of the oxidant through the solution leads be related to the temperature of the system. Thus, variation in RH had a small effect on the mineralization of the compound at the lowest temperatures.
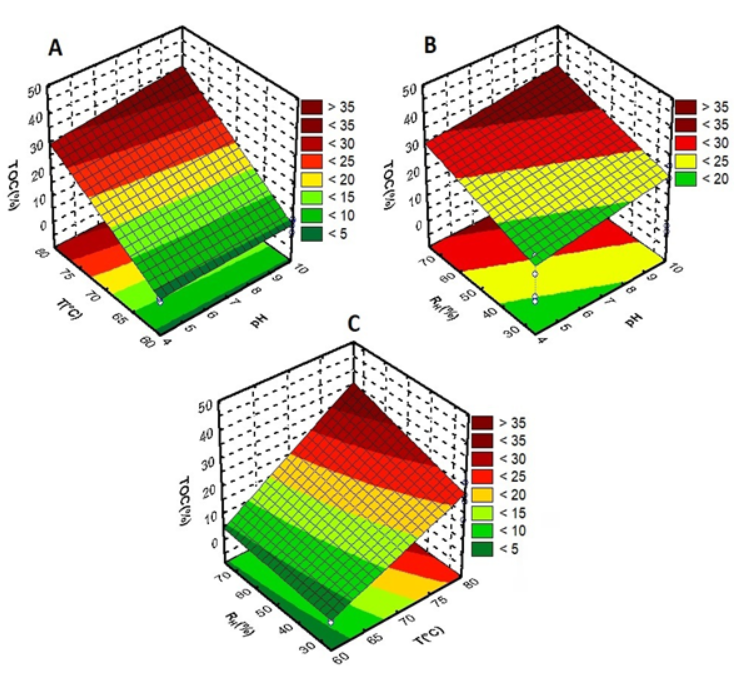
Figure 2: Response surface methodology for TOC conversion. A) T(0C) versus pH; B) RH(%) versus pH; C) RH(%) versus T(0C). Brandão, et al. [36] using the DiCTT technique to treat phenolic organic effluents reported the production of hydroquinone, catechol, and parabenzoquinone intermediates during the degradation and mineralization of phenol. These authors also related that the highest percentage mineralization was obtained using a large amount of free hydroxyl radicals (•OH) in the medium. According to studies by Oliveira, et al. [37], in the phenol oxidation stage, the appearance of secondary compounds in the form of organic acids and, in the subsequent stages, of aldehydes and alkenes, reduces intermediates during the phenol degradation reaction.
Statistical Analysis of Hydroquinone Degradation
Table 4 shows the variance analysis with the results obtained from the full factorial for the HD, containing the regression coefficient values, b1 (pH), b2 (T), b3 (QAF), b4 (RH), b12 (pH.T), b13 (pH.QAF), b14 (pH.RH), b23 (T.QAF), b24 (T.RH), and b34 (QAF.RH) the quadratic sum values, the degrees of freedom, the quadratic average, the F test, and the significance level p-values (p) of 0.91, 0.27, 0.26, 0.72, 0.66, and <0.05, respectively. This presents that the linear coefficients (pH), (T), and (RH) as well as the coefficients (T.RH) and (QAF.RH) are all significant at the 95% confidence level (p-value <0.05). However, the linear coefficient (QAF) and the coefficients (pH.T), (pH.QAF), (pH.RH), and (T.QAF) are not significant at the 95% confidence level (p-value <0.05) in the model. The determination coefficient (R2) and adjusted determination coefficient (R2 Adj) values for the model were 88.00% and 75.00%, respectively, for four factors: one block, 20 runs, and a pure error of 16.808.
- Experimental Complete Factorial, (24), Full Factorial
- QS
- DF
- QA
- F p
- (1) pH
- 539.731
- 1
- 539.731
- 32.111
- 0.0109
- (2) T
- 6713.698
- 1
- 6713.698
- 399.4282
- 0.0003
- (3) QAF
- 0.234
- 1
- 0.234
- 0.0139
- 0.9136
- (4) RH
- 230.133
- 1
- 230.133
- 13.6916
- 0.0343
- 1 by 2
- 30.612
- 1
- 30.612
- 1.8213
- 0.2699
- 1 by 3
- 32.135
- 1
- 32.135
- 1.9118
- 0.2607
- 1 by 4
- 2.659
- 1
- 2.659
- 0.1582
- 0.7174
- 2 by 3
- 3.925
- 1
- 3.925
- 0.2335
- 0.662
- 2 by 4
- 358.023
- 1
- 358.023
- 21.3004
- 0.0191
- 3 by 4
- 267.353
- 1
- 267.353
- 15.906
- 0.0282
- Lack of Adjustment
- 1060.709
- 6
- 176.785
- 10.5177
- 0.04
- Pure Error
- 50.425
- 3
- 16.808
- QS Total
- 9289.635
- 19
- QS= Quadratic Sum; DF= Degrees of Freedom; QA=Quadratic Average; F= F Test; p= p-value.
- R2= 0.8800; R2
- Adj= 0.7500.
- Experimental complete factorial, (24), Significant Terms
- QS
- DF
- QA
- F p
- (1) pH
- 539.731
- 1
- 539.731
- 32.111
- 0.0109
- (2) T
- 6713.698
- 1
- 6713.698
- 399.4282
- 0.0003
- (4) RH
- 230.133
- 1
- 230.133
- 13.6916
- 0.0343
- 2 by 4
- 358.023
- 1
- 358.023
- 21.3004
- 0.0191
- 3 by 4
- 267.353
- 1
- 267.353
- 15.906
- 0.0282
- Lack of Adjustment
- 1130.273
- 11
- 102.752
- 6.1132
- 0.0813
- Pure Error
- 50.425
- 3
- 16.808
- QS Total
- 9289.635
- 19
- QS= Quadratic Sum; DF= Degrees of Freedom; QA=Quadratic Average; F= F Test; p= p-value.
- R2= 0.8700; R2
- Adj= 0.8300.
Table 4: Analysis of variance for the hydroquinone degradation.
Table 4 also shows the variance analysis with the results obtained from the full factorial, with the significant terms for the HD, containing the regression coefficient values, b1 (pH), b2 (T), b4(RH), b24 (T.RH) and b34 (QAF.RH), the quadratic sum values, the degrees of freedom, the quadratic average, the F test (F), in addition the significance level p-values (p) <0.05 for all effects. Thus, the linear coefficients (pH), (T), and (RH), moreover the coefficients (T.RH) and (QAF.RH) are all significant at the 95% confidence level (p-value <0.05). However, the linear coefficient (QAF) and the coefficients (pH.T), (pH.QAF), (pH.RH) and (T.QAF) are not significant at the 95% confidence level (p-value <0.05) by the model. The analysis of the data through analysis of variance (ANOVA) for the significant factors is also presented in Table 4. The determination coefficient (R2) and adjusted determination coefficient (R2 Adj) values for the model were 87.00% and 83.00%, respectively.
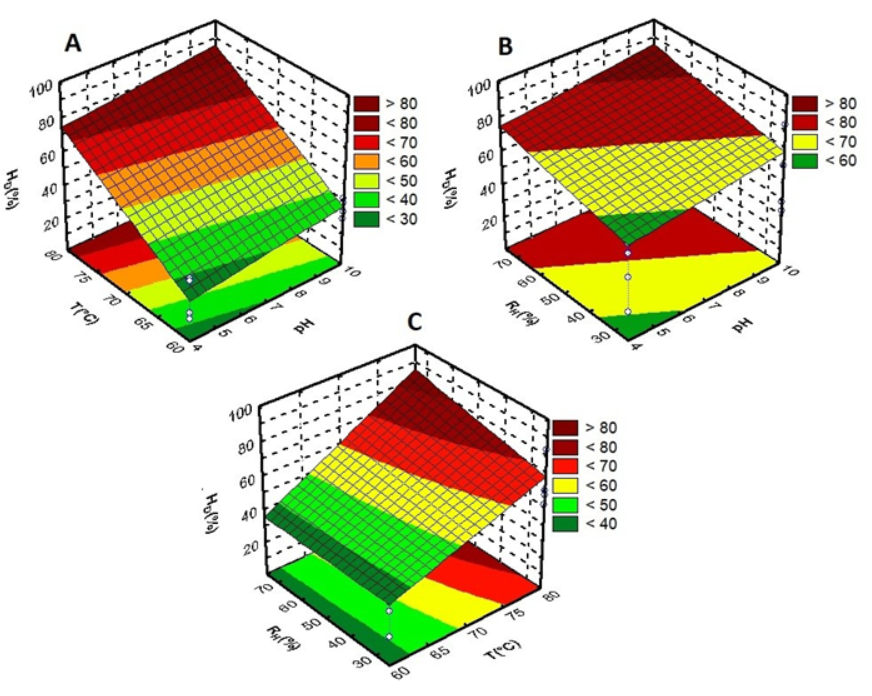
The mathematical model and adjustments to the results were analyzed. The utilization of RSM wtih nonlinear regression offers parameter approximation for HD. The empirical relationship between HD and the significant independent variables studied for the model was determined using Equation (12) HD (%) = 48.42 + 5.87 pH + 20.42 T + 3.86 RH + 4.79 T.RH (12) To analyze the mathematical model, adjustments to the measures were distributed to obtain the RSM for HD as a function of the main variables that were significant. Figure 3A, 3B, and 3C show the RSM results from the simulated data by statistical analysis of HD. Figure 3A indicates that the variation in the initial pH had little influence on HD. However, a high temperature of the liquid effluent had a greater influence on the increase in the degradation indexes of the organic compound studied. The hydroquinone degradation was greater than 80% when the levels of these factors (pH and T) increased to a T above 80ºC and a pH greater than 10, showing a positive interaction effect between these two variables and HD, with the temperature having the greatest effect. Thus, these results show that, with an increase in the initial pH of the reaction medium, hydroquinone reacts very quickly with molecular oxygen (self-oxidation in alkaline pH) to produce quinones, producing a reddish-brown solution. Figure 3B shows the highest HD (>80%) for pH and RH values at maximum proportion of 10 and 75%, respectively, while for low values, the levels of degradation were lowest (<60%). The pH had the greatest effect. Figure 3C shows the influence of the interaction between RH and T for HD that occurs at the maximum levels of 75% and 80 ºC, respectively. The strong relationship between these increases in the degradation of toxic organic compounds was above 80%. However, variation in RH had a small effect on HD (<40%) at the lowest temperature. Brandão, et al. [21] studied the level of phenol oxidation using a new technique called direct contact thermal treatment (DiCTT), which is characterized by the formation of hydroxyl radicals (•OH) and is considered to be an unconventional AOP. In the range studied, variation in the effluent flow allowed to obtain a phenol degradation of almost 100%, which was achieved in 180 min.
When present in aqueous media, hydroquinone can react easily in response to the conformation of metal ions, the oxygen concentration, and the pH of the liquid phase. Thus, the proportion of oxidation of HQ increased at higher pH results. Hydroquinone also has higher stability in acid media from pH 4.5 to 5.0 [38]. The ionization state of hydroquinone is affected by the pH of the solution, even in aqueous solutions and without the free electrons. Hydroquinone is oxidized by a variety of oxidizing agents, including nitric acid, persulfates, some metal cations, and molecular oxygen, reacting with these compounds in alkaline solutions [39, 40]. According to data in the literature, the percentage of self-oxidation of hydroquinone depends on the pH, and occurs very slowly at acidic pH but very quickly at alkaline pH [40]. The quantity of quinone, an intermediate product of the reactions during HD, accelerates the oxidation of this organic compound by catalysis. Quinone reacts with the hydroquinone dianion to form an unstable radical (semiquinone), which then reacts quickly and spontaneously with oxygen, forming two molecules of quinone and hydrogen peroxide, or a stable dimer. Proportionally with hydroquinone oxidation and subsequent benzoquinone formation, a darkening of the color of the solution occurs during the reaction [41, 42]. The average results of the data obtained from the analytical results for HD and the possible subsequent benzoquinone formation are represented by Equation (13) [43, 44, 45].
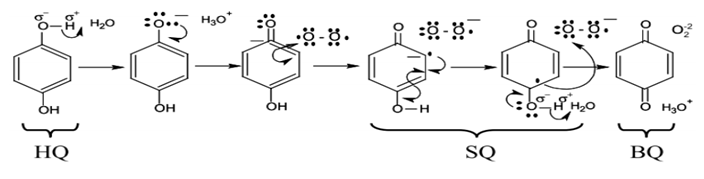
where: HQ= hydroquinone; SQ= semiquinone; BQ= benzoquinone.
Maximum Ascending Gradient Method
The mineralization of the toxic effluent at this stage of the research became the considerable factor of the study, observing that the HD reached values of approximately 95% (assay 16, Table 2), while for mineralization, the highest value achieved was approximately 42%. The model generated for TOC conversion (Equation 11) was used to implement the MAGM (Table 5). Thus, the air flow rate (QAF) was fixed at 50 L h–1 because this variable was not significant for either mineralization or degradation of the synthetic HQ effluent.
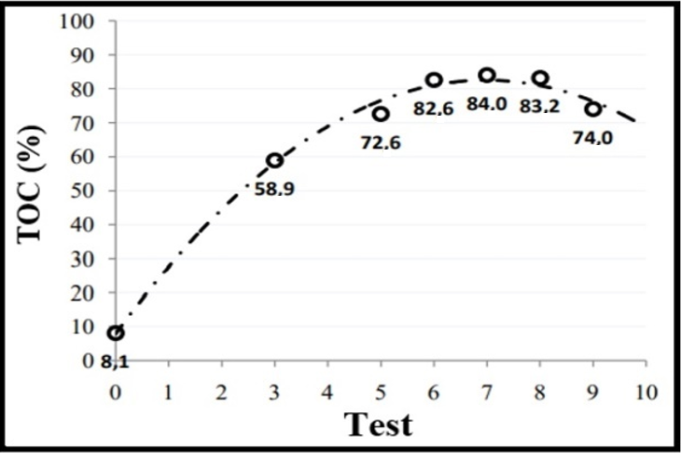
Table 5 shows that the effluent temperature was kept constant at 90ºC from the third test of the MAGM to minimize the results of evaporation in the analyzed solution. The experiments were carried out from assay 4, since the tests performed in previous stages showed small variations in the levels HD and TOC conversion. At this stage, the TOC conversion value increased, then reached a region of approximately constant values (assays 7 to 9), followed shortly afterwards by a reduction in these values. Thus, the analysis of these results showed that there is possibly a point where the replacement of organic carbon is maximum around this region (assays 6 to 10).
| Test | Increment | x 1 | x 2 | x 4 | pH(-) | T(0C) | R (%) H | TOC (%) | H (%) D |
|---|---|---|---|---|---|---|---|---|---|
| 1 | Cxi | 0 | 0 | 0 | 7 | 70 | 50 | 8.1 | 38.2 |
| 2 | Cxi + ∆xi | 0.16 | 1 | 0.35 | 7.5 | 80 | 59 | - | - |
| 3 | Cxi + 2∆xi | 0.31 | 2 | 0.7 | 7.9 | 90 | 67 | - | - |
| 4 | Cxi + 3∆xi | 0.47 | 3 | 1.04 | 8.4 | 90 | 76 | 58.9 | 94.9 |
| 5 | Cxi + 4∆xi | 0.62 | 4 | 1.39 | 8.9 | 90 | 85 | - | - |
| 6 | Cxi + 5∆xi | 0.78 | 5 | 1.74 | 9.3 | 90 | 94 | 72.6 | 98.8 |
| 7 | Cxi + 6∆xi | 0.93 | 6 | 2.09 | 9.8 | 90 | 102 | 82.6 | 100 |
| 8 | Cxi + 7∆xi | 1.09 | 7 | 2.44 | 10.3 | 90 | 111 | 84 | 100 |
| 9 | Cxi + 8∆xi | 1.24 | 8 | 2.79 | 10.7 | 90 | 120 | 83.2 | 100 |
| 10 | Cxi + 9∆xi | 1.4 | 9 | 3.13 | 11.2 | 90 | 128 | 74 | 100 |
| 11 | Cxi +10∆xi | 1.55 | 10 | 3.48 | 11.5 | 90 | 137 | - | - |
Table 5: ** Test of the MAGM.
QAF = 50 L h-1; Cxi – Central point of the coded variable xi Table 5: Test of the MAGM.
The increase in TOC conversion in trials 6 to 9 was possibly due to an increase in the products of oxidation of HQ at higher pH values. The continuation of the pH increase of the initial solution from test 9 shifts the balance of the reaction in the direction of para-benzoquinone formation. HD during the adjustment of the initial pH in the liquid phase was verified by the darkening of the model effluent (red-brown color). HD of approximately 100% was obtained from assay 6 (Table 5). The quinone percentage, a secondary product of the reactions leading to HD, accelerates the oxidation of this organic compound by catalysis. Quinone reacts with the hydroquinone dianion to generate a semiquinone, which then reacts with oxygen to form benzoquinone and subsequently organic acids, thus decreasing the extent of TOC conversion [42]. The products of the oxidation of hydroquinone are possibly aldehydes (glyoxal) and alkenes (1,4-dioxo-2- butene) [21, 46].
Figure 4 shows the region that probably represents the results for maximal TOC conversion, which is more easily observed through the formation of a maximum point. This shows the excellent efficiency of the method for obtaining the best optimized process conditions, allowing an increase in hydroquinone mineralization by a factor of 2.
Kinetics of Hydroquinone Mineralization
The experimental results achieved for TOC conversion (Table 6) at the optimal point was used to obtain an approach of the coupled kinetic models to predict the kinetic parameters, which govern the mineralization reaction of hydroquinone. The Lumped Kinetic Model (LKM) proposed by Li, et al. [35] was used to determine the specific velocities (ki) under the experimental operating conditions for the hydroquinone oxidation reaction (pH= 9.3, T= 90°C, RH= 110%, QAF= 50 L h‒1).
| Time (min) | TOC (mg L⁻¹) | TOC (%) |
|---|---|---|
| 0 | 323.12 | 0 |
| 20 | 307.76 | 4.8 |
| 40 | 236.92 | 26.7 |
| 60 | 185.88 | 42.5 |
| 80 | 143.16 | 55.8 |
| 100 | 98.16 | 69.7 |
| 120 | 89.38 | 72.3 |
| 140 | 77.36 | 76.2 |
| 160 | 67.92 | 79.1 |
| 180 | 64.52 | 80.1 |
Table 6: Hydroquinone Oxidation Reactions with TOC conversion. Operational parameter: RH= 110%, pH= 9.3, T=900C, QAF= 50 L h‒1.
Table 7 shows the values obtained for the speed constants (specific speed). Thus, nonlinear regressions were performed with the data in Table 6, from Equation 9 (presented in item 2.6), using the solver of the excel software (version 8.0).
| Operational Parameter | Speed Constants |
|---|---|
| k1 | 0.076 |
| k2 | 0.012 |
| k3 | 0 |
Table 7: Values obtained of the speed constants for the hydroquinone reaction.
Table 7 shows that the value of the velocity constant, k3, was zero. Therefore, it was possible to observe that the direct mineralization of hydroquinone does not occur for the range used in this stage. Thus, all hydroquinone was converted into organic intermediates until mineralization into carbon dioxide and water.
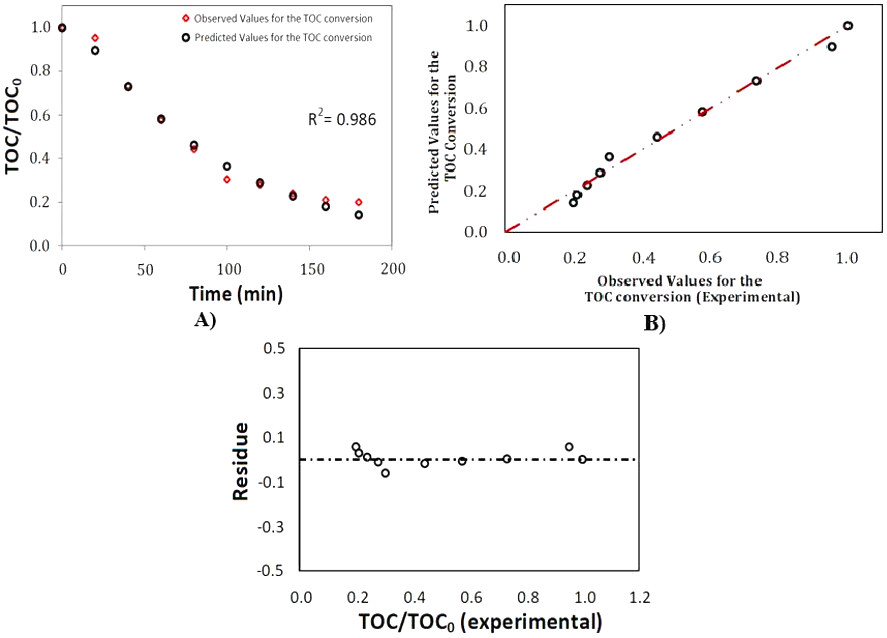
Figure 5A shows the results obtained by the model versus the experimental data, respectively, for the TOC conversion. Thus, it was possible to observe a good fit in the model data, obtaining a coefficient of determination of 0.986. Figure 5B shows the predicted values obtained by the model versus the observed values (experimental) at the optimal point for the TOC conversion. Again, a good fit was observed between the experimental results and the data of the proposed model. Figure 5C shows that, through the residuals graph, a good fit between the experimental results and the model data can also be observed. In this, the variation around the mean shows an adequacy of the mathematical model in relation to the experimental results for the TOC conversion, that is, the kinetic model adjusted to the experimental data, with a coefficient of determination of 0.986 from the model for the reaction process.
Conclusions
The results obtained during this research showed that the relevant factors for the two response variables, HD and TOC conversion, were the T, pH and RH. At this stage, the HD was approximately 100%; however, the TOC conversion did not exceed 42%. Thus, the MAGM was used, and the TOC conversion values increased. Hence, when HD of approximately 100% was obtained, a maximum percentage of TOC conversion of approximately 84% was achieved after the application of MAGM, showing the excellent efficiency of the method. The kinetic model used to describe the profile of the TOC conversion for the HQ was the lumped kinetic model (LKM). Thus, the model was achieved after the experimental data obtained at the optimal point and it showed that the direct hydroquinone mineralization does not occur (k3= 0), that is, the formation of CO2 and H2O occurs before the production of intermediates. Thus, the results achieved in this research showed greater hydroquinone degradation (almost 100%), a higher TOC conversion (>80%), at the same reaction time (t) (180 min), with the most important operating variables for the process (pH= 9.3, T= 90 °C, RH= 110% and QAR= 50L h-1).
Acknowledgements
The authors wish to express thanks to the Studies for the National Council for Scientific and Technological Development˗CNPq for awarding research grants. The authors also would like to thank Editage (www.editage.com) for English language editing.
Conflict of Interest Statement
On behalf of all authors, the corresponding author states that there is no conflict of interest.
References
-
Onesios Barry KM, Berry D, Proescher JB, Ashok Sivakumar IK, Bouwer EK (2014) Removal of pharmaceuticals and personal care products during water recycling microbial community structure and effects of substrate concentration. Appl Environ Microbiol 80(8): 2440-2450.
-
Wang YG, Wang XU, Mingwei LI, Dong J, Sun C (2018) Removal of pharmaceutical and personal care products (PPCPs) from municipal waste water with integrated membrane systems MBR-RO/NF. Int J Environ Res Public Health 15(2): 269.
-
Alemagi D (2007) The oil industry along the Atlantic coast of Cameroon Assessing impacts and possible solutions. Resources Policy 32(3): 135˗145.
-
Gower S, Hicks J, Shortreed J, Craig L, Mccoll S (2008) Development of a health effects based priority ranking system for air emissions reductions from oil refineries in Canada. J Toxicol Environ Health A 71(1): 81˗85.
-
Carvalho MN, Motta M, Benachour M, Sales DCS, Abreu CAM (2012) Evaluation of BTEX and Phenol Removal from Aqueous Solution by Multi Solute Adsorption Onto Smectite Organoclay. J Hazard Mater 239(240): 95-101.
-
Oller I, Malato S, Sánchez Pérez JA (2011) Combination of Advanced Oxidation Processes and biological treatments for waste water decontamination A review. Sci Total Environ 409(20): 4141-4166.
-
Panico A, Basco A, Lanzano G, Pirozzi F, Santucci de Magistris F (2017) Evaluating the structural priorities for the seismic vulnerability of civilian and industrial wastewater treatment plants. Saf Sci 97: 51–57.
-
Mukherjee M, Goswami S, Banerjee P, Sengupta S, Das P (2019) Ultrasonic assisted graphene oxide nanosheet for the removal of phenol containing solution. Environ Technol Innovation 13: 398-407.
-
Farah MA, petróleo O (2012) Processamento de Petróleo e Gás Petróleo e seus Derivados Processamento Primário Processos de Refino Petroquímica LTC Rio de Janeiro.
-
Fedorov K, Plata Gryl M, Khan JA, Boczkaj G (2020) Ultrasound assisted heterogeneous activation of persulfate and peroxymonosulfate by asphaltenes for the degradation of BTEX in water. J Hazard Mater 397(5): 122804.
-
CONAMA (2011) Ministério do Meio Ambiente. Resolução n0 430, de 13 de maio de 2011 Conselho Nacional de Meio Ambiente (CONAMA) Brasília DF.
-
Kumar G, Sivagurunathan P, Park JH, Kim SH (2015) Anaerobic digestion of food waste to methane at various organic loading rates olrs and hydraulic retention times hrts thermophilic vs mesophilic regimes. Environ Eng Res 21(1): 69˗73.
-
Ghosh S, Dairkee UK, Chowdhury R, Bhattacharya P (2017) Hydrogen from food processing wastes via photofermentation using Purple Non-sulfur Bacteria PNSB A review. Energy Convers Manag 141(1): 299˗314.
-
Garcia Becerra FY, Ortiz I (2018) Biodegradation of emerging organic micropollutants in nonconvencional biological wastewater treatment A critical review. Environ Eng Sci 35(10): 1012˗1036.
-
Kessy HNE, Wang K, Zhao L, Zhou M, Hu Z (2018) Enrichment and biotransformation of phenolic compounds from litchi pericarps with angiotensin I converting enzyme ACE inhibition activity. LWT 87: 301˗309.
-
Silva MR, Coelho MAZ, Araújo OQF (2018) Minimization of phenol and amoniacal nitrogen in refinery wastewater employing biological treatment. Eng Term: 33˗37.
-
Yang L, Si B, Martins MA, Watson J, Chu H (2018) Improve the biodegradability of post hydrothermal liquefaction wastewater with ozone conversion of phenols and N-heterocyclic compounds. Water Sci Technol 2017(1): 248-255.
-
Agrawal PK, Shrivastava R, Verma J (2019) Bioremediation approaches for degradation and detoxification of polycyclic aromatic hydrocarbons. In: Bharagava RN, et al. (Eds), Emerging and Eco-Friendly Approaches for Waste Management. Springer, Singapore, pp: 56-76.
-
Li Y, Liao X, Huling SG, Xue T, Liu Q (2019) The combined effects of surfactant solubilization and chemical oxidation on the removal of polycyclic aromatic hydrocarbon from soil. Sci Total Environ 647: 1106˗1112.
-
Brandão Y, Teodosio J, Benachour M, Oliveira J, Marinho I (2010) Study of the effect of excess air and the dissipated power of the burner on the capacities of the DiCTT process in the treatment of liquid phenolic effluents. Rev Iberoam Sist Cib Inf 7(2): 1–9.
-
Brandao YB, Oliveira JGC, Benachour M (2017) Phenolic Wastewaters: Definition, Sources and Treatment Processes. In: Hernandez MS, et al. (Eds.), Phenolic Compounds. Intech open, Rijeka, Croatia, pp: 456.
-
Kestioglu K, Yonar T, Azbar N (2005) Feasibility of physico-chemical treatment and Advanced Oxidation Processes (AOPs) as a means of pretreatment of olive mill effluent (OME). Proces Biochem 40(7): 2409-2416.
-
Karageorgos P, Coz A, Charalabaki M, Kalogerakis N, Xekoukoulotakis NP, et al. (2006) Ozonation of weathered olive mill wastewaters. J Chem Technol Biotechnol 81(9): 1570-1576.
-
Justino C, Marques AG, Duarte KR, Duarte AC, Pereira R, et al. (2010) Degradation of phenols in olive oil mill wastewater by biological, enzymatic, and photo-Fenton oxidation. Environ Sci Pollut Res 17(3): 650-656.
-
Jimenez S, Andreozzi M, Mico MM, Alvarez MG, Contreras S (2019) Produced water treatment by advanced oxidation processes. Sci Total Environ 666: 12˗21.
-
Paiva EJD (2008) Optimization of manufacturing processes with multiple responses based on capability indices. Masters Dissertation, University Federal of Itajuba, Brazil.
-
Kim Z, Shin Y, Yu J, Kim G, Hwang S (2019) Development of NOx removal process for LNG evaporation system: Comparative assessment between response surface methodology (RSM) and artificial neural network (ANN). J Ind Eng Chem 74: 136-147.
-
Brandao YB, Fernando FSD, Oliveira DC, Zaidan LEMC, Teodosio JR, et al. (2021) Unconventional advanced oxidation technique: Evaporation liquid rate and phenolic compounds degradation evaluation and modelling/optimization process with CFD, RSM and ANNs. Fuel 300: 120967.
-
Kasiri MB, Aleboyeh H, Aleboyeh A (2008) Modeling and optimization of heterogeneous photo-fenton process with response surface methodology and artificial neural networks. Environ Sci Technol 42(21): 7970-7975.
-
Galdamez EVC, Carpinetti LCR (2004) Application of planning techniques and analysis of experiments in the plastic injection process. Gest Prod 11(1): 121˗134.
-
JGCD Silva (2007) Experimental Statistics: Design of Experiments. Pelotas, Rio Grande do Sul.
-
Myers RH, Montgomery DC, Cook CMA (2002) Response Surface Methodology: Process and Product Optimization Using Designed Experiments. 4th(Edn.) John Wiley and Sons, New York, pp: 856.
-
Chaves ATCA (2008) Optimization of the ethyl biodiesel process from sunflower oil (Hellianthus annus) applying a rotational central composite design (DCCR). Masters Dissertation, University Federal of Joao Pessoa, Paraiba, Brazil.
-
Rodrigues MI, Lemma AF (2009) Design of experiments and process optimization. Casa do Espirito Amigo Fraternidade Fe e Amor, Campinas, Sao Paulo.
-
Li L, Chen P, Gloyna EF (1991) Generalised kinetic model for wet oxidation of organic compounds. AIChE J 37(11): 1687-1697.
-
Brandao Y, Teodosio J, Dias F, Eustaquio W, Benachour M (2013) Treatment of phenolic effluents by a thermochemical oxidation process (DiCTT) and modelling by artificial neural networks. Fuel 110: 185- 195.
-
Oliveira JGC (2009) Theoretical-computational study via CFD and experimental of the combustion of natural gas for the treatment of liquid organic effluents applying the new DICTT technology. Masters Dissertation, Federal University of Pernambuco, Recife, Brazil.
-
VM Souza (2003) Dermatological Actives. 1st(Edn.), Tecnopress, Sao Paulo.
-
Taken RL, Lewis J (1993) Registry of Toxic Effects of Chemical Substances. National Institute for Occupational Safety and Health, Ohio, Columbus.
-
IPCS (1996) Hydroquinone Health and Safety Guide. International Programme on Chemical Safety, World Health Organization, Geneva, Switzerland.
-
Engasser PG, Maibach HI (1981) Cosmetics and dermatology: Bleaching creams. J Am Acad Dermatol 5(2): 143˗147.
-
Connors KA, Amidon GL, Stella VJ (1986) Chemical stability of pharmaceuticals: a handbook for pharmacists. 2nd(Edn.), John Wiley, New York, pp: 864.
-
Morrison RT, Thornton R (1995) Organic chemistry. 13th(Edn.), Calouste Gulbenkian Foundation, Lisba, Portugal, pp: 1510.
-
Fessenden RJ, Fessenden JS, Logue MW (1998) Organic Chemistry. 6th(Edn.), Brooks/Cole Publishing, Pacific Groove, USA.
-
Smith MB, March J (2001) March‟s Advanced Organic Chemistry. 5th(Edn.), John Wiley & Sons, New York, pp: 2083.
-
Devlin HR, Harris IJ (1984) Mechanism of the oxidation of aqueous phenol with dissolved oxygen. Ind Eng Chem Fundam 23(4): 387-392.
- Nigeria’s Vulnerability in the Face of Global Energy Policy
- A Simulation Study of Investigation of Optimum Oil Production Performance by Applying Various Gas Injection Methods in Oil Reservoir
- Characterization of Permo-Triassic Reservoirs through Thermal Maturity Assessment of Westphalian Source Rocks in the Cheshire Basin
- Influence of Microwax on the Rheological and Thermal Behaviour of a Wax Crude Oil
- Real-Time Monitoring and Performance Optimization of Steam Injection in Heavy Oil Reservoirs Using Fiber Optic Sensing and Integrated Predictive Simulation Models
- Rapid On-Site Determination of the Total Petroleum Hydrocarbon Content of Soils by Handheld Fourier Transform Near-Infrared Spectroscopy: Development of a Global, Site- and Scanner- Independent Calibration Model