Bioelectricity Generation by Single Chamber Microbial Fuel Cell by Using Platinum Catalyst as Electrode
In this study, a wet proof multiple air cathode microbial fuel cell that generates bioelectricity by biodegradation of organic matter was fabricated. In this, platinum coated (0.5 mg/cm2) carbon cloth was used as air cathode and graphite rod was used as anode. The maximum power produced by MFC was 1.65042, 0.66951, 0.425061 mW on the 2nd day of operation with 1K, 3K, 5K ohm external resistance respectively. The maximum open circuit voltage and current given by MFC was 1.557 mV and 1.06 mA respectively incorporated with 1 K ohm external resistance. It was seen that open circuit voltage (OCV) initially increases with time due to increase in microbial activity but after that there is drop in voltage possibly due to decline of available substrate for microbial population. Maximum bacterial count of 90 ×105 CFU was observed on the 3rd day of operation.
Introduction
As we head into the future, large portion of energy produced and used in the world will be from sustainable sources due to the world’s limited supply of fossil fuels and their impact on environmental and economic changes. Microbial Fuel Cell (MFC) technology generates either electricity or hydrogen from bacterial growth in carbon- containing solutions [1], including sources of low or negative economic value such as wastewater. When configured for the production of electricity [2, 3, 4], an MFC is similar to a hydrogen fuel cell in design, but uses bacteria instead of hydrogen to create electricity and can simultaneously treat wastewater as well. Currently most MFC research focuses on increasing the power density of the system based on the projected surface area of electrodes and/or the reactor volume, while little research has been done on determining the effects of varying fuel cell components and the parameters of MFC construction on the voltage output.
The electrons produced by the bacteria by oxidizing these substrate (most commonly glucose or acetate) are transferred to the anode and flow towards cathode by external conducting circuit, containing a resistor or any other load (e.g. LED, light). According to the convention of MFCs anode is treated as negative terminal while cathode as positive terminal so the positive current will flow from positive to negative terminal in the opposite direction of flow of electrons. Electrons resulting of bacteria metabolism can be transferred to anode by different ways, according to this transfer mechanism MFCs can be divided into two categories: Mediator – MFCs, in these MFCs electrons can be transferred to anode by means of some chemical called mediators or shuttles [5, 6]. These mediators, contains neutral red or anthraquinone – 2,6 –disulfide (AQDS), added to the anode chamber of MFCs system to allow the passage of electrons from bacterial cell wall to the anode for those bacteria which are unable to transferred electron direct on anode [7, 8]. These mediator chemicals are toxic and expensive and also produced very less amount of electricity that is why mediator – MFCs has been obsolete. There are other ways of transferring electrons by bacteria to anode such as direct bacterial cell membrane associated transfer [9], or by so – called nano wires attached to the bacteria [10, 11, 12] if there is no exogenous chemical is used in the system, the MFC is known as; Mediator - less MFC even though the mechanism of electron transfer is unknown [13].
Ferrricyanide is often used in MFC research when cathode effects are not of interest to the researcher, since it has a very high potential and makes for an excellent cathode reagent, with little or no limitation to the system. This allows researchers to investigate the effects of only the anode compartment. The problem with ferrricyanide is that it is not a cost effective way to run an MFC and can potentially leak across to the anodic side of the cell. It is a toxic compound, and can have a detrimental impact on the anodic cultures. Furthermore, the spent ferrricyanide must be disposed of, which leads to waste and a potential hazard for people coming in contact with it [14, 15].
Beside of using any chemical oxidizer, air (oxygen) or any precious metal (example, Pt, Mg etc.) for reducing electrons at cathode, in recent MFCs have been developed which can use bio– cathodes, which provide dissolved oxygen in catholyte and this oxygen used as terminal electron acceptor at the cathode [16]. For example in making of low-cost microbial fuel cell blue green algae-assisted cathode is used as a replacement for chemical oxidant [17].
Single chamber MFC is the simplest type of MFC. like most MFCs, single chamber MFC also follow the same working principal, but instead of using any chemical, mechanical or biological means for reducing electrons that produced at anode, it uses simple air as the terminal electron accepter (oxygen in air is responsible for this action), the reason of using air is clear, because cost of purifying oxygen is much greater, also it produces no harmful effect in the environment and readily available. The cathode is usually coated with Pt catalyst [18, 19].
The system in air cathode MFCs does not always contain a PEM. In hydrogen fuel cells, since both anodic and cathodic reagents are gaseous, a physical barrier is necessary to prevent anodic and cathodic contents from mixing and create the potential difference across the cell. The PEM is used as this separator, though any material that allowed for ionic conductivity for the internal circuit can be used. For example, in alkaline fuel cells, a caustic solution is used as the electrolyte between the two electrodes, and the mobile ion is hydroxide. The net reaction is the same, but water is evolved on the anode side. In air cathode MFCs, the culture medium between the anode and cathode can serve as an electrolyte and the PEM can be removed entirely. The advantage of this is a pronounced reduction in internal cell resistance to ionic transfer, as protons move far more readily through culture medium than through the PEM (typically Nafion, a sulfonated tetrafluoroethylene based polymer); however this leads to increased oxygen diffusion into the system [20, 21].
Research on MFC cathodes has been increasing in recent years. With the use of graphite brushes and other such high surface area materials, the anode is no longer a limiting factor for power production. The cathode possesses the biggest challenges in design and materials because electrons, protons, and oxygen must all be transported to the area and react with a catalyst. An effective cathode must be constructed from conductive material containing a catalyst and be in contact with the anode substrate and air. Generally Pt catalyst is used for MFC system in which oxygen is dissolved in catholyte [22] or in open air type single chamber MFC system in which gas diffusion takes place at cathode [23, 24].
Two of the most commonly used cathode materials are carbon paper or carbon cloth. When used in a single chamber MFC, these materials will be wet-proofed due to the architecture of the system. The carbon paper and cloth can be purchased with a Platinum (Pt) catalyst already applied to the surface or this can be done in the laboratory by the researcher. A paste is created by combining a chemical binder, such as 5% Nafion liquid solution and a Pt/carbon powder product and is then applied to the material being utilized as the cathode [25]. Research has indicated that this ‘homemade’ cathode, using the Pt/carbon/Nafion paste, increased power by 68% over a system using a purchased cathode with catalyst [24]. The use of platinum at the cathode of MFCs increases the cost of this technology. Cobalt tetramethoxy phenylporphyrin (CoTMPP) has been found to be a cheaper alternative to platinum as a catalyst on the cathode. The maximum power produced using CoTMPP was only 12% less than the power produced using a high Pt loading of 0.5 mg/cm². This same study found that Pt loadings can be reduced to 0.1 mg/cm² with only a 19% reduction in power production. Using CoTMPP or reducing the amount of platinum catalyst at the cathode can be cost saving options for MFCs with minimum reductions in power production [26].
Material and Methods
The materials which have been used in fabrication of the MFC are a single chamber of perspex glass sheet, in which electrode are fixed with screw (made by precision equipment, Naria, Varanasi), four (7 x 5 cm) piece of platinum coated carbon cloth, for cathode, four cylindrical Graphite rods for anode, anaerobic sludge (wastewater treatment plant, Bhagwanpur, Varanasi). Glucose used as a substrate, variable resistors 1 to 10 kilo ohms, digital multimeter, for voltage and current measurement (Excel DT-9205B), Sealing material (fevi quick), Tap water, Gloves, electronic balance for measuring weight, mechanical Stirrer and hot temperature bath.
Anode and Cathode Chamber
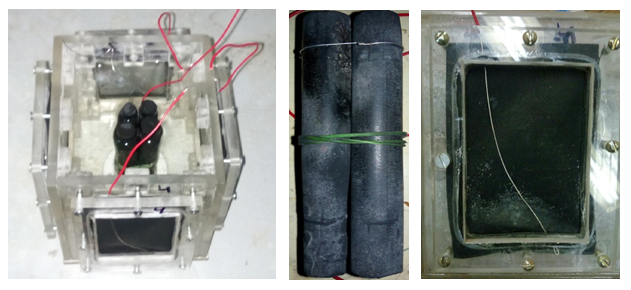
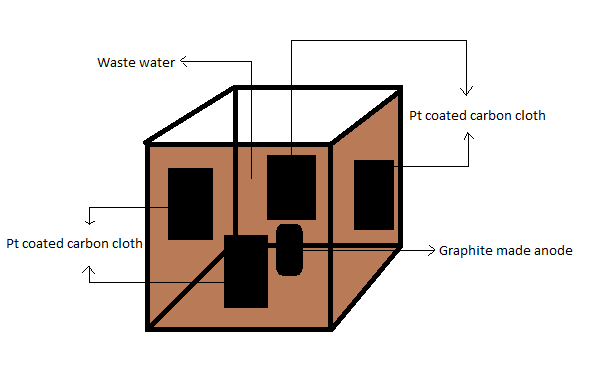
No separate chamber was there for electrodes; both anode and cathode were in the same chamber. A cubical chamber (9 cm × 9 cm × 11 cm) was fabricated using Perspex sheet. An opening of (7×5 cm) were made on four vertical walls of the MFC setup for screwing of platinum coated cathode with the help of gasket for avoiding any leakage. Also while designing the anode chamber; the distance between two electrodes was kept as minimum as possible to keep internal resistance low. The anode electrode was placed in the middle of the anode chamber and four cathode electrodes were screwed on the four walls of the MFC setup. And for taking sample and feeding substrate at time to time, a septum was fixed on the top surface of the anode chamber, which was helpful in keeping anaerobic conditions in anode chamber. Substrate can be feed by a syringe into the anode chamber. Cell was operated in a fed- batch mode. The design details of cell are as follows and shown in Figure 1.
Electrodes
Four cylindrical graphite rods were jointed together for making of anode electrode. Four anodes were joined for increasing the surface area for getting more power from the MFC. Cathodes were made of platinum coated (0.5 mg/cm2) wet proof carbon cloth. Cathode were fixed in the setup by cutting four walls of the setup with the help of gasket for avoiding any leakage and all of them are then connected in series for increasing the surface area and hence increasing power. Figure 7 shows the photographs of anode and cathode used in the cell. The design details of electrodes are given below.
| Material of anode: Graphite rod | Material of cathode: Pt coated carbon cloth |
|---|---|
| Diameter = 1 cm, length = 9.5 cm | Length = 7 cm, Breadth = 5 cm |
| Total area of each anode = 31.42 cm2 | Area of each cathode = 35 cm2 |
| Total area of 4 anode = 4 × 31.42 = 125.68 cm2 | Area of 4 cathode = 4 × 35 = 140 cm2 |
Assembling of MFC
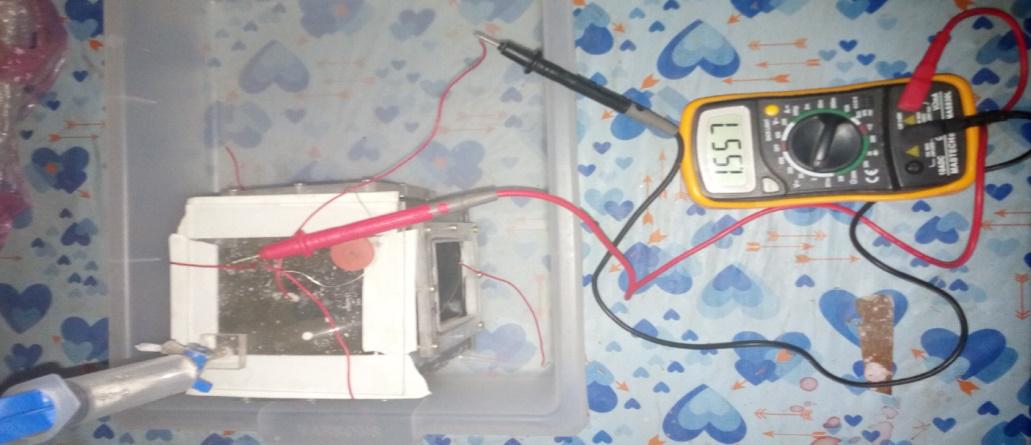
After getting the entire components ready the MFC was assembled and ready for testing. Anode electrodes were fixed in between the chamber and cathode electrodes were screwed on the four walls of chamber with the help of gasket. Then top of the chamber was fixed to maintain anaerobic condition. Figure 2 shows the photograph of completely assembled MFC.
Operation of MFC
For the first run of MFC, operation steps have been followed: First the sludge was filtered, to remove inorganic impurities and large debris from it. Then the 50 % (V/V) waste water and distilled water with glucose (1g/L) was filled into the anode chamber. Phosphate buffer media (PBM) NH4Cl (0.31 g/l), NaH2PO4.H2O (4.45 g/l), N2HPO4 (2.75 g/l), KCl (0.13 g/l) was filled in the chamber. The anode chamber was sealed properly, to maintain anaerobic conditions. Both the connecting wire from electrode was joined through a variable resistance (1 to 10 K Ω) of 1 K Ω, 3 K Ω, 5 K Ω one by one. All data, OCV, voltage and current were measured by a digital multimeter (Excel DT 9205A). Number of bacterial colonies (CFU) was measured simultaneously by taking sample from the setup with the help of syringe. Each of data was measured after every two hours thrice in a day since the beginning of run of MFC. All data were then recorded. Average value of each data with respect to hours was used as the value for that day.
Results and Discussion
Using the MFC system describes in previous section cell behaviour was investigated by measuring open circuit voltage (OCV), current, output power, number of bacterial colonies (CFU). These results are discussed in following sections.
Open Circuit Voltage (OCV)
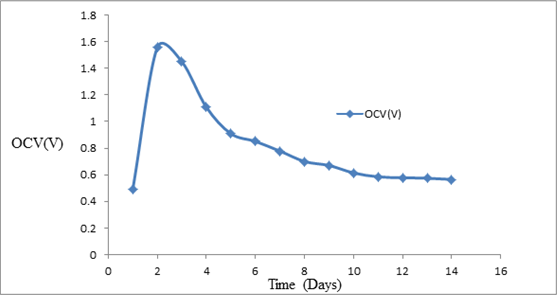
Open circuit voltage was measured from the beginning up to 14 days. A digital multimeter was used for measuring the voltage. The reading was taken three times in a day at every 2 hours of interval and it was averaged on the daily basis. The sample was inoculated with 50 % (V/V) waste water and distilled water with glucose (1g/L) was filled into the anode chamber along with phosphate buffer media (PBM) NH4Cl (0.31 g/l), NaH2PO4.H2O(4.45 g/l), N2HPO4 (2.75 g/l), KCl (0.13 g/l) in the chamber. The OCV vs. time variation is depicted in Figure 4. It is seen that on the 2nd day MFC gives a maximum value of OCV i.e. 1.557 V and after that it decreases almost continuously because of decline in microbial population. On the 14th day it goes down to 565 mV.
This is because of increased surface area and use of platinum catalyst (a better electrode material).
Effect of External Resistance
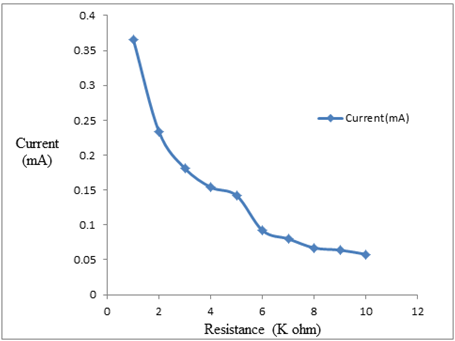
Current (mA) was recorded by varying the external resistance of MFC at the 7th day of operation of MFC to observe the effect of external resistance on the current production. A plot of external resistance and the current produced by the MFC is shown in Figure 5. Current was measured by varying the variable resistor from 1 to 10 K ohm. It is seen that the current was decreasing almost linearly by varying the external resistor from 1 to 10 K ohm because current is inversely proportional to resistance (I = V/R). Maximum current 0.366 mA is obtained at 1Kohm and minimum current 0.058 is obtained at 10 K ohm.
Power Production
The reading of open circuit voltage (OCV), voltage and current produced by MFC with three different external resistances were recorded every day. As previously described that each of the reading was taken after every two hours interval daily, and the average value of each reading was noted as the reading for that day. The plots were generated between power produced by MFC and time in days for a period of 14 days. The curves firstly increase with time for each of resistance up to reach a peak value and then decreasing. The power (P, mW) and time (days) is shown in Figure 6.
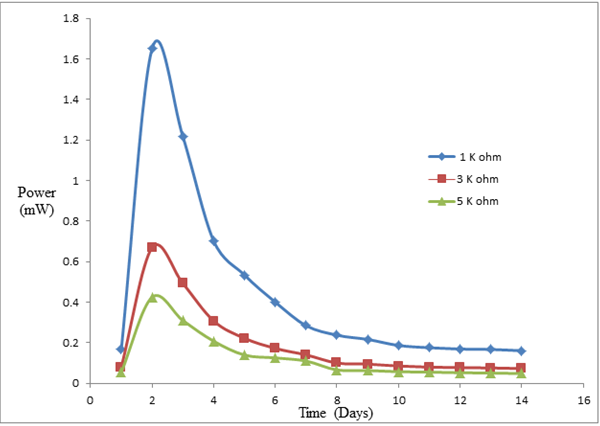
The curve of power vs. time illustrates that the power output of MFC increases with time up to a peak value of 1.65042, 0.66951 and 0.425061 mW at the 2nd day of operation with 1 K, 3 K and 5 K ohm external resistance respectively, then starts falling down. This fall in performance may be the result of consumption of substrate resulting in decreasing of oxidation reaction. Further, the microbial species might have entered the death phase. Thus the transfer of electrons at anode was slowed down and the power production decreased.
Current Density (I’)
Current produced in the MFC was too low, but it can be increased by increasing the area of the anode, so a more relevant parameter in defining the performance of MFC is the current density which is nothing but current produce by MFC normalized by the total anode area.
Current density 2 mA m = ( ) ( ) 2 Current mA Anodearea m
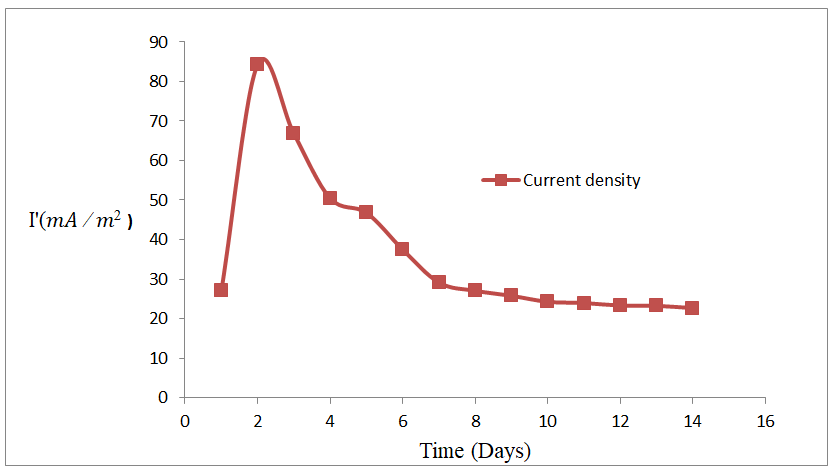
A plot of current density with time is shown in Figure 7. The variation of current density with time also shows the same trend as that of power produced with time and gives the maximum value of 84.311 mA/m2 at around 2nd day. This plot is relative to 1 K ohm resistance.
Power density (P’)
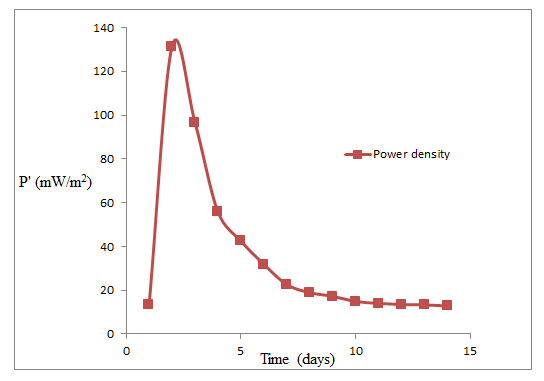
Similar to current density power density is also the power produced by MFC (mW) normalized over the surface area of anode (m2). Power density is the most useful parameter in evaluation of MFC performance.
Power density 2 mW m = ( ) ( ) 2 Power mW Anode area m
A plot of variation of power density with time is shown in Figure 8. This plot is relative to 1 K ohm external resistance. As expected power density rises to a peak value of 131.319 (mW/m2) at 2nd day of operation and then declines.
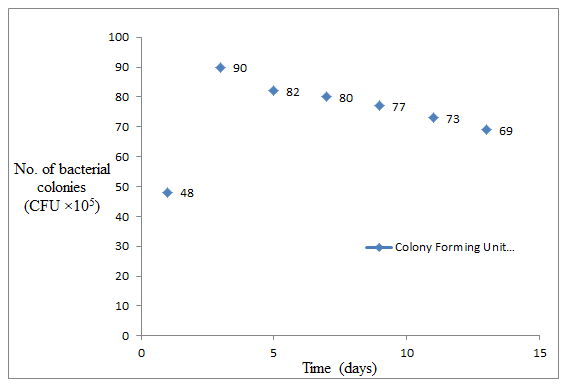
Number of Bacterial Colonies
Nutrient agar medium was prepared by adding 250 ml distilled water and with 7 gm Nutrient agar. Washed glass wares, micro centrifuge tubes, Micro pipette tips, nutrient medium and petri-plates were packed for sterilization. Sterilization was for 20 min at 121 degree centigrade and 15 psi pressure. Laminar hood was wiped with ethanol before its use.
After sterilization, the nutrient agar medium was poured in to the petri-plates until the surfaces of the plate were fully covered with agar. It is kept as such for a while till it solidified. Four micro centrifuge tubes were taken for each sample and with the help of micro-pipette solution was diluted to 10, 100, 1000, 10000, 100000th part respectively in a separate micro centrifuge tube. Then this sample was spread on agar surface using a sterile L-rod. The plates were sealed with parafilm. Then, the plates were incubated at 37-degree centigrade for one day. After one day, the plates were checked for colonies. Number of colonies were counted using colony counter.
Numbers of bacterial colonies were calculated alternatively at the gap of one day. As shown in Figure 9 number of bacterial colonies increases with time and given maximum value on the 2nd day and after there is decrease of colonies because of consumption of substrate.
Conclusion
Words major energy source is fossil fuel, due to the depilation of petroleum sources, there is fear of energy crisis in future. Moreover, use of fossil fuels produces pollution in environment, which is also big problem in itself. The study successfully demonstrated electricity production in biofuel cell using waste water obtained from local waste water treatment plant as source of substrate. The maximum power produced by MFC was 1.65042, 0.66951, 0.425061 mW at the 2nd day of operation with 1K, 3K, 5K ohm external resistance respectively. The maximum open circuit voltage and current given by MFC was 1.557 mV and 1.06 mA respectively incorporated with 1 K ohm resistance. The maximum current and power density was observed to be 84.341 mA/m2 and 131.319 mW/ m2 respectively. The maximum number of bacterial colonies was 90 ×105 CFU on the 3rd day as it was measured alternatively a gap of one day.
Acknowledgments
This work was supported by the Department of Chemical Engineering & Technology, Indian Institute of Technology, BHU, Varanasi-221005, India.
References
-
Liu H, Logan BE (2004) Electricity generation using an air-cathode single chamber microbial fuel cell in the presence and absence of a proton exchange membrane. Environ Sci Technol 38(14): 4040-4046.
-
Rahimnejad M, Adhami A, Darvari S, Zirepour A, Sang-Eun OH, et al. (2015) Microbial fuel cell as new technology for bioelectricity generation: A review. Alexandria Engineering Journal 54(3): 745-756.
-
Moqsud MA, Omine K, Yasufuku N, Hyodo M, Nakata Y, et al. (2013) Microbial fuel cell (MFC) for bioelectricity generation from organic wastes. Waste Manag 33(11): 2465-2469.
-
Oh S, Min B, Logan BE (2004) Cathode performance as a factor in electricity generation in Microbial Fuel Cells. Environ Sci Technol 38(18): 4900-4904.
-
Rabaey K, Boon N, Siciliano SD, Verhaege M, Verstraete W, et al. (2004) Biofuel cells select for microbial consortia that self-mediate electron transfer. Appl Environ Microbiol 70(9): 5373-5382.
-
Rabaey K, Boon N, Höfte M, Verstraete W (2005) Microbial phenazine production enhances electron transfer in biofuel cells. Environ Sci Technol 39(9): 3401-3408.
-
Bond DR, Holmes DE, Tender LM, Lovley DR (2002) Electrode reducing microorganisms that harvest energy from marine sediments. Science 295(5554): 483-485.
-
Park DH, Zeikus JG (1999) Utilization of electrically reduced neutral red by Actinobacillus succinogenes: physiological function of neutral red in membrane- driven fumarate reduction and energy conservation. J Bacteriol 181(8): 2403-2410.
-
Bond DR, Lovley DR (2003) Electricity production by Geobacter sulfurreducens attached to electrodes. Appl Environ Microbiol 69(3): 1548-1555.
-
Gorby YA, Beveridge TJ (2005) Composition, reactivity, and regulation of extracellular metal-reducing structures (nanowires) produced by dissimilatory metal reducing bacteria. DOE/NABIR meeting, Warrenton, VA.
-
Gorby YA, Yanina S, McLean JS, Rosso KM, Moyles D, et al. (2006) Electrically conductive bacterial nanowires produced by Shewanella oneidensis strain MR-1 and other microorganisms. PNAS.
-
Reguera G, McCarthy KD, Mehta T, Nicoll JS, Tuominen MT, et al. (2005) Extracellular electron transfer via microbial nanowires Nature 435(7045): 1098-10101.
-
Logan BE (2004) Extracting hydrogen and electricity from renewable resources. Environ Sci Technol 38(9): 160A-167A.
-
Du Z, Li H, Gu T (2007) A state of the art review on microbial fuel cells: A promising technology for wastewater treatment and bioenergy. Biotechnol Adv 25(5): 464-482.
-
Logan BE (2010) Scaling up microbial fuel cells and other bio electrochemical systems. Appl Microbiol Biotechnol 85(6): 1665-1671.
-
Cao X, Huang X, Liang P, Boon N, Fan M, et al. (2009) A completely anoxic microbial fuel cell using a photo- biocathode for cathodic carbon dioxide reduction. Energy & Environmental Science 2: 498-501.
-
Yadav AK, Nayak SK, Acharya BC, Mishra BK (2015) Algal- assisted Microbial Fuel Cell for Wastewater Treatment and Bioelectricity Generation. Energy Sources, Part A: Recovery, Utilization, and Environmental Effects 37(2): 127-133.
-
Kim BH, Chang IS, Gadd GM (2007) Challenges in microbial fuel cell development and operation. Appl Microbiol Biotechnol 76(3): 485-494.
-
Nevin KP, Richter H, Covalla SF, Johnson JP, Woodard TL, et al. (2008) Power output and columbic efficiencies from biofilms of Geobacter sulfurreducens comparable to mixed community microbial fuel cells. Environ Microbiol 10(10): 2505-2514.
-
Liu H, Logan BE (2004) Electricity generation using an air-cathode single chamber microbial fuel cell in the presence and absence of a proton exchange membrane. Environ Sci Technol 38(14): 4040-1406.
-
Kim JR, Cheng S, Oh SE, Logan BE (2007) Power Generation Using Different Cation, Anion, and Ultrafiltration Membranes in Microbial Fuel Cells. Environ Sci Technol 41(3): 1004-1009.
-
He Z, Minteer SD, Angenent LT (2005) Electricity generation from artificial wastewater using an up flow microbial fuel cell. Environ Sci Technol 39(14): 5262- 5267.
-
Hasvold O, Henriksen H, Melvaer E, Citi G, Johansen BO, et al. (1997) Sea-water battery for subsea control systems. J Power Sources 65(1-2): 253-261.
-
Liu H, Cheng S, Logan BE (2005) Power generation in fed batch microbial fuel cells as a function of ionic strength, temperature, and reactor configuration Environ Sci Technol 39(14): 5488-5493.
-
Cheng S, Liu H, Logan BE (2006) Power Densities Using Different Cathode Catalysts (Pt and Co TMPP) and Polymer Binders (Nafion and PTFE) in Single Chamber Microbial Fuel Cells. Environ Sci Technol 40(1): 364-369.
-
Zhao F, Harnisch F, Schroder U, Scholz F, Bogdanoff P, et al. (2005) Application of pyrolysed iron(II) phthalocyanine and CoTMPP based oxygen reduction catalysts as cathode materials in microbial fuel cells. Electrochem Commun 7(12): 1405-1410.
- Nigeria’s Vulnerability in the Face of Global Energy Policy
- A Simulation Study of Investigation of Optimum Oil Production Performance by Applying Various Gas Injection Methods in Oil Reservoir
- Characterization of Permo-Triassic Reservoirs through Thermal Maturity Assessment of Westphalian Source Rocks in the Cheshire Basin
- Influence of Microwax on the Rheological and Thermal Behaviour of a Wax Crude Oil
- Real-Time Monitoring and Performance Optimization of Steam Injection in Heavy Oil Reservoirs Using Fiber Optic Sensing and Integrated Predictive Simulation Models
- Rapid On-Site Determination of the Total Petroleum Hydrocarbon Content of Soils by Handheld Fourier Transform Near-Infrared Spectroscopy: Development of a Global, Site- and Scanner- Independent Calibration Model