Empirical Correlation for Determination of Shear Wave Velocities from Wireline Logs in West Qurna Oil Field
Using acoustic wave propagation to analyze rocks in mining and geotechnical engineering, researchers have been looking into the link between dynamic and static elastic properties since the early twentieth century. The essential mechanical qualities of rock materials that are necessary for the analysis and design of rock digging operations are determined by their elastic properties (Young's modulus, shear modulus, and Poisson's ratio). Geomechanical applications rely on acoustic data to create a safe mud weight window, estimate rock strength parameters, sand management, and hydraulic fracturing. Ultrasonic lab and sonic log readings are often inconsistent because of the frequency differential and other considerations. Ultrasonic laboratory measurements and acoustic logs of shear wave velocity and compressional wave velocity for the Mishrif formation in the West Qurna-1 oil field are compared in this work to better understand how these critical measurements influence on the accuracy of calculating dynamic model. compressional (Vp) and shear (VS) wave velocities and density data were used to compute the porosity as well as elastic modulus. We observed a correlation between P wave velocity and sample elastic characteristics. Vp and elastic characteristics were correlated using regression analysis to generate empirical equations. Correlations between velocity data and the geological background of the region yielded excellent estimates of elastic characteristics. The results showed that there is a good agreement between Young's coefficient from the laboratory and the obtained log data, where the R2 value is 0.86. A good match between Vp and VS was also obtained for the laboratory data where the R2 value was 0.83.
Introduction
Oil well logging, also recognized as wireline logging, is a technique of gathering data from the well that permits the determination of formation physical features and reservoir parameters [1]. Studying and analyzing a reservoir’s performance necessitates a knowledge of the rock’s physical properties as well as the existing interaction between the hydrocarbon system and the formation [2]. The elastic characteristics of rock are often employed in modeling and formulation approaches to anticipate stress-strain behavior under various conditions. Elastic attribute constants may be determined using either dynamic or static analysis. The static elastic characteristics of the core are determined experimentally using the stress-strain response of the core during a uniaxial loading test [3]. As a result of the measurement of compressional (Vp) and shear (VS) wave velocities, dynamic elastic constants may be calculated depending on the material sample. The static and dynamic elastic moduli have been reported in the literature to vary in values [4]. An elastic wave is a type of mechanical disturbance that travels through a sample material [5]. It is possible to get vital information about formations that are typically out of reaching by using elastic waves that can travel over great distances inside reservoir formations [6]. As a consequence, estimating the elastic constants of field formations may be done using elastic waves [7].
It is possible to think of elastic waves as mechanical disturbances that may travel through a material. Additionally, these waves have the capacity to penetrate through and travel extremely great distances via subsurface formations in order to retrieve a piece of vital information from normally inaccessible zones. Seismic surveys, earthquakes, and rock mechanics may all benefit from elastic waves. These same principles are often used for studying the wave behavior of solid objects such as water or air, as well as to describe the propagation of elastic waves [8]. Elastic wave propagation in rocks is reflected in the rock density and rock density velocity, both of which are dependent on other factors, such as porosity. It was shown that estimating parameters for particular formations in the field using elastic waves was an effective strategy. Energy exploration in the petroleum industry relies heavily on two types of elastic waves: Compressional waves are also known as longitudinal waves because of the periodic compression of the material it involves [9]. Operators have numerous methods of getting information for making the decision [10]. Formation characteristics ought to be studied in details for assessing the type of cutting construction. The periodic shearing of the material causes this wave to be referred to as a shear wave or a transversal wave. Compressional and shear waves are more generally referred to as P-waves and S-waves in the context of a solid that is homogenous and isotropic. Depending on the subject and application, these waves might go by a variety of names in the same context [11]. P- and S-waves are referred to as “elastic waves” in rock mechanics and physics, respectively. While “acoustic waves” in seismic refers only to P-waves, “elastic waves” refers to both P- and S-waves [12].
Kassab and Weller used experimental observations in porous sandstone core plugs under dry and wet circumstances to identify the angle of main and secondary wave velocities. Saturated samples had higher P-wave velocities than dry samples for all of the core plugs tested in the lab. S-wave velocities in dry core plugs, on the other hand, were found to be higher than in saturated samples in the lab [13]. P- and S-wave velocities may be determined directly using a sonic wireline log or by measuring core samples [14]. The measurements of sonic wireline log are more prevalent and accessible for obtaining P-wave and S-wave velocities because of the absence of core plugs and the constraints, especially the core samples of overburden zones [15]. Well integrity is an active feature that must be supported in the life of the well [16] to generate sound waves of a certain frequency, the sonic log uses one or more transmitters. These sound waves travel through the mud in the wellbore and the formation, and are then picked up by one or more detectors in the sonic log [17]. The detectors will then be used to determine the P- and S-wave travel times, respectively, by comparing the arrival times of sonic waves received by two detectors and calculating the difference in arrival times ( tp ∆ & ts ∆ ). When compared to ts ∆ slowness, tp ∆ slowness comes first. However, ultrasonic laboratory measurements on core plugs provide a second direct method for obtaining P- and S-wave velocities. In comparison to direct sonic log readings, this approach is less popular due of the time, expense, and difficulties involved with acquiring subsurface core plugs [18]. Because oil and gas exploration has relied on carbonate rocks for most of its history, it is not surprising that about 40% of the world’s reserves are found in these rocks [19]. The sample will be subjected to a compressional triaxial test using the triaxial cell and a pulse transportation methodology in this procedure. On both sides of the rock plug, the ultrasonic wave sources and detectors will be installed. After then, the velocities of the P- and S-waves will be measured directly [20]. Wellbore stability, hydraulic fracturing design, sand management, petrophysics, and seismic velocities all use P-wave and S-wave velocities in the oil and gas sector [21]. When rock plugs are not accessible for lab testing, various geomechanical concerns associated with drilling operations must be investigated [22]. There are many empirical correlations that have been developed to estimate the mechanical properties of rocks to be used as inputs for the geomechanical model based on the P-wave and the S-wave velocities because they are relatively inexpensive and uncomplicated to acquire through the drilling procedure [14, 23]. Elastic wave propagation in rocks is fundamentally influenced by many of the same elements that affect rock strength [24]. The ultrasonic lab measurements of P- and S-wave velocities vary from those derived from the sonic log. Furthermore, laboratory measurements of P and S wave velocities tend to be higher than sonic log measurements of P and S wave velocities because of the changes in measuring circumstances between the surface and subsurface [25]. The variations between wireline log and lab-measured P-wave and S-wave include, but are not limited to; frequency, temperature, and pressure [26]. The density and viscosity of the drilling mud have a significant impact on the wireline sonic log data [27]. Since the P-wave velocity decreases as temperature rises, it is widely accepted that temperature is the most important element in determining wave velocities [28].
West Qurna one (WQ1) oil field, Iraq, rock samples from mishrif formation and sonic logs for the same sections were used in this study to understand P-wave and S-wave velocities for both sonic log and ultrasonic lab measurements, as well as their effects on estimating the dynamic elastic moduli.
Area of the Study
West Qurna is a supergiant oil field in the southeast of Iraq; it is around 70 kilometers north-west of Basra. The field is located between (3425.000°-3400.000°) north longitudes and (716000° - 732000°) east latitudes.
Geology of the Study Area
A heterogeneous carbonate reservoir has formed in the West Qurna-1 oil field, known as Mishrif (Figure 1). An important reservoir not just in the West Qurna-1 area but across southern Iraq is the Mishrif formation [29].
![Figure 1: Map of the top of the Mishrif structure [29].](/fulltextimages/10246/fig_1.png)
As shown in (Figure 2), this formation separates the Khasib Formation and the Rumaila Formation, which is located between them..Mishrif formation consists of the anticlinal fold with gentle dips. The length of the structure is about 42 km and width 16.5 km from the center of the area, and the depth of Mishrif formation at top of the structure is (2207m) at well (WQ-110), and thickness about (202m). Cap Rock I, Upper Mishrif (MA), Cap Rock II, and Lower Mishrif (LM) are all Mishrif Formation units in the West Qurna oil field (MB1and MB2 respectively) [30]. Mishirf formation consist from the following units.
1. Cap Rock I: Cap Rock I is the upper part of the Mishrif formation. It consists of compact limestone, mudstone, and wackestone. It is locally clayey, particularly in the higher section. This unit is characterized by relatively low porosity and permeability.
2. MA unit (Upper Mishrif): MA or upper Mishrif unit starts with the porous limestone below the tight Cap Rock I and the bottom of this unit is the top of the compact limestone of Cap Rock II. The highest section of this unit is limestone, followed lower by limestone with some packstone and lastly limestone. Fine-grained chalky textured limestone dominates the majority of this unit.
3. Cap Rock II: This unit comprises limestone developed in a sub-tidal environment, hard, thick, non-fossiliferous, and sometimes shaly. Because of its compactness and lack of porosity, this unit serves as a cap rock for unit MB1.
4. MB1 unit (Lower Mishrif): This unit starts with the porous limestone below the tight Cap Rock II. This unit is an important portion of the Mishrif Formation since it holds a significant amount of Mishrif oil. This is because it includes the porous and permeable Rudists biostromes.
5. MB2 unit (Lower Mishrif): Because of its high porosity and permeability, this unit is highly regarded. The Rumaila formation’s sub-basinal facies lies at the base of this unit, which descends from MB1’s lowest biostrome.
![Figure 2: Stratigraphic column for the southern region of Iraq [30].](/fulltextimages/10246/fig_2.png)
- Data Management and Research Technique
- Core Samples
- In this study, 18 limestone core samples collected from the field WQ1 from the wells WQ1-20 and WQ1-240
- Well plug no
- Depth,m unit
- Length,cm
- Vp(m/s)
- Vs(m/s)
- 1
- 2354.49
- Ma
- 7.25
- 3356.48
- 1726
- 2
- 2364.36
- Ma-1
- 7
- 3211.01
- 1515
- 4
- 2390.11
- Mb-1
- 7.49
- 3566.67
- 1750
- 5
- 2394.1
- Mb1
- 7.3
- 2807.69
- 1437
- WQ1-240
- 6
- 2442.58
- Mb2
- 7.25
- 3072.03
- 1543
- 7
- 2446.71
- Mb2-1
- 7.29
- 3037.5
- 1544
- 8
- 2453.98
- Mb2-2
- 7.55
- 2903.85
- 1452
- 9
- 2462.27
- Mb2-2
- 4.43
- 3407.69
- 1717
- 1
- 2247
- MA-1
- 5.57
- 3276
- 1688
- 2
- 2256
- MA-2
- 6.8
- 3400
- 1726
- 4
- 2280
- MB-1
- 7.77
- 3238
- 1653
- 5
- 2311
- MB2
- 7
- 3333
- 1591
- 6
- 2316
- MB2-1
- 7.05
- 2866
- 1506
- WQ1-20
- 7
- 2320
- MB2-1
- 7.22
- 2843
- 1438
- 8
- 2326
- MB2-2
- 5.88
- 3095
- 1556
- 9
- 2331
- MB2-2
- 7.1
- 3381
- 1821
- 10
- 2321
- MB2-1
- 7.09
- 2954
- 1509
- 11
- 2322
- MB2-1
- 7.2
- 3130
- 1593
Table 1: the data collected from the wells WQ1-240 & WQ1-20.
In order to evaluate the elastic and geotechnical properties of limestone rocks in the area, laboratory measurements were performed by using the New Sonic viewer device (Model-5217A) which is found in the Department of petroleum engineering, University of Baghdad. The arrival times of the propagated waves (T) were measured, and the Vp and Vs waves were determined by using the equations 1and 2 [4]:
/ Vp L TP = (1)
/ Vs L Ts = (2)
Where: L is the sample length, cm Tp and Ts are arrival times, microsecond. The range of Vp was 2843-3576 m/sec and the average was 3159.93 m/sec. However, Vs was found to be range 1438-
1726 m/sec and its average was 1598 m/sec.
Density Measurements
The density of plug samples calculated for the wet samples from the bulk volume of the plugs and the weight of these plugs from equation 3 [18]:
( ) ( ) ( ) / ³ / ³ Density Kg m Weight Kg Volume m = (3)
The maximum density value was found to be 2829 kg/ m³, and the minimum value was 2597 kg/m³, whereas the average value was 2746.93 kg/m³.
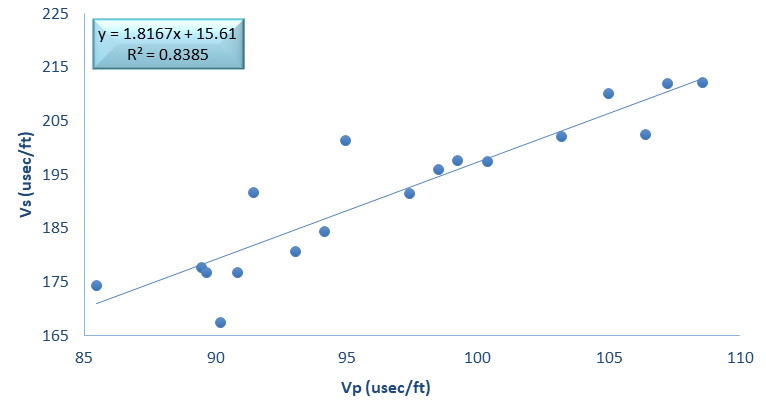
The Relation Between Vp and Vs in Laboratory
This relation is useful for determining of the velocity of Vs from the velocity of Vp, because the generation of Vp is easier than the generation of Vs. The relationship is shown in Figure 3 and Table 2 in appendix A with its equation and R2
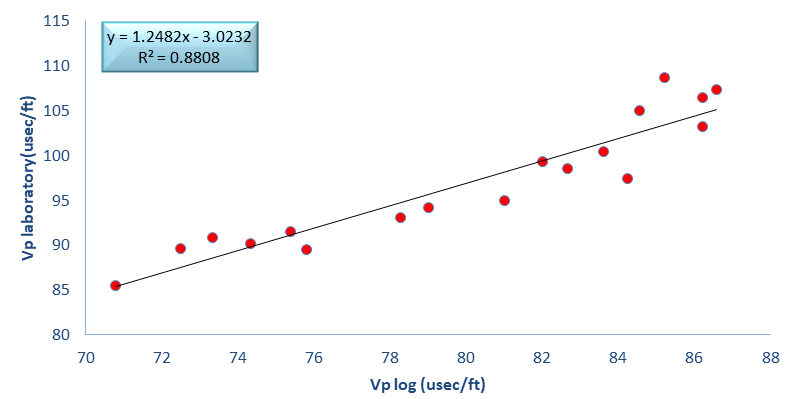
The Relation Between Compressional Wave Velocity From Laboratory and Log
The relationship between compressional wave velocities from log corrected to the laboratory. The data collected from the two wells (WQ1-240 and WQ1-20) drawn together to find the correlation for compressional wave velocity for mishrif formation in WQ1 oil field as shown in the Figure 4 and the Table 3 in appendix A where the correlation: The determination coefficient for the relationship between VP log and VP laboratory equal to (R2) 0.88.
Shear Wave Velocity for the Wireline Measuerments
Shear wave velocity for the log (Vs log) can be find from the correlation between compressional wave velocity in the laboratory and shear wave velocity (Vs) in the laboratory after drawn them the relation were as in Figure 3 with equation.
Determination of Dynamic Elastic Properties from Laboratory Work
After laboratory determination of Vp, Vs, and density for the rock samples, several parameters of elasticity, such as Young modulus (E), Bulk modulus (K), shear modulus (μ), Poisson’s ratio (σ), and Lame’s constant (λ), were obtained from the equations shown in Table 4 and Table 5 in Appendix.
| Rock Parameter | Equation |
|---|---|
| Young Modulus | ρ Vs2(3Vp2−4Vs2) Ed = (Vp2−Vs2) |
| Shear modulus | µ=Vs2ρ |
| Poisson’s ratio | Vp2−2Vs2 σ= 2(Vp2−Vs2) |
| Bulk modulus | 4 K =ρ Vp2− Vs2 3 |
| Lames constant | λ=ρ(Vp2−2Vs2) |
Table 2: Equations used to calculate elastic parameters of rock samples collected from mishrif Formation, southern Iraq.
Where, ρ is the density (g/cm3), VP and VS are in m/s, and Ed is in GPa. Table 4: Equations used to calculate elastic parameters of rock samples collected from mishrif Formation, southern Iraq.
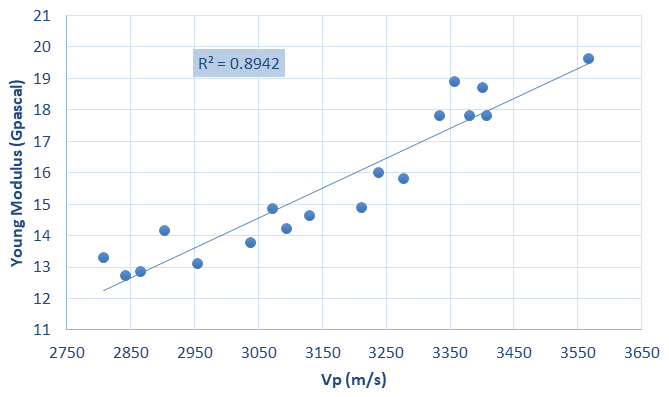
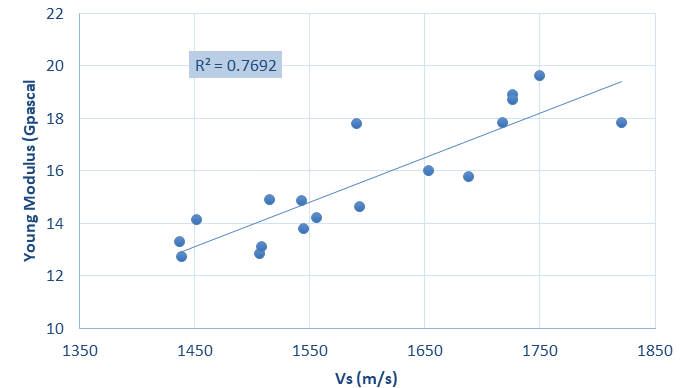
The Relation Between Vp-and Vs and Young Modulus (E) in Laboratory: The relationship between E and Vp shows a linear with a high regression coefficient value (R2=0.89) is shown in Figure 5. While the relationship between E and Vs is illustraited in Figure 6 with a low regression coefficient value (R2=0.76).
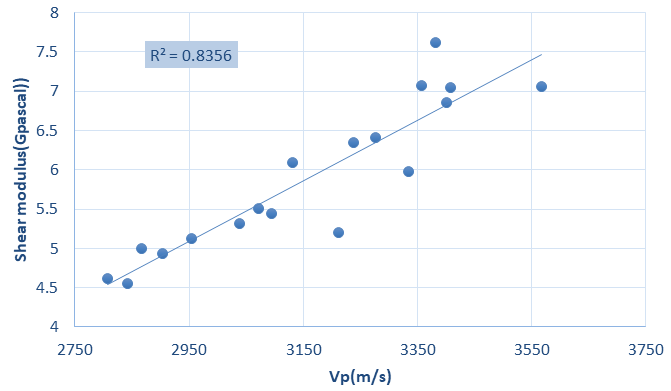
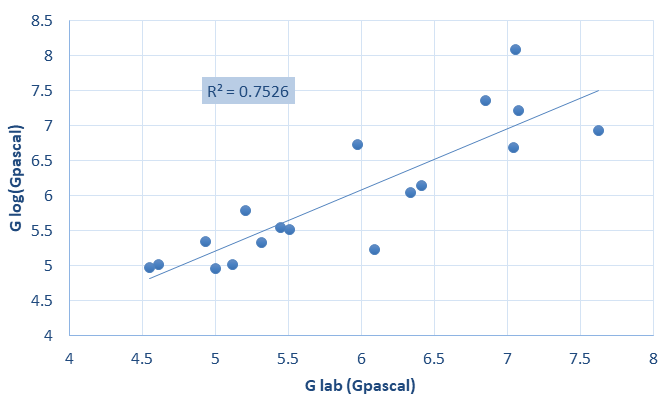
The Relation between P-and S-Wave Velocities and Shear Modulus in Laboratory: Shear modulus is considered as a function of Vp. These two parameters have a direct proportion with each other, which was considered as a good indicator to the quality factor of limestone rocks of mishrif formation. The shear modulus or modulus of rigidity is defined as the ratio of shear stress and shear strain. This property is to examine how stiff a rock is to shearing strain with no change in the volume. Rigid compacted rocks have higher shear modulus than soft rocks. This implies that the greater value of shear modulus, the larger stress is required to produce deformation as in (Figures 7-9). Figure 10 shows a linear relationship between Vp and G, with a regression coefficient of 0.69.
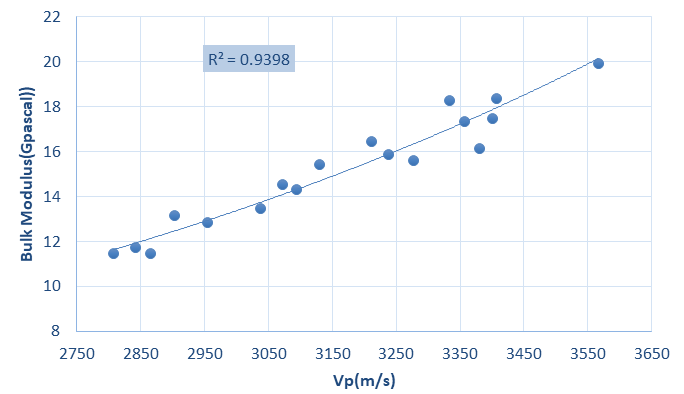
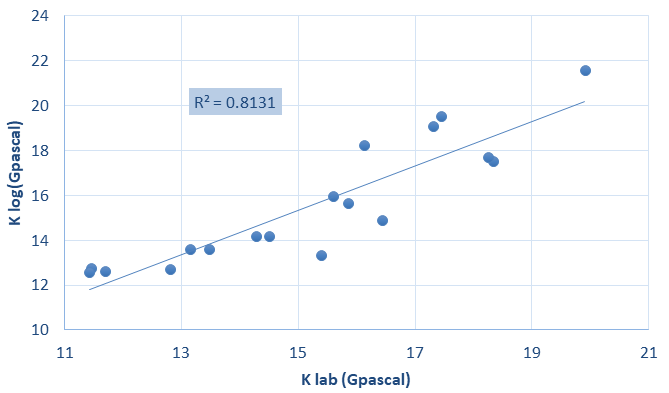
The Relationship between P-and S-Wave Velocities with Bulk Modulus: Bulk modulus is used to inspect the resistance of rocks to compression. A high value of this modulus can be noted in the compacted cemented rocks than in the porous rocks. The relation between K and Vp was plotted in Figure
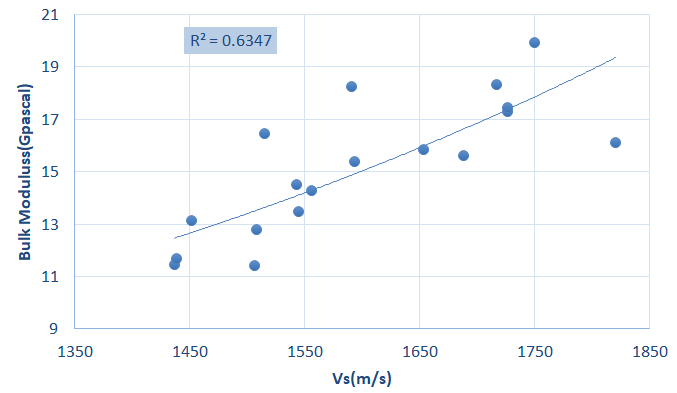
9. The high regression coefficient (R2 = 0.92) reveals a strong linear positive correlation between K and Vp in the studied samples. Low regression coefficient (R2 =0.62) obtained from the plot between Vs and K as shown in Figure 10.
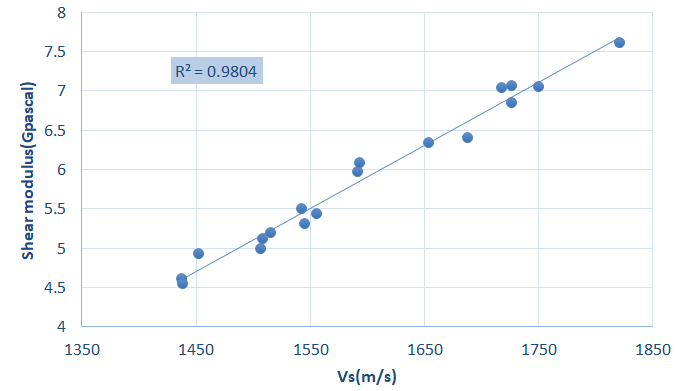
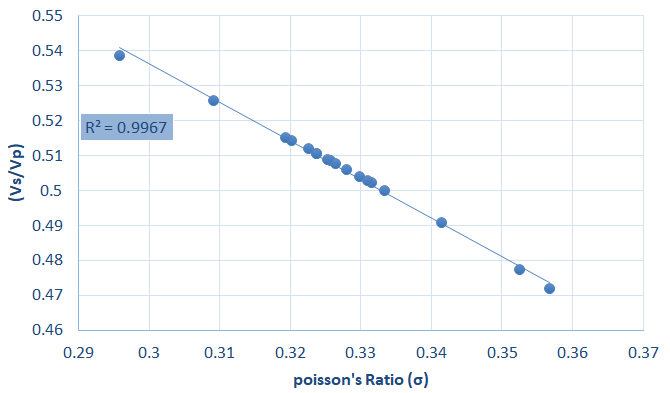
The Relation between Poisson’s Ratios and Velocity Ratio: The relationship between σ and the ratios of Vs/Vp was found to be a linear inverse relationship with a high regression coefficient (R2=0.99), as shown in Figure 11. This means that, when Poisson’s ratio increases, the ratio of Vs / VP decreases, which reduces the brittleness and rigidity of rocks. There is a similar relationship between Vs and G illustrated in Figure 11 but with a larger determination coefficient (R2=0.94). The following equation defines this relationship.
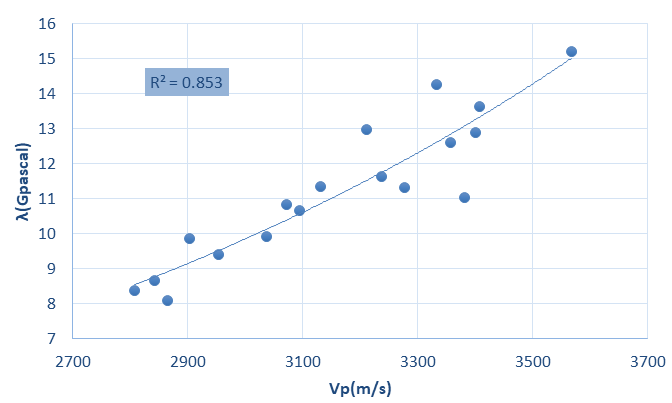
The Relationship Between (Λ) and (Vp and Vs): Lames constant (λ) and (Vp and Vs) for the rock samples are plotted as shown in Figures 12 & 13. The relationship with high regression coefficient (R2=0.84) between Vp and λ as shown in Figure 12, which indicates that the λ increases linearly with increasing Vp. The empirical relations between λ and Vp is given in equation 4 [29]:
0.0083* 14.811 Vp λ = − (4)
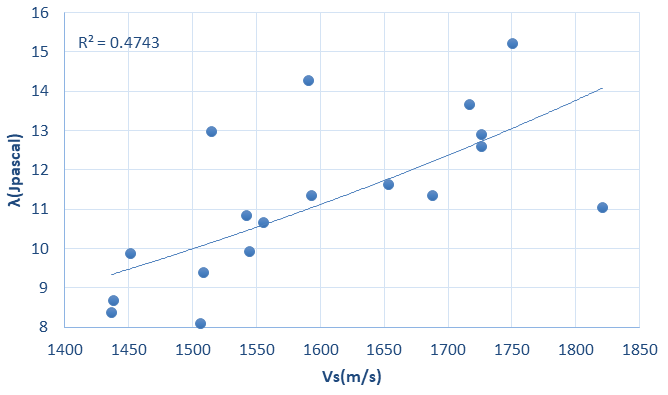
figure 13 shows aweak relationship is illustrated in with a low regression coefficient (R2=0.45) between λ and Vs,which
indicates that the value of Vs cannot be used to estimate λ with an acceptable accuracy. The empirical relations between (λ) and Vp is given in equation 5:
0.0117* 7.3701 Vs λ = − (5)
Results and Discussion
Vp and Vs
It is well documented in the literature that lab measured ultrasonic Vp and Vs are higher than sonic logs values. The discrepancy in the measurements of Vp and Vs is due to the frequency difference between ultrasonic lab and sonic log measured Vp and Vs; where the frequency of ultrasonic lab is approximately one million hertz while the frequency of sonic log is approximately 20 kHz. The discrepancy in the measurements of Vp and Vs can also be due to downhole conditions such as pressure and temperature [18]. Vp log were corrected to Vp lab and the relationship between them used to correct Vp for Mishrif formation. Vp and Vs in laboratory drawn together where the determination coefficient between them (R2) were 0.83 which is a good match and the correlation used to find Vs for the log that is used to calculate the dynamic elastic properties.
Elastic Moduli
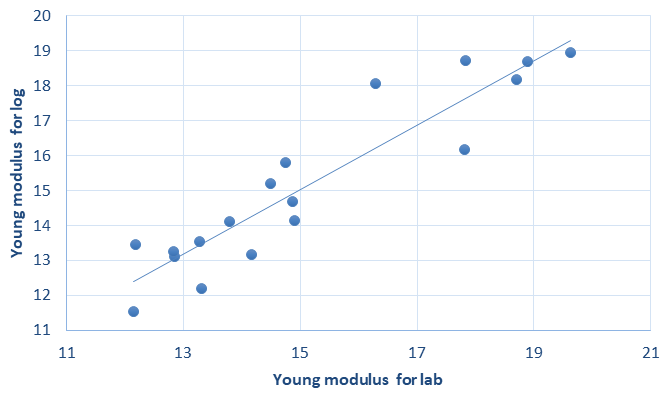
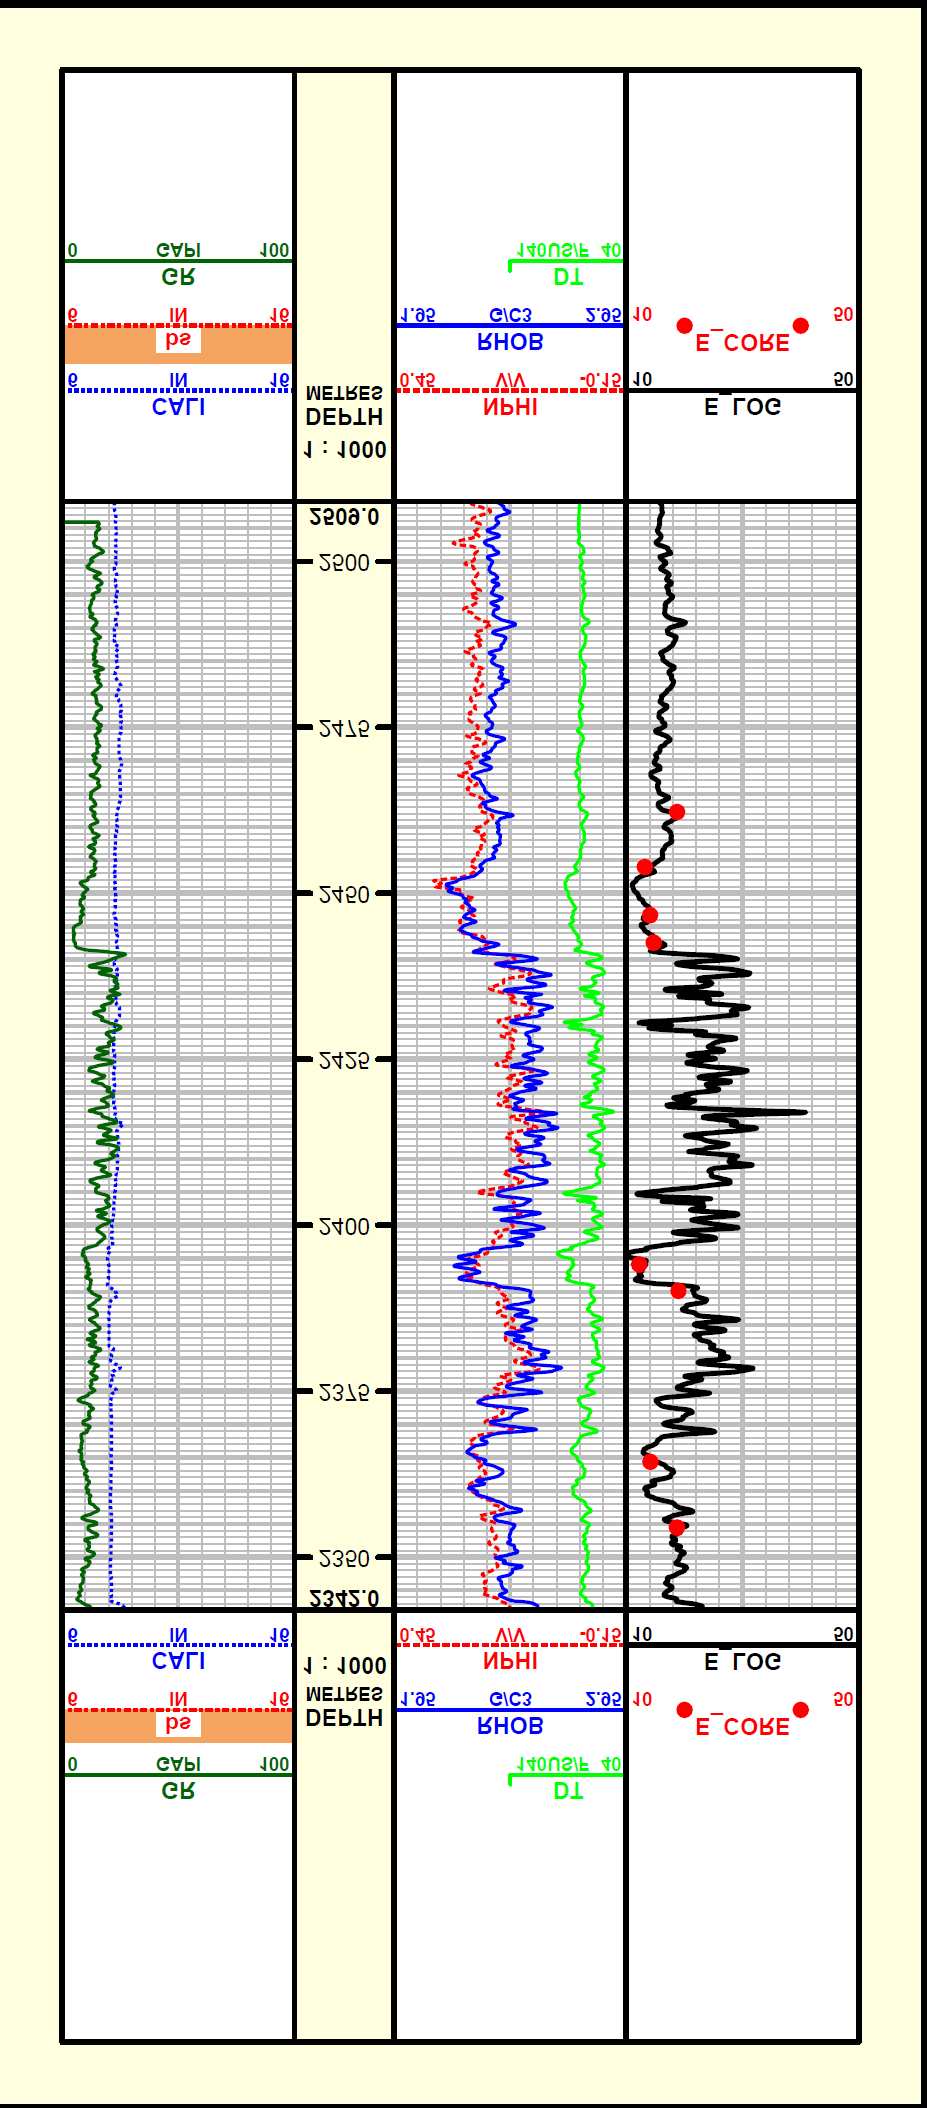
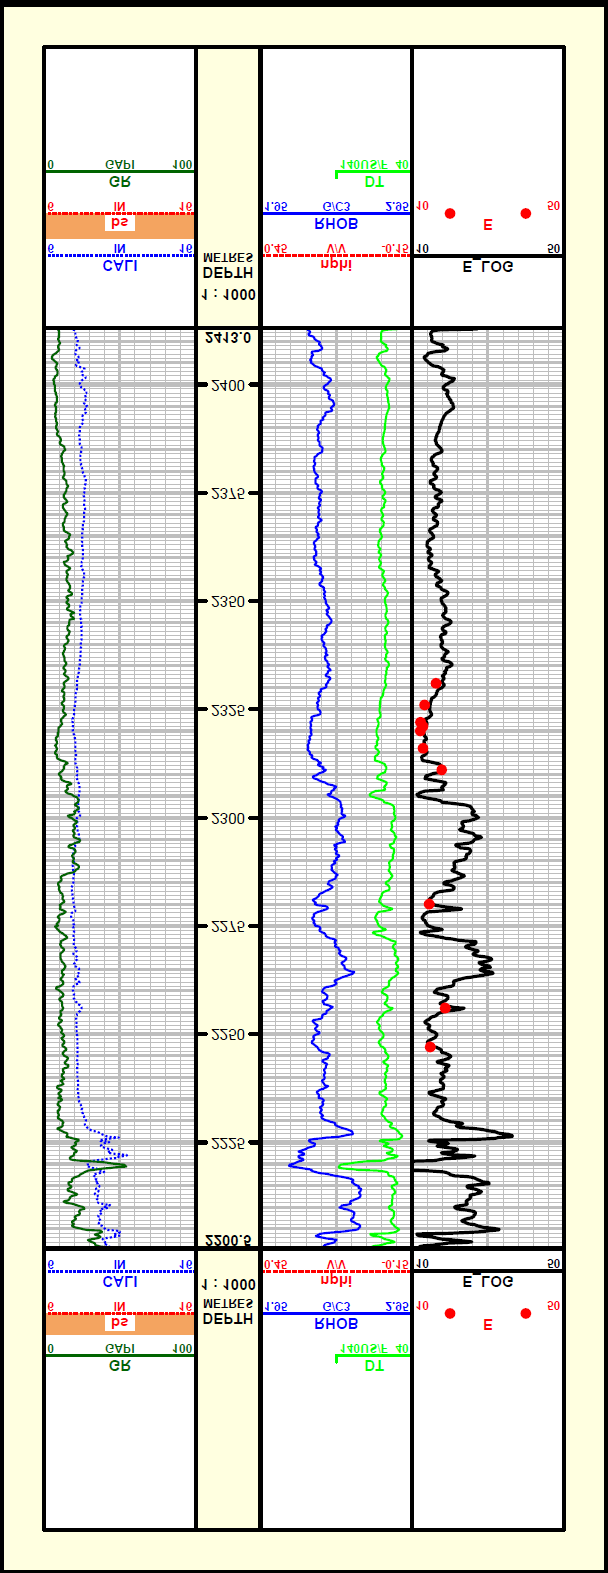
The dynamic elastic properties from laboratory and log were calculated by using Vp and Vs for mishrif formation. Young modulus calculated in the lab and plotted with young modulus calculated from log data. A good match was obtained from the plot between lab and log data as shown in figure 14with R2 equal to 0.86. Shear modulus from the lab and log data shown in Figure 15 with R2 equal to 0.75 and bulk modulus are calculated for the lab and log shown in Figure 16 with R2 0.81. The relationships between log and lab data for elastic properties calculated by using Young modulus Shear modulus and bulk modulus equations. The Young modulus calculated from lab and log plotted with depth as shown in Figure 17 for the well WQ1-240 and figure 18 for the well WQ1-20.
Conclusions and Remarks
Compressional wave and shear wave velocities are necessary to optimize different applications in the petroleum industry, which included hydraulic fracturing design, wellbore stability and the comprehension of the reservoir. Knowledge of seismic data will reduce cost and non-productive time for exploration and production operations. According to a real field dataset and comprehensive laboratory investigations that were implemented on the real core plugs for mishrif formation for different units from the two wells which located in the crest and flank in the field, the following conclusions were be obtained:
- A good match between Vp and Vs was obtained for the laboratory data where the value of R2 equals 0.83, and a very good match between Young modulus from lab and log data gained where R2 equal to 0.86.
- The coefficient determination between Vp lab and Vp
log were 0.88 and the correlation between them used to correct Vp log that used in the calculations of elastic properties from wireline.
- The results showed that the P and S wave velocities gotten from the audio record are lower than those obtained from laboratory tests (ultrasound).
- The dynamic elastic properties for mishrif formation were calculated based on the ultrasonic lab data. Shear wave velocity for the log data that used in calculations of dynamic elastic properties found from the relationship between Vp and Vs from laboratory.
Nomenclature
Vs: shear wave velocities ft/us (foot to microsecond). Vp: Compressional wave velocities ft/ms (foot to microsecond). u: the higher boundary value CALS: Caliper log BS: Bite size MW: Mud weight λ: Lames constant
References
-
Habeeb A (2023) Introduction and Investigation into Oil Well Logging Operations (Review). Journal of Engineering 29: 72-91.
-
Radhi A, Aljwad M (2022) Normalize and De-Normalize of Relative Permeability Data for Mishrif Formation in WQ1: An Experimental Work. Iraqi Journal of Chemical and Petroleum Engineering 23(4): 71-80.
-
Nur AM, Wang Z (2000) Seismic and acoustic velocities in reservoir rocks 3rd (Edn.), Society of exploration geophysicists, Tulsa, USA, pp: 633.
-
Fjaer E, Holt RM, Horsrud P, Raaen AM, Risnes R, et al. (2008) Petroleum Related Rock Mechanics 2nd (Edn.), Elsevier Science, Amsterdam, Netherlands, pp: 1-491.
-
Liu Y, Chen Z, Hu K (2012) Shear Velocity Prediction and its Rock Mechanic Implications.
-
Oyler DC, Mark C, Molinda GM (2010) In situ estimation of roof rock strength using sonic logging. Int J Coal Geol 83(4): 484-490.
-
Birch F (1960) The velocity of compressional waves in rocks to 10 kilobars. J Geophys Res 65(4): 1083-1102.
-
Omnes G (1978) Exploring with SH-waves. CSEG National Convention, 1.
-
Greenberg ML, Castagna JP (1992) Shear-Wave Velocity Estimation in Porous Rocks: Theoretical Formulation, Preliminary Verification And Applications1. Geophys Prospect 40(2): 195-209.
-
Assi AH (2017) Bit Record Analysis for Bits Evaluating and Selection. Journal of Engineering 23(10): 97-113.
-
Horsrud P (2001) Estimating Mechanical Properties of Shale From Empirical Correlations. SPE Drilling & Completion 16(2): 68-73.
-
Horsrud P, Holt R, Sonstebo E, Svano G, Bostrom B, et al. (1994) Time dependent borehole stability: Laboratory studies and numerical simulation of different mechanisms in shale. Proceedings of Rock Mechanics in Petroleum Engineering.
-
Kassab MA, Weller A (2015) Study on P-wave and S-wave velocity in dry and wet sandstones of Tushka region, Egypt. Egyptian Journal of Petroleum 24(1): 1-11.
-
Alameedy U, Alhaleem AA, Isah A, Al-Yaseri A, El-Husseiny A, et al. (2022) Predicting dynamic shear wave slowness from well logs using machine learning methods in the Mishrif Reservoir, Iraq. J Appl Geophy 205: 104760.
-
Chawre B (2018) Correlations between ultrasonic pulse wave velocities and rock properties of quartz-mica schist. Journal of Rock Mechanics and Geotechnical Engineering 10(3): 594-602.
-
Assi A (2022) Geological Considerations Related to Casing setting depth selection and design of Iraqi oil wells (case study). Iraqi Journal of Chemical and Petroleum Engineering 23(2): 35-42.
-
Soroush H, Qutob HH (2011) Evaluation of Rock Properties Using Ultrasonic Pulse Technique and Correlating Static to Dynamic Elastic Constants.
-
Musa M, Hasan A, Khairul A (2010) Determination of Seismic Wave of Consolidated Granite Rock in Penang Island: Ultrasonic Testing Method Vs Seismic Refraction Method. International journal of Geotechnical and Geological Engineering 4: 494-496.
-
Alameedy U, Al-haleem A (2022) The Impact of Matrix Acidizing on the Petrophysical Properties of the Mishrif Formation: Experimental Investigation. Iraqi Geological Journal 55(1): 41-53.
-
Maev RG (2008) Acoustic Microscopy: Fundamentals and Applications. John Wiley & Sons, Weinheim, Germany, pp: 291.
-
Vasconcelos G, Lourenço PB, Alves C, Pamplona J (2008) Ultrasonic evaluation of the physical and mechanical properties of granites. Ultrasonics 48(5): 453-466.
-
Lofti H, Faiz B, Moudden A, Menou A, Izbaim I, et al. (2009) Ultrasonic Characterization and Hardening of Mortar Using the Reflection Technique High Temperature Materials and Processes 28(4): 263-270.
-
Shariati M, Ramli-Sulong NH, Arabnejad KHMM, Shafigh P, Sinaei H, et al. (2011) Assessing the strength of reinforced concrete structures through Ultrasonic Pulse Velocity and Schmidt Rebound Hammer tests. Scientific Research and Essays 6(1): 213-220.
-
Chen X, Schmitt DR, Kesslerb JA, Evans J, Kofman R, et al. (2015) Empirical relations between ultrasonic P-wave velocity, porosity and uniaxial compressive strength 40(5).
-
Fener M (2011) The Effect of Rock Sample Dimension on the P-Wave Velocity. J Nondestr Eval 30: 99-105.
-
Kurtulus C, Bozkurt A, Endes H (2012) Physical and Mechanical Properties of Serpentinized Ultrabasic Rocks in NW Turkey. Pure Appl Geophys 169: 1205-1215.
-
Khandelwal M (2013) Correlating P-wave Velocity with the Physico-Mechanical Properties of Different Rocks. Pure Appl Geophys 170: 507-514.
-
Zhao YL, Yang T, Tong Y, Wang J, Luan JH, et al. (2017) Heterogeneous precipitation behavior and stacking- fault-mediated deformation in a CoCrNi-based medium- entropy alloy. Acta Mater 138: 72-82.
-
Lukoil Mid-East Limited (2013) Final Development Plan Of West Qurna-2 Oil Field. Unpublished report.
-
Al-Ameri TK, Pitman J, Naser ME, Zumberge J, Al-Haydari HA, et al. (2011) Programed oil generation of the Zubair Formation, Southern Iraq oil fields: results from Petromod software modeling and geochemical analysis. Arabian Journal of Geosciences 4: 1239-1259.
- Nigeria’s Vulnerability in the Face of Global Energy Policy
- A Simulation Study of Investigation of Optimum Oil Production Performance by Applying Various Gas Injection Methods in Oil Reservoir
- Characterization of Permo-Triassic Reservoirs through Thermal Maturity Assessment of Westphalian Source Rocks in the Cheshire Basin
- Influence of Microwax on the Rheological and Thermal Behaviour of a Wax Crude Oil
- Real-Time Monitoring and Performance Optimization of Steam Injection in Heavy Oil Reservoirs Using Fiber Optic Sensing and Integrated Predictive Simulation Models
- Rapid On-Site Determination of the Total Petroleum Hydrocarbon Content of Soils by Handheld Fourier Transform Near-Infrared Spectroscopy: Development of a Global, Site- and Scanner- Independent Calibration Model