Optimization of Fracture Treatment Design in a Vertical Well
This project focuses on designing a fracture treatment in a vertical well with the goal of optimizing its parameters to increase its productivity index. The project uses EFRAC 3.3.0.0 software to model and optimize the design of the fracture treatment. The project first compares and selects the optimum fracking fluid, followed by a completion design to choose the best parameters using the optimum fluid selected. The project then analyzes the impact of the number of perforations, perforation diameter, proppant size, injection rate, and duration for each stage on the overall design. The final optimized design includes slick water as the fracking fluid, with a perforation diameter of 0.45 inches, 10 perforations, 20/40 proppant size, 25 BPM injection rate, 15-25-30-minute duration time, and 0-2-4 lbm/gal proppant loading rate. This final design resulted in a productivity index of 6.01, dimensionless.
Introduction
The optimization of fracture treatments in vertical wells within oil reservoirs is a critical endeavor in the realm of petroleum engineering, as it plays a pivotal role in enhancing well productivity indices. The process involves a multifaceted approach, encompassing the selection of appropriate fracturing fluids, meticulous completion design, precise injection rate determination, and meticulous proppant specifications, among other crucial parameters. The ensuing paper embarks on an in-depth exploration of this intricate process, employing state-of-the-art tools and techniques to maximize productivity while minimizing operational challenges. The underlying premise of this research is rooted in the recognition that fractures within the geological formation are dynamic entities. Natural fractures, in particular, exhibit a propensity to reactivate during treatment, causing the stimulation zone to widen. Moreover, the presence of fractures within the rock formation introduces anisotropy Ifrene, et al. [1] (a directional variation in the elastic properties of the rock) into the equation.
These factors introduce complexity into the fracture treatment design, necessitating a comprehensive analysis to achieve optimal results. Using proppant to create fractures in different rock formations is another complex procedure of hydraulic fracture operation. The works of Ifrene, et al. [2] shed light on the interplay between the Joint Roughness Coefficient (JRC) number and fracture aperture, two fundamental parameters that exert profound influence over fluid flow within fractures and joints. Understanding this relationship is paramount in devising effective fracture treatment strategies. Furthermore, it is well-established that fractures tend to propagate along the direction of maximum stress (σ1max) [3]. This insight underscores the importance of meticulous planning and design to ensure that fractures are appropriately oriented to maximize reservoir drainage. Applying multi-stage hydraulic fracturing is a technique that increases production in a well Alpkiray, et al. [4]. The multi-stage application can reduce the costs of applying another well hydraulic fracturing operations. Building on these insights, this paper also draws from the research conducted by Irofti, et al. [5] who employed a formation quality discriminator approach to address the challenges posed by low-porosity and low-permeability formations. Within multilayered tight reservoirs, this approach assists in identifying intervals that have the potential to improve flow characteristics, while concurrently highlighting intervals that are susceptible to targeted treatment.
This paper is structured to provide a comprehensive overview of the fracture treatment design process Dundar, et al. [6]. It commences with an elucidation of the problem at hand, followed by a concise summary of the data under consideration. Subsequently, the report delves into the models and methods that have been harnessed to tackle this intricate problem. The results and discussion section meticulously dissect the optimization of fracturing fluids, completion design, and the determination of injection rates. Finally, this paper serves as a valuable resource for petroleum engineers and researchers alike, offering profound insights into the complex world of fracture treatment design in vertical wells. By harnessing the collective knowledge and expertise showcased in the literature, it endeavors to illuminate the path towards achieving enhanced productivity indices while navigating the intricate challenges posed by natural fractures, anisotropy, and directional stress variations within oil reservoirs.
Methodology
The goal of this paper was to design a fracture treatment in a vertical well in an oil reservoir. The provided data was in the EFRAC input file in the LRC (linear gel.utef). The following parameters had to be optimized for the completion design:
- Injection rate
- Proppant specifications (proppant size and mass injected)
- Proppant loading
- Choice of the fracturing fluid
- Final fracture pumping schedule The completion design was optimized using EFRAC 3.3.0.0 software.
The first step was to select the best fracturing fluid by comparing the results of linear gel, slick water, and LPG [7]. The comparison was based on fracture half-length, fracture height, fracture width, fracture area, bottom hole pressure, surface pressure, and proppant concentration. Slick water was selected as the best fracturing fluid due to its optimal performance and evenly distributed proppant in the fractures. Next, the number of perforations was optimized by comparing 5, 10, 15, and 20 shot per foot. The comparison was based on fracture half-length, fracture height, fracture width, fracture area, bottom hole pressure, surface pressure, and productivity index [8]. 10 shots per foot was selected as the optimal perforation design due to its highest productivity index of 5.074. Finally, the perforation diameter was optimized by comparing 9/32, 3/8, 7/16, and 1/2 inches. The comparison was based on fracture half-length, fracture height, fracture width, fracture area, bottom hole pressure, surface pressure, and proppant concentration. 3/8 inches was selected as the optimal perforation diameter due to its highest productivity index.
Figures 1-44 provided in the original document were used to visualize the results of the optimization process.
Implementation of the Work
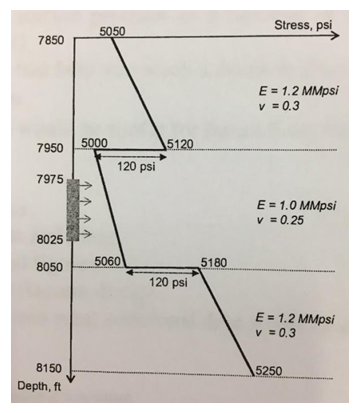
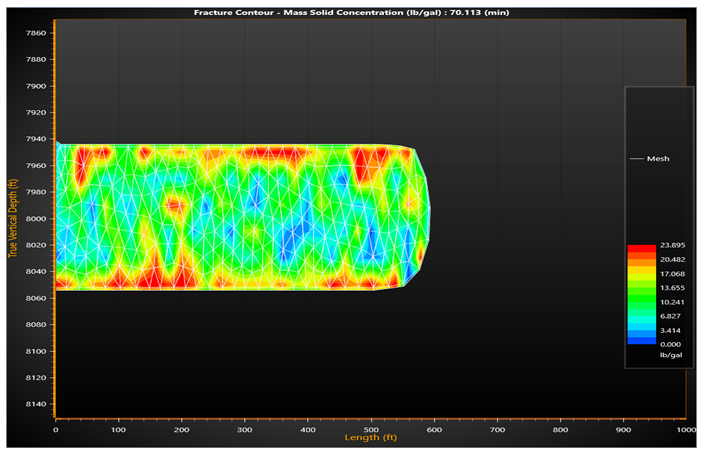
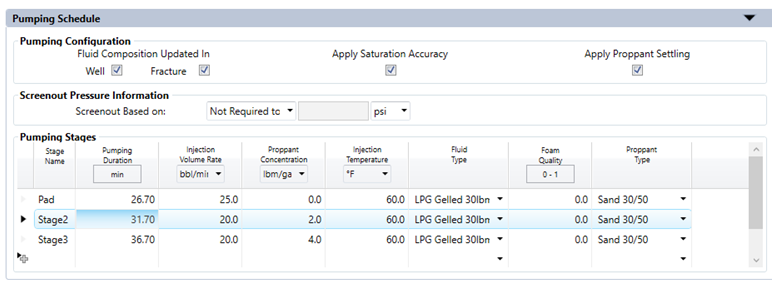
The dataset for the base case is provided as listed below in Table 1-4 and Figure 1. For the base case, linear gel is used as the injection fluid with given fluid properties. We have 3 stages with different pumping schedules, the first one being the pad stage. Reservoir parameters such as permeability and porosity are given as well. Several assumptions are made in this reservoir simulation. We assume the reservoir is homogeneous and the permeability is isotropic. We also assume a small pressure gradient near the wellbore.
| Reservoir Parameter | Value |
|---|---|
| Drainage area (acre) | 70 |
| Wellbore diameter (in) | 3.875 |
| Pay zone height (ft) | 100 |
| Reservoir Temperature (°F) | 180 |
| Permeability (mD) | 0.01 |
| Porosity (%) | 13 |
| Capillary pressure (psi) | 435 |
| Residual water saturation | 0.3 |
| Residual gas saturation | 0.25 |
| End-point permeability | 0.6 |
| End-point exponent | 2.5 |
Table 1: Basic reservoir properties.
| Pumping Schedule | Stage 1 | Stage 2 | Stage 3 | Pumping Schedule |
|---|---|---|---|---|
| Duration, min | 15 | 20 | 25 | Duration, min |
| Proppant loading, lbm/gal | 0 | 3 | 6 | Proppant loading, lbm/gal |
| Rate, BPM | 25 | 20 | 20 | Rate, BPM |
| Duration, min | 15 | 20 | 25 | Duration, min |
Table 2: Pumping schedule for all the fluid formulations.
| Fluid Property | Slick Water | Linear Gel | CO 2 | LPG | C0 -foam 0.3 2 | C0 -foam 0.7 2 | N -foam 2 0.3 |
|---|---|---|---|---|---|---|---|
| Polymer, lbm/gal | 0 | 30 | 30 | 30 | 30 | 30 | 30 |
| Density, lbm/ft3 | 62.4 | 62.4 | 52 | 33 | 59 | 55 | 31 |
| Flow behavior index | 1 | 0.508 | 0.8 | 0.8 | 0.508 | 0.508 | 0.508 |
| Flow consistency index, lbf-sn/ft2 * 103 | 0.018 | 7.3 | 0.5 | 0.3 | 7.3 | 30.2 | 30.2 |
| Viscosity at 100s-1, cp | 0.86 | 36 | 9.5 | 4.9 | 36 | 150 | 150 |
| Leak-off coefficient, ft/sqrt(min) * 103 | 2 | 0.5 | 0.5 | 0.5 | 0.2/0.04 | 0.15/0.08 | 0.15/0.08 |
Table 3: Frac fluid properties (evaluated at 110℉ and 5000 psi for the foam quality of interest).
| Frac Fluid Additives | Concentration1 |
|---|---|
| Biocide | 0.5 gpt |
| Surfactant | 2 gpt |
| Clay Stabilizer | 2 gpt |
| Friction Reducer | 3 gpt |
Table 4: Typical chemicals used in the experiments. 1Gpt: grams per tons (for ex. 10 gpt is 1%)
Frac Fluid Design
Firstly, we will delve into the comparison of fracking fluids, including their respective strengths and weaknesses. We will also explore the completion design, evaluating the performance of different materials used in the process. Additionally, we will discuss the rate of injection design, analyzing the impact of different injection rates on the overall efficiency of the project. Furthermore, this section will provide insights into the final optimized design that was achieved after a rigorous process of testing and analysis. We will also present the productivity index obtained from this optimized design, which can be used as a benchmark for future projects. Overall, this section serves as a detailed account of the results obtained from the project, highlighting the key factors that contributed to the final outcome and providing valuable information for future reference. In this design linear gel, slick water and LPG were compared to each other (Figures 2-7).
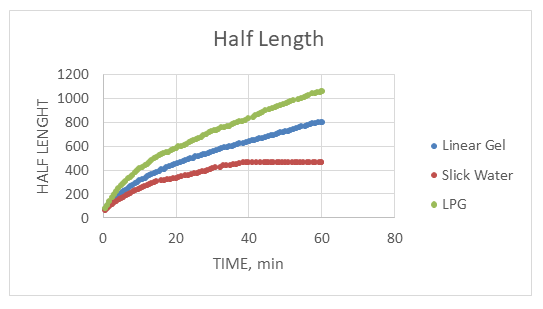
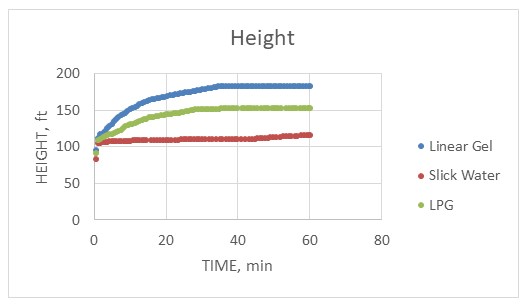
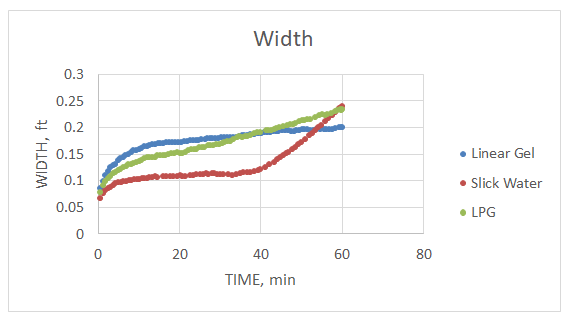
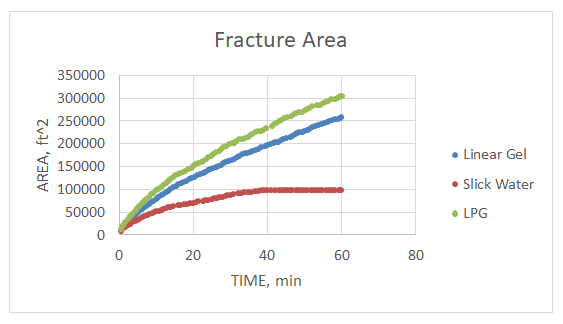
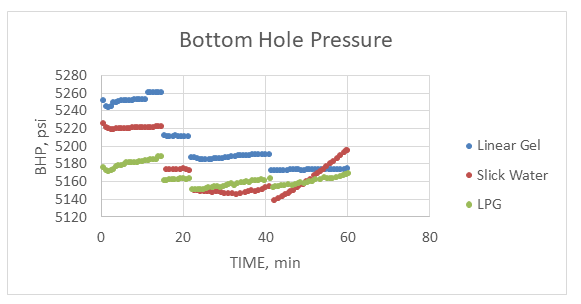
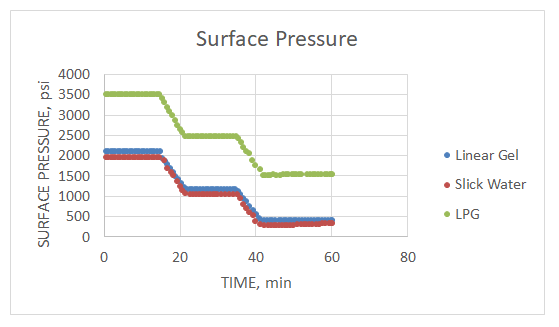
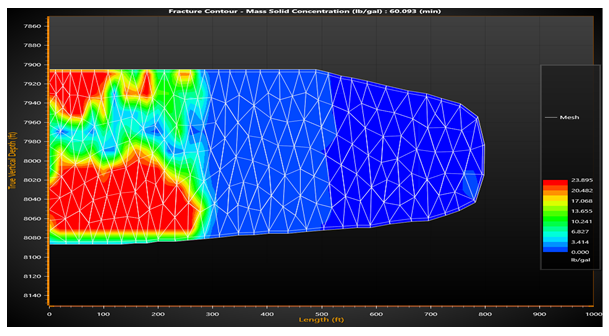
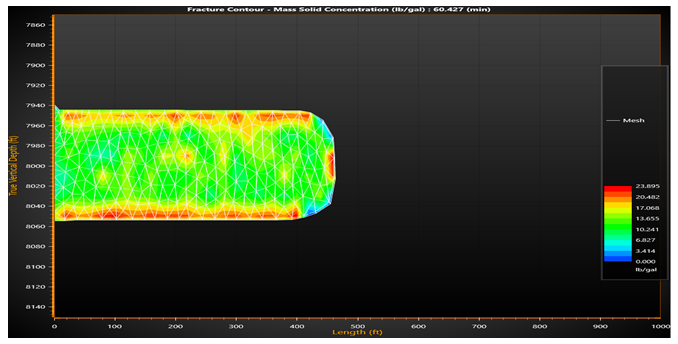
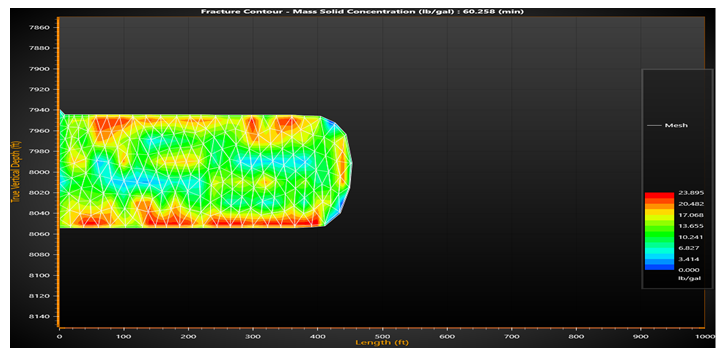
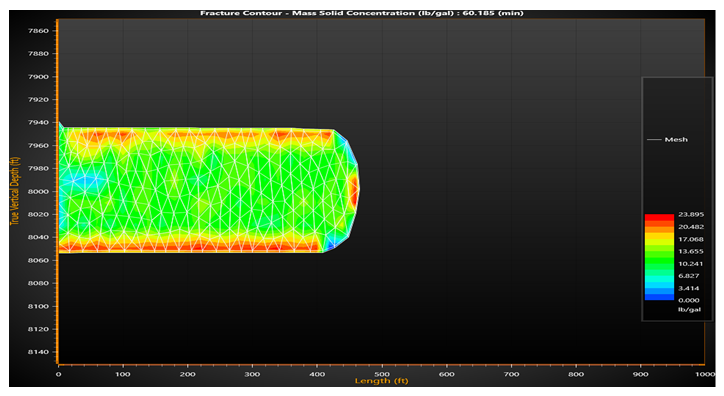
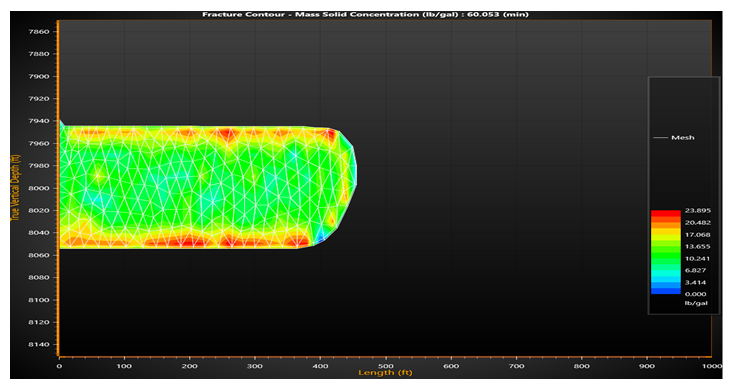
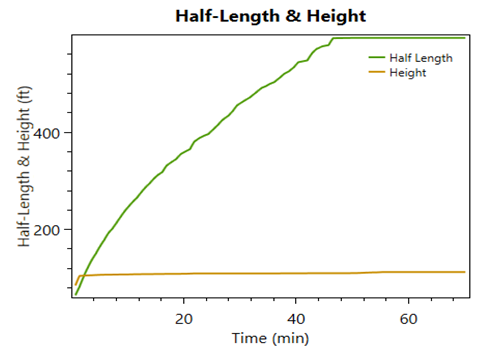
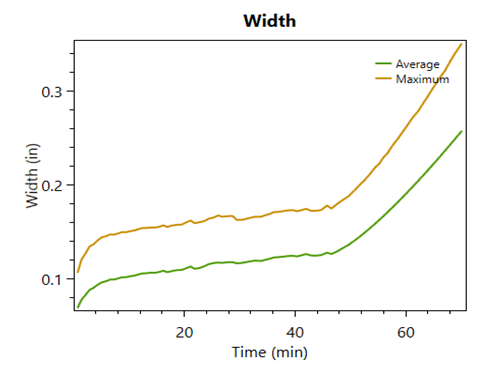
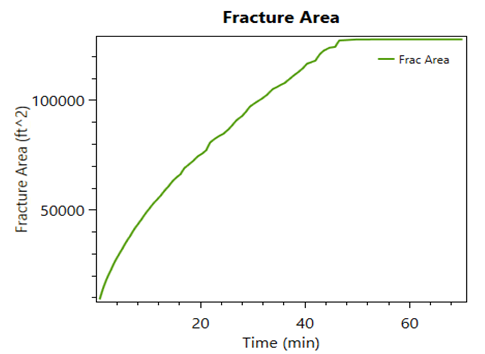
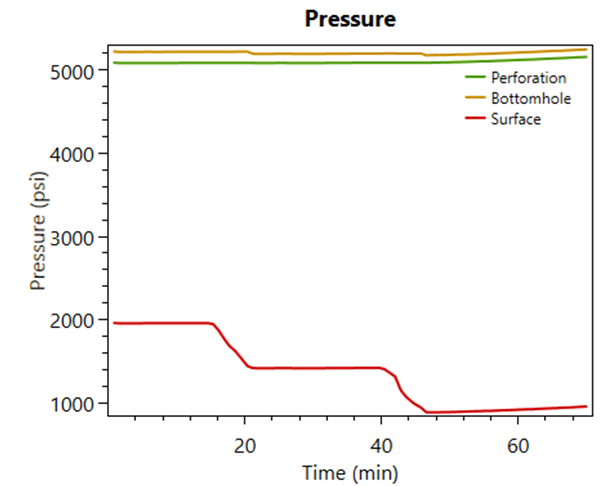
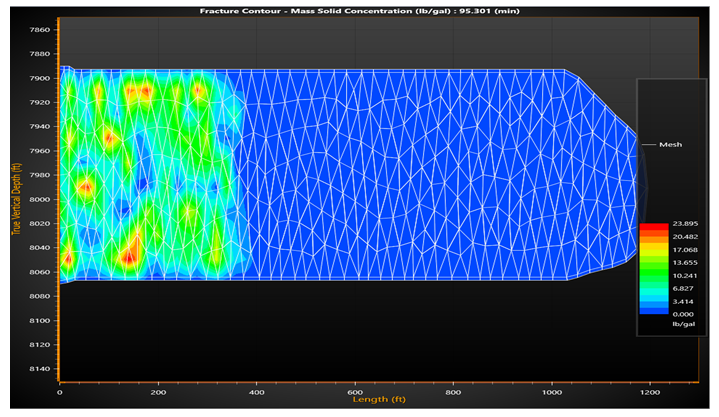
Among those fluids, slick water was selected owing to its optimum performance, including the lowest surface pressure (see Figure 7) and evenly distributed proppant in the fractures. Additionally, slick water has promising fracture width (see Figure 4) even though it has less fracture length and height (Figure 2 & 3) [9]. This is crucial for effective fracture stimulation, as fracture width plays a significant role in enhancing permeability and fluid flow. Several studies have explored frac fluid optimization and completion fluid design to optimize fracture width and achieve enhanced well performance [10, 11, 12, 13] Figure 8-10.


If the fracture extends in the vertical direction, it could exceed the fracture height and cause fractures to form in undesired layers, including above or below water zones. In this design, fracture width is preferred as a reference point for fracture dimensions, as it provides a more direct measure of the fracture’s ability to enhance permeability and fluid flow.
Completion Design
In this sub-section, we will evaluate the effect of the number of perforations and perforation diameter.
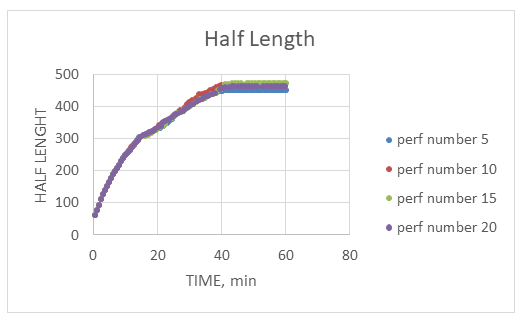
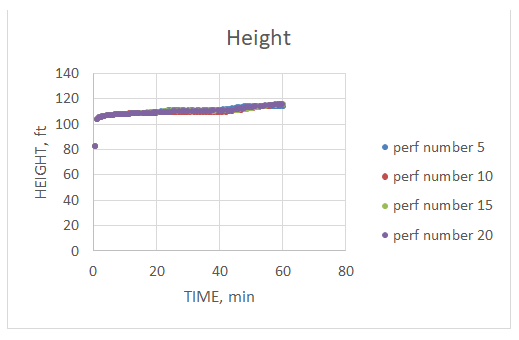
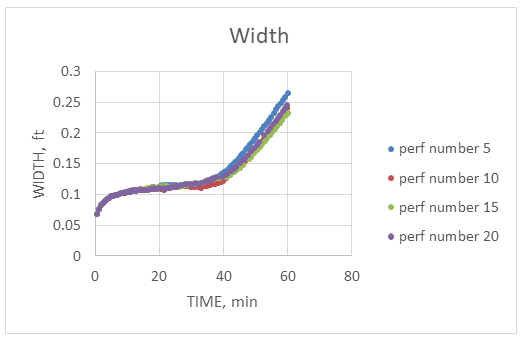
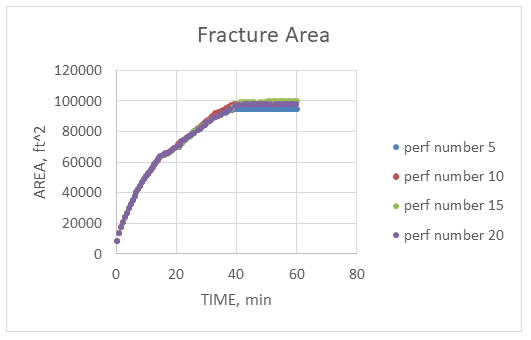
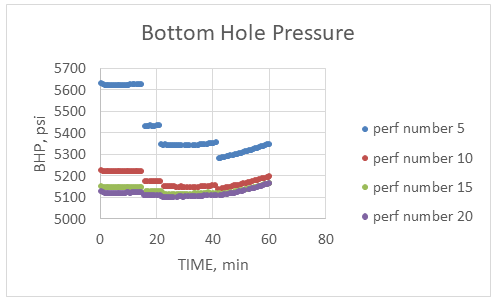
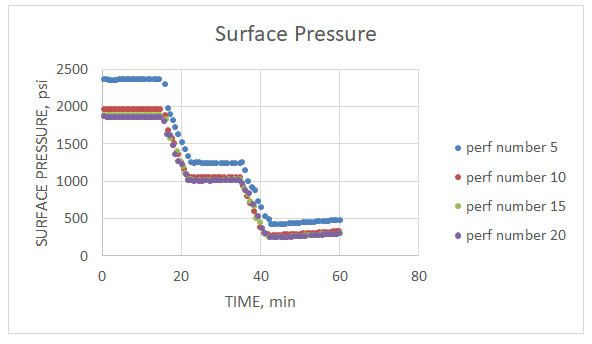
Number of Perforation: In this case, 4 different perforation (5, 10, 15, and 20 shot per foot) numbers were used to see its impact on the overall design. In this study, we sought to determine the optimal slick water fracturing fluid (SPF) value for a specific hydraulic fracturing operation. We evaluated four different SPF values: 5, 10, 15, and 20. The productivity index (PI), a measure of a well’s ability to produce hydrocarbons, served as the primary performance metric.
Our results revealed that the 10 SPF case yielded the highest PI, reaching a value of 5.074. This outcome is evident in Table 4, which summarizes the PI values for each SPF value. Across all SPF values, the fracture dimensions, including fracture length, width, and height, exhibited similar characteristics, as depicted in Figures 11-14. This suggests that the fracture network’s overall geometry remained consistent despite variations in SPF.
However, the surface pressure, the pressure required to inject the fracturing fluid into the formation, varied significantly among the different SPF values Figure 15. As shown in Figure 16, the surface pressure for the 5 SPF case was considerably higher than that for the 10, 15, and 20 SPF cases. This observation highlights the trade-off between maximizing PI and minimizing surface pressure. While lower SPF values may lead to higher PIs, they also demand higher surface pressures, which can increase operational costs and pose potential risks to wellbore integrity.
Based on these findings, we recommend employing an SPF value of 10 for this particular hydraulic fracturing operation. This choice strikes a balance between maximizing PI and maintaining a relatively low surface pressure. Utilizing a 10 SPF value effectively enhances well productivity while minimizing the associated operational costs and potential risks.
Our study provides valuable insights into the optimization of SPF values for hydraulic fracturing operations. However, further research is warranted to explore additional aspects of this complex process. Specifically, investigating the impact of SPF on fracture length and height could provide further guidance on maximizing fracture network effectiveness. Additionally, incorporating the cost of different SPF fluids into the optimization process would offer a more comprehensive approach to selecting the most economical and efficient option (Table 5).
Lastly, evaluating the influence of SPF on wellbore stability is crucial for ensuring long-term well integrity and optimal production performance. By understanding how SPF affects the wellbore’s ability to withstand the stresses induced by fracturing, operators can make informed decisions that minimize the risk of wellbore damage and maximize production longevity.
| Number of Perforations | Productivity Index, Dimensionless |
|---|---|
| 5 | 4.887 |
| 10 | 5.074 |
| 15 | 5.028 |
| 20 | 4.992 |
Table 6: Productivity index comparison for perforation numbers .
The expression adopted by Crump, et al. [14] for calculating perforation friction is:
2
0.2369 Q P N *D *C
ρ = (1) f 2 4 2 P d Where: Q: total flow rate (BPM) ρ: fluid density (lbm/gal) Np: number of perforations D: perforation diameter (inches) Cd: Coefficient of discharge (Refer to Table 6)
| Perforation diameter (in) | Cd |
|---|---|
| 9/32 (0.2813) | 0.5 |
| 3/8 (0.3750) | 0.5 |
| 7/16 (0.4375) | 0.6 |
| 1/2 (0.5000) | 0.6 |
Table 5: Discharge Coefficients [14].
Equation 1 shows that as the number of perforations double, friction will decrease by a factor of four, which causes less pressure loss. However, 10 SPF has slightly more surface pressure than 20 SPF which indicates that this behavior is not friction dominated. In this case, the productivity index has been used to select the optimum perforation design. Another possible explanation for not choosing 20 SPF might be that 20 SPF could cause burst failure in the tubing.
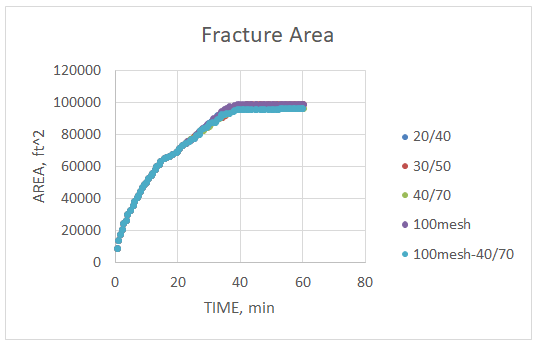
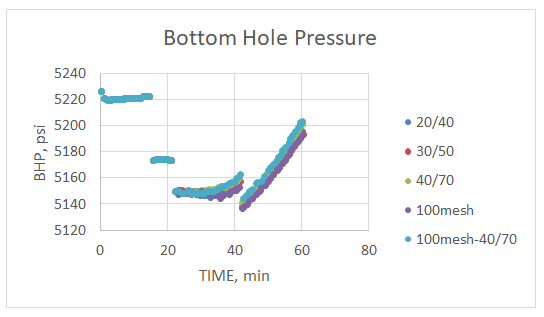
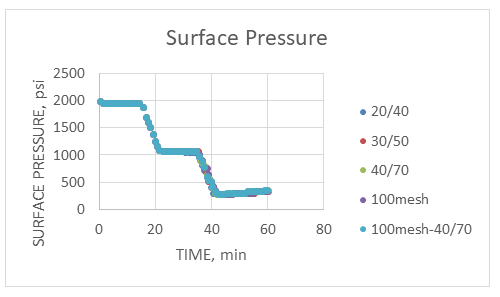
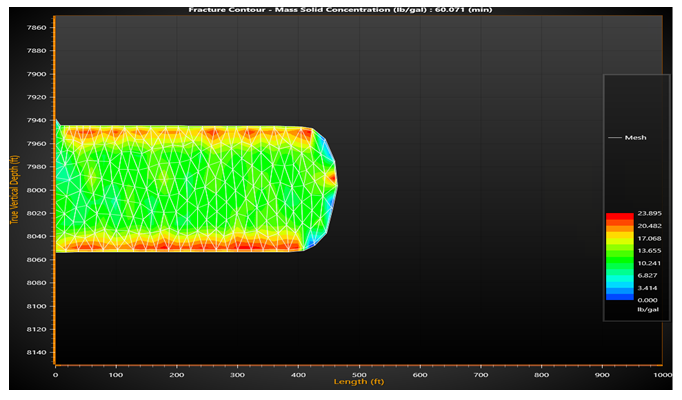
Proppant Size: In this design, we evaluated the performance of different proppant sizes to determine the optimum one. Proppants are granular materials that are injected into fractures during hydraulic fracturing operations to prop open the fractures and allow hydrocarbons to flow more freely. The size of the proppant can have a significant impact on the fracture dimensions and the overall performance of the well.
Figures 17-22 show that the proppant size had no significant impact on the fracture dimensions. This suggests that the fracture length, width, and height were not significantly affected by the size of the proppant. This is likely because the fractures were created by the hydraulic fracturing fluid, and the proppant simply served to keep the fractures open.

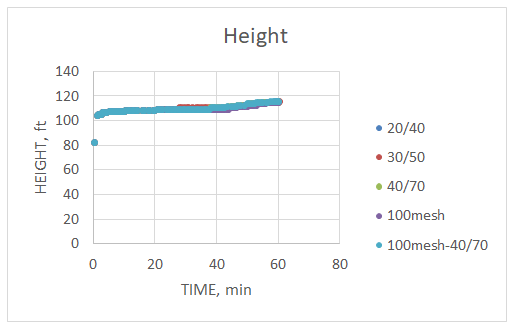
However, Figure 19 shows that the fracture width was relatively larger for the 20/40 proppant size. This suggests that the larger proppant particles were more effective at keeping the fractures open. This could be because the larger particles were less likely to be crushed by the stresses induced by the hydraulic fracturing process. Based on this observation, along with the productivity indexes in Table
6, we recommend using 20/40 proppants for this design. Productivity index (PI) is a measure of a well’s ability to produce hydrocarbons. Table 6 shows that the 20/40 proppant size had the highest PI. This suggests that the 20/40 proppants were the most effective at keeping the fractures open and allowing hydrocarbons to flow.
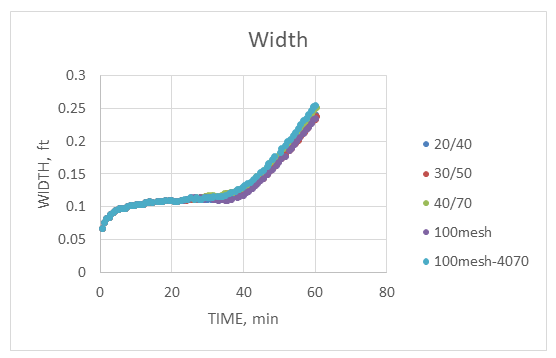
Overall, our findings suggest that the 20/40 proppant size is the optimum size for this design. This is because the 20/40 proppants were more effective at keeping the fractures open and had a higher PI than the other proppant sizes Figure 20-27.
| Proppant size | Productivity index |
|---|---|
| 20/40 | 5.074 |
| 30/50 | 5.072 |
| 40/70 | 4.971 |
| 100mesh | 5.061 |
| 100mesh-40/70 | 5.061 |
Table 7: Productivity index comparison for proppant size.
We tried pumping 100 mesh proppant for the first stage and then 40/70 size proppant for the next stage; however, it did not make any significant difference in productivity index. The best performance is obtained by using 20/40 size proppant.
Finalized Design
Preferred parameters for the final design are listed as follows: Fracking fluid: slick water Perforation diameter: 0.45 in Number of perforations: 10 Proppant size: 20/40 Injection rate: 25 BPM Duration for 3 stage: 15-25-30 minutes Proppant loading: 0-2-4 lbm/gal From this final design, productivity index obtained is 6.01, dimensionless Figure 28-32.
While optimizing the fracture parameter, LPG with the following design gives a productivity index of 8.957. Even though LPG gives a higher productivity index, the two main reasons why LPG was not chosen are cost and storage problems. The cost of LPG is around 2.038 USD/gallon [15] and water cost is around 1.50-3.0 USD per 1000 gallons [16].
Using those data, LPG is approximately 1000 times more expensive than water. Also, the storage of LPG for fracturing treatment is not feasible compared to slick water. Therefore, LPG is not preferred to use for the fracturing design because of those reasons Figure 33 and 34.
Conclusion and Recommendations
Using the EFRAC program, we formulated an optimal vertical well fracture treatment with a given base case. With the assumption that the reservoir is homogeneous and isotropic, the base case was optimized with various test cases. First, slick water was selected as the most optimal fracking fluid due to its low cost and ability to create fractures with higher widths. Second, a completion design was created including the number of perforations, perforation diameter, and rate of injection. Then we compared the optimized fracture length, fracture height, fracture width, fracture area, and the overall productivity index of each test case to the parameters of the base case to choose the best design. In the optimized final design, we used slick water as our fracking fluid, with a perforation diameter of 0.45 inches, 10 perforations, 20/40 proppant size, 25 BPM injection rate, 15-25-30-minute duration time, and 0-2-4 lbm/gal proppant loading rate. This final design resulted in a productivity index of 6.01, dimensionless. LPG was not selected as the optimum fracturing fluid because of its proppant distribution, high cost, and limited storage capacity [17]. The following are some additional comments: The effect of SPF on fracture length and height should be investigated further. The cost of different SPF fluids should be considered in the optimization process. The effect of SPF on wellbore stability should be evaluated.
References
-
Ifrene G, Irofti D, Ni R, Egenhoff S, Pothana P (2023) New Insights into Fracture Porosity Estimations Using Machine Learning and Advanced Logging Tools. Fuels 4(3): 333-353.
-
Ifrene GE, Irofti D, Khouissat A, Pothana P, Aihar A, et al. (2023) Fracture Roughness Characterization from 360 Unrolled Core Images in a Sandstone Reservoir Case Study Algeria Hassi Messaoud. 57th US Rock Mechanics/ Geomechanics Symposium, USA.
-
Abes A, Irofti D, Ifrene GE, Rasouli V, Djemai S (2021) The Impact of Geometric Attributes of Fractures on Fluid Flow Characteristics of Reservoir: A Case Study in Alrar Field, Algeria. ARMA US Rock Mechanics/Geomechanics Symposium.
-
Alpkiray M, Dundar EC (2023) A Glance on Hydraulic Fracturing: Benefits Concerns and Future. Science Journal of Energy Engineering 11(2): 19-25.
-
Irofti D, Ifrene GE, Aihar A, Bouabdallah N, Khouissat A, et al. (2023) Characterization of a Tight Gas Reservoir Using the Integration of Electrofacies and Fracture Aperture, Ahnet, Algeria. 57th US Rock Mechanics/ Geomechanics Symposium.
-
Dundar EC, Mengen AE, Mironov VS, Khlopkov A, Alagoz E (2023) An analytical study of hydraulic fracturing optimization for tight shale formation. 21th International Petroleum and Natural Gas Congress and Exhibition of Turkiye, Turkiye.
-
Zhao J, Ren L, Shen C, Li Y (2018) Latest research progresses in network fracturing theories and technologies for shale gas reservoirs. Natural Gas Industry B 5(5): 533-546.
-
Martin AN, Economides MJ (2010) Best Practices for Candidate Selection Design and Evaluation of Hydraulic Fracture Treatments. SPE Production and Operations Conference and Exhibition, Tunisia.
-
Wu K, Olson JE (2013) Investigation of Critical in Situ and Injection Factors in Multi-Frac Treatments: Guidelines for Controlling Fracture Complexity. SPE Hydraulic Fracturing Technology Conference, USA.
-
Alagoz E, Sharma MM (2021) Investigating Shale-Fluid Interactions and Its Effect on Proppant Embedment Using NMR techniques. 55th US Rock Mechanics/ Geomechanics Symposium, USA.
-
Alagoz E, Yaradilmis Y, Ozmen EO (2023) Laboratory tests on the design of fracturing fluids for Dadas Shale wells. TPAO R&D Center Report, pp : 1-27.
-
Alagoz E, Mengen AE, Yaradilmis Y (2023) Evaluation of XRD CEC and LSM Methods for Fracturing Fluid Optimization Experimental Findings. 21th International Petroleum and Natural Gas Congress and Exhibition of Turkiye, Turkiye, pp: 185.
-
Yaradilmis Y, Alagoz E (2022) Laboratory tests on the design of completion brine for Turkali-10 well. TPAO R&D Center Report.
-
Crump JB, Conway MW (1986) Effects of Perforation Entry Friction on Bottom Hole Treating Analysis. Society of Petroleum Engineers annual technical conference and exhibition, USA.
-
Texas Tribune (2019).
-
Zhao J, Shen C, Shen Y (2018) Latest research progresses in network fracturing theories and technologies for shale gas reservoirs. Natural Gas Industry B 5(5): 533-546.
- Nigeria’s Vulnerability in the Face of Global Energy Policy
- A Simulation Study of Investigation of Optimum Oil Production Performance by Applying Various Gas Injection Methods in Oil Reservoir
- Characterization of Permo-Triassic Reservoirs through Thermal Maturity Assessment of Westphalian Source Rocks in the Cheshire Basin
- Influence of Microwax on the Rheological and Thermal Behaviour of a Wax Crude Oil
- Real-Time Monitoring and Performance Optimization of Steam Injection in Heavy Oil Reservoirs Using Fiber Optic Sensing and Integrated Predictive Simulation Models
- Rapid On-Site Determination of the Total Petroleum Hydrocarbon Content of Soils by Handheld Fourier Transform Near-Infrared Spectroscopy: Development of a Global, Site- and Scanner- Independent Calibration Model