Comparative Study of CO2 Storage Capacity Estimation in Depleted Oil & Gas Reservoir: A Case Study in Vermillion Basin Gulf of Mexico
CO2 emissions rates have seen an exponential growth from the 19th century up till date, if no drastic measures and plans are implemented to prevent this exponential growth the consequence will be devastating. The notion of achieving net-zero greenhouse gas emissions gained prominence through the Paris Agreement, a groundbreaking accord reached at the United Nations Climate Change Conference. This agreement was devised to mitigate the impact of greenhouse gas emissions. To execute the net-zero CO2 emission plan, the USDOE has set a new goal to remove gigatons of carbon dioxide (CO2) from the atmosphere and durably store it for less than $100/ton of net CO2-equivalent. Making such a goal a reality requires an accurate estimation of CO2 storage capacity for the successful implementation of Carbon Capture and Storage (CCS) technologies, and the assessment of the impact of CCS to the reduction of CO2 emissions. Hence this paper serves as a template for accurately estimating CO2 storage capacity in depleted saturated oil reservoirs with initial gas cap using three approaches: Volumetric, Production and Correlation-based methods and compares the accuracy of the estimates. A case study was conducted on a depleted VR273_Q combination sand in the Vermillion Basin, Gulf of Mexico (GOM). The deterministic and stochastic (P50) CO2 storage capacity estimates from the Volume-based method are 1.21 million tonnes (Mt) and 1.23 Mt respectively, while the deterministic CO2 storage capacity estimates from the Production and Correlationbased method are 1.32 Mt and 1.41 Mt respectively. All three approaches showed similar results, with little deviations attributed to petrophysical uncertainties arising from data gaps i.e., absence of well logs to key wells. However, these uncertainties are captured by Stochastic (P90) CO2 storage capacity estimates of 1.47 Mt from the Volume-based method. Although the Correlation-based approach slightly overestimates the CO2 storage capacity, it can be used as a starting point for quick estimation as it only requires production data which are readily available on various databases for GOM. Finally, through this paper, opportunities for concerned agencies to make well-informed energy-related policies and business decisions are made possible.
Introduction
CO2 emissions are primarily caused by the combustion of fossil fuels, both in large combustion units like those used in electric power generation and in smaller, more dispersed sources like automobile engines and furnaces used in residential and commercial buildings. Some industrial and resource extraction processes, as well as open burning during land clearance, emit CO2. Global world CO2 emissions from fossil fuels in 1950 was about 6 billion tonnes of CO2 with Europe and United States accounting for more than 85% of emissions each year, but now emissions have skyrocketed to over 34 billion tonnes per year due to the rise in emissions in the rest of the world particularly in Asia, notably China and India. The US and Europe now account for just under one- third of emissions.
![Figure 1: Annual CO2 emission from fossil fuel [1].](/fulltextimages/11996/fig_1.png)
Due to changing global climates caused by the uncontrolled emissions of greenhouse gases (GHG), the United States Department of Energy, Policymakers both in the U.S and around the world are now encouraging the deployment of Carbon Capture and Storage (CCS) technology to help curb CO2 emissions from fossil fuels.
Global assessments of CO2 storage opportunities involving large volumes of CO2 storage have focused on the options of geological storage such as depleted oil and gas reservoirs, deep saline formations and coal beds etc [2, 3, 4, 5].
Depleted oil and gas reservoirs are one the most sorted candidates for geologic CO2 storage because most Oil and Gas fields and basins have been previously studied and some are currently being studied, hence there are rich databases to support CO2 storage studies. Studies show that the trap mechanisms of most depleted oil and gas reservoirs demonstrate structural integrity and safety as they have been able to keep the hydrocarbons for millions of years without leaks. Also, there are numerous reservoir engineering software that can readily be modified to monitor CO2 if stored in depleted oil and gas reservoirs. Finally, the economics of injecting CO2 into depleted oil and gas reservoirs are relatively cost-effective when compared to other storage options as there are existing infrastructure such as wells, pipelines, etc. to handle CO2 storage operations [6, 7].
Depleted oil and Gas CO2 storage sites can be located onshore or offshore; however, offshore storage sites have the advantages of lowered dangers of potential contaminating sources of water for drinking, reduced surface and mineral rights issues, and access to existing offshore infrastructure and pipeline transportation routes.
There are site selection criteria for geologic CO2 storage. Firstly, the storage formation has to be a seal mechanism and leak-free to prevent upward migration of CO2 to the surface thereby contaminating surface groundwater. The storage formation must be deep enough (> 800 m) to keep CO2 at a supercritical state as this allows for the storage of more CO2, and not exceeding 2500m for economic purposes. Also, the storage site of interest must be large enough to hold a sizable amount of injected CO2 [8, 9].
There is limited data on the assessment of CO2 storage capacity of depleted oil and gas fields, hence, this work will serve as a template for quick yet detailed and accurate estimates of CO2 storage capacity for potential depleted hydrocarbon sites. An accurate estimation of the storage capacity is required for the government’s energy- related policies and business decisions, the successful implementation of CCS technologies, and the assessment of the impact of CCS to the reduction of CO2 emissions.
In the following sections of this paper, an overview of the Vermilion basin in the Gulf of Mexico where potentially depleted oil and gas fields are located is presented. Methodologies for estimating CO2 storage capacity using volumetric, production, and correlation-based methods are also presented. A Case study for estimating CO2 Storage capacity in a depleted saturated oil reservoir with gas cap using all three methods is presented. Results comparing the estimates are made and finally, conclusion and recommendation are highlighted.
Field Overview Vermillion Basin, Gulf of Mexico
The Gulf of Mexico (GOM) is the third most prolific petroleum basin in the world formed because of the opening of the Atlantic Ocean. It is located at the southeast shores of the United States bordered by Texas, Louisiana, Mississippi, Alabama and Florida.
According to the Estimated Oil and Gas Reserves, Gulf of Mexico Region, December 31, 2019 report, there are a total of 1325 oil and gas fields in the federally regulated part of GOM with original reserves estimates of 26.77 bbl of Oil and 197.0 Tcf of gas. Cumulative Production from the fields accounts for 22.12 bbl of Oil and 190.9 Tcf of gas. There are 91l depleted fields which represent 68.8 percent of all fields and 414 active fields with estimated reserves of 4.65 bbl of Oil and 6.1 Tcf of gas [10].
Blocks in the Vermilion basin lie in the GOM approximately 102 miles from the coast of Louisiana in the continental shelf (Figure 2) below. The deposition of river-fed sediments on enormous volumes of a mobile substrate greatly influences the structural nature of GOM (salt). Growth faults and roll- over anticlines describe the trapping style in the Vermilion Basin.
![Figure 2: Location of Vermilion basin in GOM [11].](/fulltextimages/11996/fig_2.png)
The Vermillion basin is predominantly a gas basin with pockets of oil and combination reservoirs (Oil reservoirs with initial gas cap). According to the (OWL, 2022) database, the basin contains 12 actively producing fields and 75 already depleted fields and has so far produced a cumulative oil production of 592MMbbl and a cumulative gas production of 16,751 Bcf. This makes it a prospective candidate for underground carbon sequestration.
Static CO2 Storage Capacity Estimation Approach
In this study, three approaches will be undertaken to estimate the static CO2 storage capacity of the depleted hydrocarbon reservoir. They include the. 1. Volumetric-based approach.
2. Production-based approach. 3. Correlation-based approach.
Volumetric Based Approach for CO2 Storage Capacity Estimation
The USDOE proposed a volumetric approach for CO2 storage capacity estimation. The volumetric estimate is based on the industry standard method for calculating OOIP and OGIP by the formation volume factor [12].
The volumetric-based equation is given below as.
$$ G _ {C O _ {2}} = A h \phi \left(1 - S _ {w i}\right) B \rho_ {C O _ {2}} E _ {R o i l / g a s} \tag {1} $$
2 CO G is the mass of CO2 (tonnes), A is the reservoir area (m_2), h is the net thickness (m), φ is the average effective porosity (fraction), _Swi is the initial water saturation (fraction), Boi is the initial oil or gas formation volume factor (m3/m3), Bgi is the initial gas formation volume factor (m3/m3), Where,
2 CO ρ is the standard CO2 density (Kg/_m_3), ERoil/gas is the CO2 storage efficiency (fraction), representing a fraction of the total pore volume from which oil and/or gas was produced and can be supplied with CO2. The CO2 storage efficiency can be calculated using reservoir simulations or CO2 - Enhanced Oil Recovery experience [12].
Another Volumetric method for estimating CO2 storage capacity in depleted hydrocarbon reservoirs was proposed by CSLF [13]. Petrophysical properties such as reservoir net thickness, porosity, water saturations, etc., depending on the field or basin of study can be obtained from publicly available databases such as Offshore Well and Lease (OWL), Strategic Online Natural Resources Information System (SONRIS), and Bureau of Ocean Energy Management (BOEM) etc.
The geothermal gradient of the reservoir of study can be estimated from the well log data, pressure gradient can be estimated from Bottom Hole pressure (BHP) reports, and they are available in public data sources. If temperature and pressure data at targeted depth for the given reservoir are not available as input for CO2 density estimation using the Peng-Robinson equation of state [14] or Modified Peng- Robinson equation, the temperature and pressure gradient can be utilized. There are also correlations for estimating CO2 density as a function of depth and temperature [15, 16] (Figure 3) below.
![Figure 3: Density as CO2 by depth and temperature [15].](/fulltextimages/11996/fig_3.png)
In order to store CO2 in a number of depleted gas, oil, and combination reservoirs in the Gulf of Mexico, [7] carried out CO2 Injection modeling tests. The improved quantification of the CO2 storage amounts was addressed using the numerical simulator Cozsim and its graphical user interface Cozview, which were created [7]. Cozsim is a completely implicit, finite difference-based, extended black oil reservoir flow simulator that was created by NITEC LLC with support from the Department of Energy. It features three phases (oleic, gaseous, and aqueous), four components (oil, water, hydrocarbon gas, and carbon dioxide).
For the majority of the sands, 20,000 MSCF/d was the maximum carbon dioxide injection rate per well. This injection rate has no effect on the reservoir’s eventual CO2 storage volume; rather, it merely affects how long it takes for the reservoir to become full with carbon dioxide. These restrictions were applied to an estimated case until the minimum field injection rate limitation of 100 MSCF/d was met.
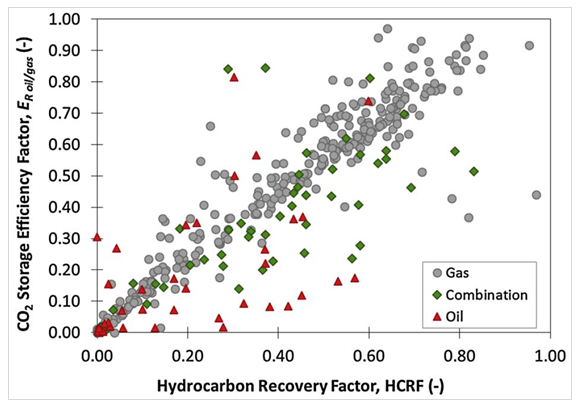
Consequently, a plot of CO2 storage efficiency was developed, ERoil/gas against Hydrocarbon recovery factor (HCRF) see Figure 4. E oil/gas is calculated using the USDOE equation (1).
Mathematically, HCRF is expressed as
( ) ( ) ( ) ( )
. . 5.615 . . 5.615
Cum Oil Prod B Cum FreeGas Prod B HCRF OOIP B OGIP B
$$ \gamma = \frac {\left(C u m. O i l P r o d . \times B _ {0 i} \times 5 . 6 1 5\right) + \left(C u m. F r e e G a s P r o d . \times B _ {0 i}\right)}{\left(O O I P \times B _ {0 i} \times 5 . 6 1 5\right) + \left(O G I P \times B _ {g i}\right)} $$
0 i gi
0 i gi (2) Where OOIP is the Original Oil initially in place (STB), OGIP is the Original Gas initially in place (SCF), Boi and Bgi is the initial oil or gas formation volume factor (RBBL/STB and RCF/SCF), For the oil reservoirs, the HCRF is equal to the ratio of cumulative produced oil and OOIP as OGIP and Bgi are “0”. For the gas reservoirs, OOIP and Boi are “0,”.
Production Based Approach for CO2 Storage Capacity Estimation
The Carbon Sequestration Leadership Forum (CSLF) proposed a production-based approach for CO2 storage capacity estimation which is based on OGIP for gas reservoirs and OOIP for oil reservoirs at surface conditions [12, 13].
The Production-Based equation given below as.
R OOIP G V V B ρ = − +
f CO CO wi wp oi
2 2 oil For Oil,
(3) and Gas, ( ) 2 2 1 * gas CO CO f IG gi G R F OGIP B ρ = − (4)
2_l_ CO G is the mass of CO2 (Tonnes), OGIP is the Original Gas Initially in Place (m_3), OOIP is the Original Oil Initially in Place (_m_3), _Bgi/Boi is the initial gas and oil formation volume factor (_m_3/_m_3), Where,
2 CO ρ is the standard CO2 density (Kg/ m_3), _FIG is the fraction of injected gas (fraction), Vwi is the volume of injected water (m3), Vwp is the Oil or gas recovery factor (fraction). FIG is “0” when there is no injected gas. Similarly, Vwi and Vwp are both “0” when there is no injected or produced water.
Correlation-Based Approach for CO2 Storage Capacity Estimation
Based on the simulation of CO2 injection volumes for all 359 gas, 34 oil, and 68 combination sands in GOM, [7] developed a Production-CO2 Storage Correlation for estimating CO2 storage capacity in depleted gas, Oil, and combination reservoirs in GOM. Strong correlation with R-Squared value of above 0.96 is seen across the different reservoir types in Figure 5 below.
The slope of the correlation line is different for each reservoir type. This is due to the high compressibility and mobility of gas when compared to oil. As more CO2 injection was observed in gas sands for the same production volumes, whereas CO2 storage volumes decreased from gas to combination sands, and combination sands to oil sands.
![Figure 5: Production-CO2 Storage Correlation for GOM Fields [7].](/fulltextimages/11996/fig_5.png)
Equations (5-8), explain the relationship between the slopes, dependent and independent variables, and their units of conversion.
From the correlation, y, the dependent variable, is the CO2 storage volume at standard conditions (BSCF), and x the independent variable, is the cumulative production at reservoir conditions (MMRCF).
- Gas Sands CO2 Storage Vol. (BSCF) = 0.4299 × Cum. Production (MMRCF). (5)
- Oil Sands CO2 Storage Vol. (BSCF) = 0.2619 × Cum. Production (MMRCF). (6)
- Oil and Gas Combination Sands CO2 Storage Vol. (BSCF) = 0.3397 × Cum. Production (MMRCF). (7) Equation (8) below converts CO2 storage volume at standard conditions from BSCF to MMtons or Mt.
CO2 Storage mass. (MMtons) = 0.0575 × CO2 Storage Vol. (BSCF). (8)
Case Study
The volumetric, production, and correlation-based methods were used in estimating the CO2 storage capacity in VR273_Q, a depleted combination reservoir i.e., a saturated oil reservoir with initial gas cap in the Vermillion Basin, GOM. Table 1 below obtained from the 2019 sand report of BOEM database under the Geology and Geophysics (G&G) section, shows 7 wells that drained the VR273 sands.
| Boem Field | Lease | Area Code | Block | Well | Pic | Well | Play | Sand | Oper Res | |
|---|---|---|---|---|---|---|---|---|---|---|
| VR273 | G14412 | VR | 273 | 1.77E+11 | S01 | A001 | PLL-P1 | Q | ANGB “Q” | |
| VR273 | G14412 | VR | 273 | 1.77E+11 | S01 | A001 | PLL-P1 | Q | ANGB “Q” | |
| VR273 | G23829 | VR | 272 | 1.77E+11 | S01 | B001 | PLL-P1 | Q | R SAND | |
| VR273 | G23829 | VR | 272 | 1.77E+11 | S01 | B002 | PLL-P1 | Q | Q SAND | |
| VR273 | G23829 | VR | 272 | 1.77E+11 | S01 | C001 | PLL-P1 | Q | Q Sand | |
| VR273 | G24872 | SM | 102 | 1.77E+11 | S03 | A001 | PLL-P1 | Q | Q | |
| VR273 | G24872 | SM | 102 | 1.77E+11 | S01 | A006 | PLL-P1 | Q | Q2 Sand |
Table 1: Well information for the VR237_Q sands [10].
The VR273_Q production, sand and fluid properties obtained from the BOEM database are presented in Tables 2,3 respectively. Additional digital well log data from some of the wells in table 1 above were obtained from the OWL database. Petrophysical estimates were made from available well logs using Techlog petrophysical software, to help capture wide ranges of sand and fluid uncertainties of VR273_Q during volume calculations. Uncertainty analysis capturing the ranges of some of the rock and fluid properties were entered in the crystal ball software for stochastic volume estimates.
| for header rows and for data cells. Use for bold text within cells. Preserve empty cells. Return ONLY the HTML , no other text. | for header rows and for data cells. Use for bold text within cells. Preserve empty cells. Return ONLY the HTML , no other text. | for header rows and for data cells. Use for bold text within cells. Preserve empty cells. Return ONLY the HTML , no other text. | ||||
|---|---|---|---|---|---|---|
| BOEM Reported Reservoir and Fluid Parameters | Sand, VR273_Q | VR273_Q Properties | Low Case | Base Case | High Case | Units |
| OOIP (MMSTB) | 26.34 | Gas Cap Area | 1,341,780 | 1,412,400 | 1,483,020 | m² |
| OGIP (BSCF) | 15.35 | Gas Cap Height | 6.89 | 7.26 | 7.62 | m |
| Cumulative oil Production (MMSTB) | 1.92 | Oil Rim Area | 1,464,805 | 1,541,900 | 1,618,995 | m² |
| Cumulative gas Production (BSCF) | 9.61 | Oil Rim Height | 10.63 | 11.19 | 11.75 | m |
| Subsea depth, SS (ft) | 4087 | Porosity | 0.29 | 0.34 | 0.37 | fraction |
| Total average net thickness (ft) | 30.54 | Saturation | 0.15 | 0.2 | 0.3 | fraction |
| Total Area (acres) | 730 | Bₐi | - | 0.0062 | - | m³/m³ |
| Oil total thickness (ft) | 36.71 | Bₐi | - | 1.177 | - | m³/m³ |
| Oil total area (acres) | 381 | |||||
| Gas total thickness (ft) | 23.81 | |||||
| Gas total area (acres) | 349 | |||||
| Porosity (frac) | 0.34 | |||||
| Residual Water Saturation (frac) | 0.2 | |||||
| Permeability (mD) | 1558 | |||||
| Initial Pressure (Psia) | 2034 | |||||
| Initial Temperature (°F) | 115 | |||||
| Pressure Gradient (psia/ft) | 0.494 | |||||
| Temperature gradient (°F/100ft) | 1.101 | |||||
| Initial gas formation volume factor, Bgi (RCF/SCF) | 0.0062 | |||||
| Initial oil formation volume factor, Boi (RBBL/STB) | 1.177 | |||||
| Gas Oil ratio, GOR (MSCF/STB) | 4.636 |
Table 2: Production, rock, and fluid Properties for the VR273_Q sand [17].
| VR273_Q Properties | Low Case | Base Case | High Case | Units | |
|---|---|---|---|---|---|
| OOIP (MMSTB) | 1,341,780 | 1,412,400 | 1,483,020 | m² | |
| OGIP (BSCF) | 6.89 | 7.26 | 7.62 | m | |
| Cumulative oil Production (MMSTB) | 1,464,805 | 1,541,900 | 1,618,995 | m² | |
| Cumulative gas Production (BSCF) | 10.63 | 11.19 | 11.75 | m | |
| Subsea depth, SS (ft) | 0.29 | 0.34 | 0.37 | fraction | |
| Total average net thickness (ft) | 0.15 | 0.2 | 0.3 | fraction | |
| Total Area (acres) | - | 0.0062 | - | m³/m³ | |
| Oil total thickness (ft) | - | 1.177 | - | m³/m³ |
Table 3: Uncertainty Range of VR273_Q structural and reservoir properties.
Results
Volumetric-Based Approach
Parameters for input into the USDOE equation i.e Equation (1) such as gas cap area and thickness, oil area and thickness, oil and gas formation volume factors, porosity and residual water saturations data are obtained from Table 2.
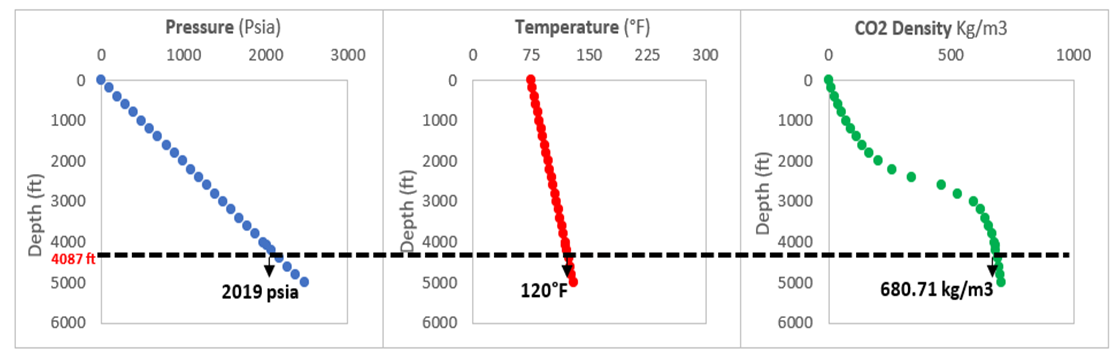
Pressure and temperature values of about 2019 psia and 120°F were calculated at the average reservoir depth of 4087ft using pressure and temperature gradients of 0.494 psia/ft and 1.101°F/100ft respectively obtained from Table 2.
The Modified Peng-Robinson equation [18] uses the estimated pressure and temperature as input was used to estimate the CO2 density of 680.17 Kg/_m_3. see Figure 6 below, for graphical analysis of temperature, pressure, and CO2 density.
CO2 Storage efficiency is obtained from Figure 4: the HCRF vs CO2 storage Efficiency factor plot for GOM reservoirs. From Equation 2, Hydrocarbon Recovery Factor (HCRF) was estimated to be 0.27. The low HCRF value is due to the very low recovery from the Oil portion of the reservoir caused by most of the production of the Gas cap and solution gas in the depletion drive mechanism. The CO2 storage Efficiency factor was found to be 0.32.
Using the volumetric-based equation from Equation (1), and corresponding reservoir parameters from Table 2, the deterministic Static CO2 storage capacity was determined to be 1.21 million Tons (Mt). To obtain a Stochastic Static CO2 storage capacity, we considered the range of porosity values from 0.29 to 0.37 and saturation range of 0.15 to 0.3 as seen by wells in the VR273_Q sand. The Area and height of the VR273_Q oil and Gas cap were varied by a ±5% from its base value in order to account for structural uncertainty see Table 3 for details. The estimated P90, P50 and P10 Stochastic Static CO2 storage capacity mass obtained are 1.04, 1.23 and 1.47 million Tons (Mt), respectively. Table 4 summarizes the estimated deterministic and Stochastic Static CO2 Storage capacity.
| Results | Units | |||
|---|---|---|---|---|
| Deterministic | 1.21 | Mt | ||
| Stochastic | P90 | P50 | P10 | |
| 1 | 1.2 | 1.5 | Mt |
Table 5: VR273_Q Estimated CO2 Storage Capacity Volume (Volume-based approach).
Production-Based Approach
Parameters for input into the CSLF equations i.e Equations (3-4) such as Original Gas Initially in Place (OGIP), Original Oil Initially in Place (OOIP) [19], oil and gas formation volume factors data are obtained from Table 2. Recovery factors for oil and gas cap segment of the reservoir are estimated to be 7.3% and 62.5% respectively, standard CO2 density has been estimated to be 680.71 Kg/_m_3. Fraction of injected gas, volume of injected and produced water are set to is “0”. Finally, the deterministic Static CO2 storage capacity was determined to be 1.32 million Tons (Mt).
Correlation Based Approach
Firstly, the cumulative oil and gas production at surface conditions from the Table 2 were both converted to reservoir conditions by multiplying with their respective formation volume factors [20]. Next their units were both harmonized into reservoir cubic feet (MMRCF) and summed up. The total cumulative oil and gas produced at reservoir conditions was estimated to be 72.3 MMRCF.
Secondly, Equation (7) from the Oil and gas combination sands correlation in Figure 2, transforms the total cumulative oil and gas produced at reservoir conditions of 72.3 MMRCF to CO2 storage volume at surface conditions of 24.56 BSCF. Finally, CO2 storage volume of 24.56 BSCF is converted to mass in tonnes using eqs,8. CO2 storage capacity was estimated to be 1.41Mt (million tonnes).
Discussion of Results
The three approaches for estimating the CO2 storage for depleted saturated oil reservoir with gas cap) shows similar results. The table below shows summaries of the results Table 5.
| Method | Deterministic (Million tonnes) | Stochastic (P50) (Million tonnes) |
|---|---|---|
| Volumetric - based | 1.21 | 1.23 |
| Production -based | 1.32 | - |
| Correlation- based | 1.41 | - |
Table 4: Summary of Estimated CO2 Storage Capacity Volume.
The CO2 storage capacity estimated by the production– based and correlation-based methods deviates from the estimated Volumetric Methods (P50) by 7.3% and 14.6% respectively. These deviations could be attributed to the petrophysical uncertainties arising from data gaps i.e., absence of well logs for some key wells. The volumetric estimation is subject to some degree of uncertainty due to the stochastic P50 approach. It takes into account a range of potential parameter values, recognizing the inherent variability in geological settings. Although the Correlation- based approach tends to overestimate volumes, estimates are reasonably accurate and use only production data. Reservoir and fluid properties data are not required for its use [21, 22].
Limitations
- Water encroachment from an aquifer was not considered in this study. Potential water encroachment could ultimately affect the CO2 storage Efficiency factor.
- Production estimates may change for wells that are producing at the time of this research. However, at the time of the computations, only about 7% of the oil in place had been recovered. Consequently, it could be necessary to modify the production statistics; nevertheless, this does not significantly impair the projected capacity of CO2 at any given moment.
- The simulated model is limited to fields that are in GOM.
Conclusion
Three methods for estimating Static CO2 storage Capacity namely the Volumetric, Production and Correlation methods were applied to the depleted combination reservoir (Oil with Gas cap) of VR273_Q in the Vermillion Basin, GOM. The estimates showed similar results, with little deviations attributed to petrophysical uncertainties arising from data gaps i.e., absence of well logs to key wells [23]. Material Balance concept is established between the estimated CO2 storage capacity by the Volumetric-based approach and Production-based approach as both methods show very similar results. The correlation-based method is very easy to use and relies only on production data, however it tends to overestimate the CO2 storage capacity slightly. Through this study, opportunities for accurately finding and quantifying potential CO2 storage sites within the GOM and worldwide abound. Finally, an accurate estimation of the storage capacity is required for the government’s energy-related policies and business decisions, the successful implementation of CCS technologies, and the assessment of the impact of CCS to the reduction of CO2 emissions etc.
Recommendations
Researchers can utilize this work as a template for quick yet detailed and accurate estimates of CO2 storage capacity using all three methods for potential depleted hydrocarbon sites.
The Correlation-based approach is reasonably accurate and can be used in the absence of reservoir and fluid properties data (only production data are needed). The Correlation-based approach used in this study is fitted for depleted gas, oil, and combination reservoir fields in Gulf of Mexico (GOM), researchers can focus on developing regional correlations for estimating CO2 storage capacity from other underground CO2 storage sources. Properties of depleted reservoirs frequently vary spatially. Refinement of storage capacity estimations can be achieved by accounting for these heterogeneities using advanced geological models. Additionally, Injecting CO2 may result in pressure variations and possible seismic hazards. For safe and efficient storage, geomechanical studies and wellbore integrity evaluations are essential.
Acknowledgement
We want to give our gratitude to Dr Fathi Boukadi for providing the necessary foundation to this work and for supervising this work and ensuring that it became a success and We also want to thank our colleagues for their useful discussions that helped to shape our thought in the work.
Conflict of Interest
The authors declare that they have no known competing financial interests or personal relationships that could have appeared to influence the work reported in this paper.
References
-
(2022) Our World in Data.
-
Stevens SH, Kuuskraa VA, Gale J, Beecy D (2001) CO2 injection and sequestration in depleted oil and gas fields and deep coal seams worldwide potential and costs. Environ Geosci 8(3): 200-209.
-
Gallo Y, Couillens P, Manai T (2002) CO2 sequestration in depleted oil or gas reservoirs. SPE International Conference on Health, Safety and Environment in Oil and Gas Exploration and Production, Kuala Lumpur, Malaysia.
-
Qi R, LaForce TC, Blunt MJ (2009) Design of carbon dioxide storage in aquifers. Int Journal Greenh Gas Cont 3(2): 195-205.
-
Ennis KJ, Paterson L (2003) Role of convective mixing in the long-term storage of carbon dioxide in deep saline formations. SPE J 10(3): 349-356.
-
Benson SM, Cook P (2005) Underground Geological Storage. Intergovernmental Panel on Climate Change Special Report on Carbon Dioxide Capture and Storage, pp: 196-276.
-
Agartan E, Gaddipati M, Yip Y, Savage B, Ozgen C (2018) CO2 storage in depleted oil and gas fields in the Gulf of Mexico. International Journal of Greenhouse Gas Control 72: 38-48.
-
Orr MF (2009) CO2 capture and storage: are we ready. Energy Environ Sci 2(5): 449-458.
-
Gasda SE, Bachu S, Celia MA (2004) Spatial characterization of the location of potentially leaky wells penetrating a deep saline aquifer in a mature sedimentary basin. Environ Geol 46(6-7): 707-720.
-
OCS Report BOEM (2021-052) Deepwater Gulf of Mexico.
-
OCS Report BOEM (2016-057) Deepwater Gulf of Mexico.
-
Cantucci B, Buttinelli M, Procesi M, Sciarra A, Anselmi M (2016) Algorithms for CO2 Storage Capacity Estimation: Review and Case Study. In: Vishal V, et al. (Eds.), Geologic Carbon Sequestration. Springer Cham, pp: 21-44.
-
CSLF (2008) Comparison between methodologies recommended for estimation of CO2 storage capacity in geological media.
-
Peng DY, Robinson DB (1976) A new two-constant equation of state. Industrial & Engineering Chemistry Fundamentals 15(1): 59-64.
-
(2022) Sintef Petroleum Research.
-
IEA GHG (2009) CO2 Storage in depleted gas fields. Global CCS Institute.
-
(2022) Bureau of Ocean Energy Management, pp: 1-27.
-
Span R, Wagner W (1996) A new Equation of State for Carbon Dioxide Covering the Fluid Region from Triple Point Temperature to 1100 K at Pressures up to 800 MPa. J Phys Chem Ref Data 25(4): 1509- 1596.
-
Dismukes DE, Zeidouni M, Zulqarnain M, Hughes R, Hall K, et al. (2019) Integrated Carbon Capture and Storage in the Louisiana Chemical Corridor, pp: 1-25.
-
(2022) Offshore Well and Lease.
-
Kimberly G (2010) Carbon sequestration atlas of United States and Canada. 3rd(Edn.), US Department of Energy Office of Scientific and Technical Information.
-
IPCC (2005) IPCC Special Report on Carbon Dioxide Capture and Storage. Working Group III of the Intergovernmental Panel on Climate Change. In: Metz BO, et al. (Eds.), Cambridge University Press, USA, pp: 1-442.
-
Cook PJ (1999) Sustainability and nonrenewable resources. Environ Geosci 6(4): 185-190.
- Nigeria’s Vulnerability in the Face of Global Energy Policy
- A Simulation Study of Investigation of Optimum Oil Production Performance by Applying Various Gas Injection Methods in Oil Reservoir
- Characterization of Permo-Triassic Reservoirs through Thermal Maturity Assessment of Westphalian Source Rocks in the Cheshire Basin
- Influence of Microwax on the Rheological and Thermal Behaviour of a Wax Crude Oil
- Real-Time Monitoring and Performance Optimization of Steam Injection in Heavy Oil Reservoirs Using Fiber Optic Sensing and Integrated Predictive Simulation Models
- Rapid On-Site Determination of the Total Petroleum Hydrocarbon Content of Soils by Handheld Fourier Transform Near-Infrared Spectroscopy: Development of a Global, Site- and Scanner- Independent Calibration Model