Shale Characterization Methods Using XRD, CEC, and LSM: Experimental Findings
Shale characterization is essential for understanding its potential as a hydrocarbon reservoir and for optimizing hydraulic fracturing operations. In this study, we evaluate the effectiveness of three methods for shale characterization: X-ray diffraction (XRD), cation exchange capacity (CEC), and linear swell meter (LSM). The study was conducted on a set of shale samples from a specific location. The samples were analyzed using XRD to determine their mineralogy, CEC to measure their ion exchange capacity, and LSM to assess their swelling properties. The results indicate that Clay stabilizers and KCl salt together perform much better. The concentrations of different additives can have a positive/negative effect on swelling. CEC values can be determined for each formation with the statistical method determined by using XRD results. Overall, the study highlights the potential of using a combination of XRD, CEC, and LSM for comprehensive shale characterization.
Introduction
Fracturing fluids, also known as fracking fluids, are liquids used in the process of hydraulic fracturing. They are injected into rock formations at high pressure to create fractures, which allow for the extraction of natural gas and oil [1, 2, 3, 4, 5, 6, 7]. Fracturing fluids typically consist of water, sand, and chemicals. The water helps to create and propagate the fractures, while the sand acts as a proppant to keep the fractures open [8, 9, 10, 11, 12]. The chemicals are added for various purposes, such as to reduce friction, prevent bacterial growth, and control the pH of the fluid [13, 14, 15, 16]. The composition of the fracturing fluid can vary depending on the specific characteristics of the rock formation and the type of hydrocarbon being extracted. Rock-fluid and fluid-fluid interactions have been studied by many researchers before [17, 18, 19, 20, 21]. The fracturing fluid additives used in this study
- are biocide, surfactant, friction reducer, and clay stabilizer.
- The abbreviations of the chemicals used are given in Table
- 1. The general properties of these additives are given below, respectively.
- Abbreviations
- Fluid
- Concentration
- DI
- DI Water
- 98-99%
- TAP
- Tap Water
- 98-99%
- S2
- Surfactant
- 0.1-0.5%
- FR3
- Friction Reducer
- 0.1-1%
- CSTAB2
- Clay Stabilizer
- 0.1-1%
- CIDE
- Biocide
- 0.01-0.1%
Table 1: Frac fluids chemicals.
Biocides are added to hydraulic fracturing fluids to kill or inhibit the growth of microorganisms that can be present in the rock formations. These microorganisms can consume the nutrients in the hydraulic fracturing fluid, which can cause the fluid to become less effective. They can also produce gases that can increase the pressure in the fractures, which can cause them to close. Additionally, they can cause corrosion in the pipelines and other equipment used in the hydraulic fracturing process. Biocides are added to the fluid to kill or inhibit the growth of these microorganisms, which helps to maintain the effectiveness of the fluid and prevent damage to equipment.
Surfactants are used in hydraulic fracturing fluids as they reduce the surface tension between the fluid and the rock, allowing the fluid to more easily flow into the fractures in the rock. They also help to prevent the fractures from closing after the fluid is injected, which helps to keep the fractures open and increases the effectiveness of the hydraulic fracturing process.
Friction reducers, also known as viscosity reducers, are added to hydraulic fracturing fluids to decrease the fluid’s resistance to flow, allowing it to move more easily through the fractures in the rock. This in turn allows the fluid to be pumped into fractures at a higher rate, increasing the efficiency and effectiveness of the hydraulic fracturing process. Additionally, friction reducers can also help to reduce the amount of energy required to pump the fluid into the fractures, which can lower costs and reduce the environmental impact of the process.
Clay stabilizers, also known as clay inhibitors, are added to hydraulic fracturing fluids to prevent the clays in the rock from swelling and closing fractures created during the hydraulic fracturing process. These clays can absorb water and increase in volume, which can cause fractures to close, reducing the effectiveness of fracturing process. Clay stabilizers work by altering properties of clay minerals, inhibiting their ability to absorb water, and maintaining fractures open. By preventing clays from swelling, clay stabilizers help to keep fractures open and increase the effectiveness of fracturing treatment.
Methodology
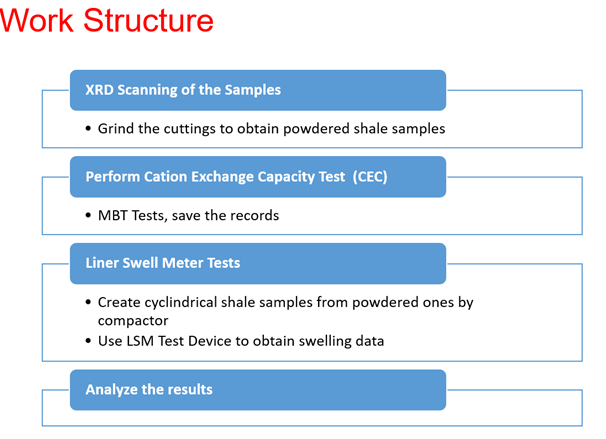
XRD, CEC and LSM tests were carried out, respectively. Each step was carried out in the procedure described below and the experiments were completed (Figure 1).
X-Ray Diffraction (XRD)
XRD is a technique used to determine the crystal structure of a material. It is based on the interaction of X-rays with the atoms in a crystal, which causes X-rays to be scattered in many directions. Pattern of these scattered X-rays can be used to determine the arrangement of atoms in the crystal. XRD is used in a variety of fields, including materials science, chemistry, and mineralogy, to identify and study the crystal structures of materials, such as minerals, metals, and polymers. It is also used to determine the purity, crystallinity, and defects of a material. Cutting samples taken from the wells, which are in the hydraulic fracturing program for XRD bulk powder mineral, and clay mineral analyses. The samples ground with Retsch RS-200 vibratory disc mill to have bulk powder and then representatively selected and plated for the XRD bulk powder analyses. After the bulk XRD analyses, two glass slides were prepared from each powdered sample for clay fraction analysis by using the “smear mount method” described in Moore and Reynolds [22]. After the completion of analyses of air-dried slides, same slides left in the 60°C ethylene glycol vapor bath for 2.5 hours and then analyzed. The other slides heated up to 540°C for 2.5 hours and then analyzed. The semi-quantitative XRD bulk powder and clay mineral analyses performed under conditions given below:
- Generator : Rigaku D/Max-2200 Ultima
- X-ray Tube : Cu
- Voltage : 40 kV
- Current : 20 mA
- Wavelength : (CuKα1) 1.54059 Angstrom
- Scan Speed : 1°/min.
- Software : MDI Jade 7.0 The X-ray diffractograms interpreted based on the Inorganic Crystal Structure Database (ICSD) of International Center for Diffraction Data (ICCD) by using MDI’s “Jade 7.0” software. The outputs of the XRD analysis evaluated according to profile-based matching of software and reference intensity ratios (RIR) by using “Easy Quant” patch of the software. The relative abundances of bulk and clay minerals in samples were determined as weight percentages are given on Table 2.
| XRD Bulk Powder Minerology (wt%) | XRD Clay Minerology(wt%) | Total % | CEC. (meq/100g) | |||||||||||||
|---|---|---|---|---|---|---|---|---|---|---|---|---|---|---|---|---|
| Quartz | Feldspar | Calcite | Dolomite | Pyrite | Barite | Siderite | Gypsum | Total Clay+Mica | Illite-Mica | Smectite | Kaolin | Chlorite | Mixed-Layer Illite- Smectite | |||
| sample-1 | 19 | 2 | 0 | 8 | 2 | 6 | 0 | 0 | 63 | 28 | 1 | 20 | 10 | 4 | 100 | 8 |
| sample-2 | 23 | 2 | 1 | 2 | 2 | 0 | 4 | 0 | 66 | 16 | 1 | 37 | 12 | 0 | 100 | 6 |
| sample-3 | 33 | 7 | 6 | 6 | 3 | 2 | 0 | 0 | 43 | 19 | 1 | 16 | 6 | 1 | 100 | 5 |
| sample-4 | 26 | 4 | 9 | 3 | 4 | 4 | 0 | 0 | 50 | 30 | 2 | 10 | 5 | 3 | 100 | 4 |
| sample-5 | 39 | 5 | 8 | 7 | 4 | 0 | 0 | 0 | 37 | 29 | 1 | 3 | 1 | 3 | 100 | 3 |
| sample-6 | 46 | 4 | 11 | 0 | 3 | 6 | 0 | 0 | 30 | 18 | 1 | 6 | 4 | 1 | 100 | 1,5 |
| sample-7 | 34 | 4 | 10 | 2 | 0 | 0 | 0 | 3 | 47 | 15 | 0 | 19 | 4 | 10 | 100 | 6,2 |
| sample-8 | 40 | 5 | 8 | 2 | 0 | 0 | 1 | 4 | 40 | 23 | 0 | 8 | 7 | 2 | 100 | 2,5 |
| sample-9 | 33 | 5 | 0 | 21 | 0 | 0 | 1 | 5 | 35 | 21 | 0 | 8 | 4 | 2 | 100 | 2 |
| sample-10 | 36 | 0 | 23 | 3 | 7 | 0 | 0 | 0 | 31 | 12 | 0 | 12 | 6 | 1 | 100 | 3,5 |
| sample-11 | 21 | 0 | 35 | 14 | 4 | 0 | 1 | 0 | 25 | 7 | 0 | 9 | 6 | 2 | 100 | 3 |
| sample-12 | 22 | 0 | 33 | 6 | 6 | 0 | 0 | 0 | 33 | 19 | 1 | 10 | 2 | 1 | 100 | 3,5 |
| sample-13 | 16 | 0 | 48 | 10 | 4 | 0 | 4 | 0 | 18 | 3 | 0 | 7 | 3 | 5 | 100 | 5 |
| sample-14 | 34 | 0 | 13 | 6 | 6 | 0 | 1 | 0 | 40 | 25 | 0 | 9 | 4 | 2 | 100 | 3 |
| sample-15 | 21 | 0 | 2 | 41 | 3 | 0 | 0 | 0 | 33 | 17 | 1 | 9 | 2 | 5 | 100 | 3 |
| sample-16 | 31 | 13 | 12 | 4 | 4 | 0 | 1 | 0 | 35 | 25 | 0 | 7 | 2 | 1 | 100 | 2 |
| sample-17 | 25 | 0 | 15 | 16 | 5 | 0 | 3 | 0 | 36 | 17 | 0 | 8 | 8 | 3 | 100 | 4 |
| sample-18 | 23 | 4 | 17 | 34 | 1 | 0 | 0 | 0 | 21 | 12 | 0 | 4 | 3 | 2 | 100 | 2,6 |
| sample-19 | 35 | 41 | 1 | 4 | 3 | 0 | 0 | 0 | 16 | 8 | 0 | 4 | 4 | 0 | 100 | 3,5 |
| sample-20 | 30 | 8 | 3 | 7 | 10 | 0 | 2 | 0 | 40 | 22 | 1 | 10 | 7 | 1 | 100 | 3 |
Table 2: XRD Analysis Results of Cutting Samples.
Based on the XRD results of the samples, quartz and clay minerals are dominant mineral types in all samples. Calcite, dolomite and feldspar are common and close to the original abundances of the XRD results of cutting samples of these wells that have presented in previous studies. In terms of clay mineral content, Illite and smectite, which has the highest swelling potential, are the most abundant clay types with minor amounts of kaolin, chlorite and mixed-layer Illite- smectite minerals.
Cation Exchange Capacity (CEC)
CEC is the total capacity of a rock to hold exchangeable cations. The higher CEC value, the more the shale sample tends to exchange cations, which increases shale swelling. CEC is measured in milli-equivalents (meq) of methylene blue dye adsorbed per 100 g dry clay. According to API RP 13B- 1 [23] standard, methylene blue capacity of a water-based fluid is an indication of the amount of reactive clays present as determined by methylene blue test. The methylene blue capacity provides an estimate of the total cation exchange capacity of the drilling cuttings. The test for Methylene blue capacity of cuttings performed according to API RP 13I [24] procedure, which shows the methodology below. Organic materials, if present in the sample, destroyed by oxidation with hydrogen peroxide. The sample is titrated with standard methylene blue solution until adsorptive capacity is satisfied.
CEC Steps
- Drill cuttings are grinded.
- Grinded cuttings dried for CEC tests.
- 25 cc %2 Tetra Sodium Pyrophosphate solution added to erlenmeyer.
- 1 gram of cutting sample added to erlenmeyer.
- Erlenmeyer is magnetically stirred and boiled.
- After 10 minutes boiling, 15 cc %3 Hydrogen Peroxide and 1 cc 5N Sulfuric Acid added to solution and boiled 10 minutes more.
- Erlenmeyer kept cool.
- Methylene Blue (MB) solution started adding to erlenmeyer.
- Clay mineral with absorbed MB dropped to Whatman No.1 filtrate paper with a pipette.
- MB solution continued adding up to observing the full- saturated blue circle and turquoise ring near the blue circle.
- Test repeated again in ten minutes later.
If turquoise ring occurs again, test is completed.
CEC results for all samples illustrated in Table 2. CEC values of the samples vary from 1.5 meq/100 gr to 8 meq/100 gr. Based on these results, reactivity of cutting samples are about 1/9 or 1/10 less than Sodium Montmorillonite Bentonite clay which has CEC with 70-130 meq/100 gr according to literature [26] in Table 3.
| Clay Mineral | CEC, (meq/100 gr) |
|---|---|
| Montmorillonite | 70-130 |
| Vermiculite | 100-200 |
| Illite | Oct-40 |
| Chlorite | Oct-40 |
| Attapulgite-Sepiolite | Oct-35 |
| Kaolinite | 15-Mar |
Table 3: CEC Values of Clay Minerals [26].
Linear Swell Meter (LSM)
LSM device used for determining shale hydration or swelling by measuring the expansion just in vertical axis of radially confined sample plugs, which exposed to HVFR fracturing fluids. Testing procedure of LSM test is not exist in API Specifications or Recommended Practice documents as a standard procedure. Therefore, performed experimental test results used for comparisons between candidate fluids. Due to the nature of the experimental application and multiple components availability, measurement inconsistencies may occur in LSM tests. Maximum effort and consideration has made to minimize the measurement inconsistencies and to provide high accuracy, high precision and standardization in all LSM tests.
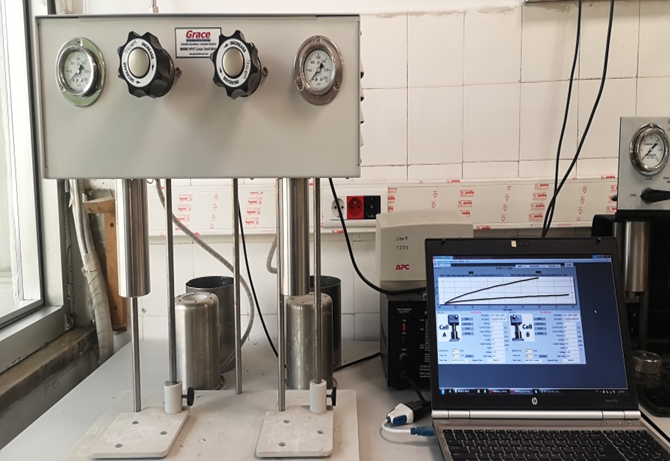
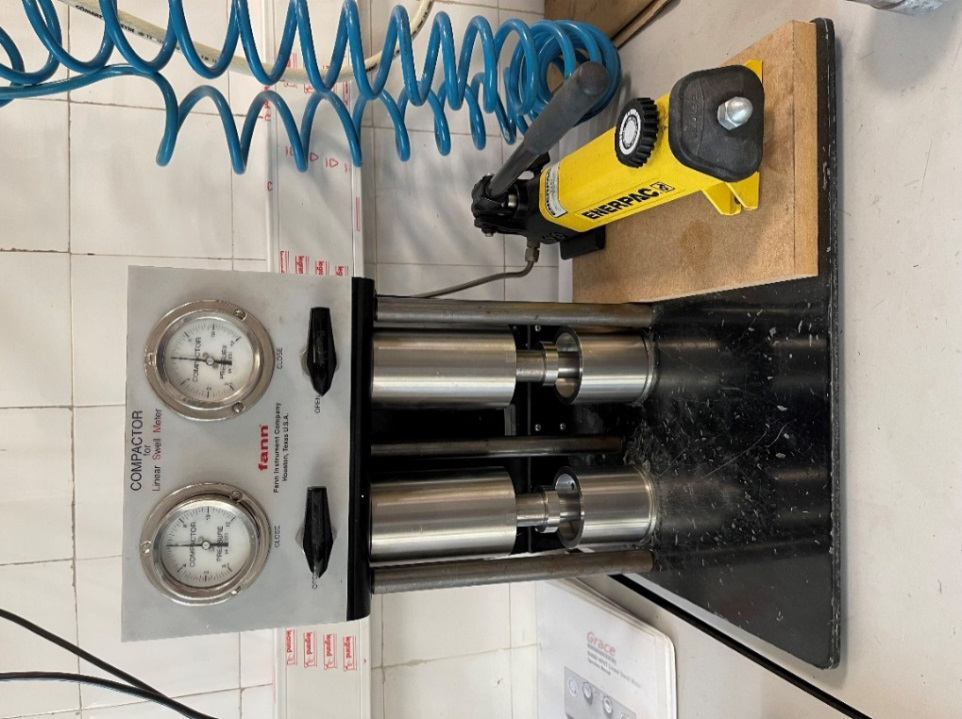
Grace Instrument M4600 HPHT LSM equipment used to perform the tests, which is an automated, dual core, high pressure and high temperature linear swell meter as seen in Figure 2. Dual compactor was also used to create cylindrical plugs from ground samples by applying 6,000-psi pressure for 3-hours shown in Figure 3. M4600 includes a windows based software for data acquisition. Real-time data displayed along with customized charts during a test. Test data exported to Microsoft Excel for reporting after a test is completed.
All LSM tests conducted at ambient temperature. Results recorded as plots of swelling percent versus time in minutes. These tests provide a graphical comparison of multiple inhibitive fluids simultaneously. The M4600 is composed of two independent pressure cells: Cell A and Cell B (Figure 4). Each cell has its own controls, and one can get them worked either individually or simultaneously.
![Figure 4: ** Pressure Cell Components [26].](/fulltextimages/11997/fig_4.png)
Figure4: Pressure Cell Components [26].
Each pressure cell assembly is comprised of the following components.
- Sample Cup A Sample Cup B
- Wafer Holder A Wafer Holder B
- LVDT sensor tip A LVDT sensor tip B
- Bottom Plate A Bottom Plate B
- Steel Rod with Top Plate A Steel Rod with Top Plate B M4600 apparatus uses a LVDT (Linear Variable Differential Transformer) sensor, which detects mechanical linear movement as displacement occurs and converts it to electrical signals. Contact displacement sensors based on this method read changes in the shape of the target by converting it into electrical signals. These requests and guidance include which reservoir sample to test and which brine composition to use. Testing procedure of LSM Test is below.
LSM Steps
- Drill cuttings are grinded.
- Grinded cuttings dried for Linear Swell Meter tests.
- 10.5-gr sample poured into the steel cylinder to create the plug. The steel cell is hit manually on a hard surface, allowing air between the particles to escape and the first compaction.
- Top and bottom acrylic spacers used to compress the cutting particles.
- Plugs created by applying 6,000-psi for 3-hours with compactor pistons.
- Prior to every test, Grace Instrument M4600 HPHT LSM equipment calibration is done by using steel spacers which have exact length of 0.40-in, 0.65-in and 0.90-in for both Cell A and Cell B.
- The height of the plugs measured with a caliper manually.
- Plugs placed in the LVDT sensors and bottom plate tightened.
- LVDT sensor tightened to LSM device.
- The length of the plug, the tested solution information for Cell A and Cell B, and the material information for the plug defined to the LSM device.
- 80 ml of solutions poured to pressure Cell A and Cell B. Test started before introducing liquid sample with the plug.
- As soon as test started, pressure cell screwed into the LSM device. Pressure Cell already covers the LVDT sensor in this position.
- Swelling and hydration between solution and plug starts immediately.
Swelling percentage vs time displayed in real time graph on computer.
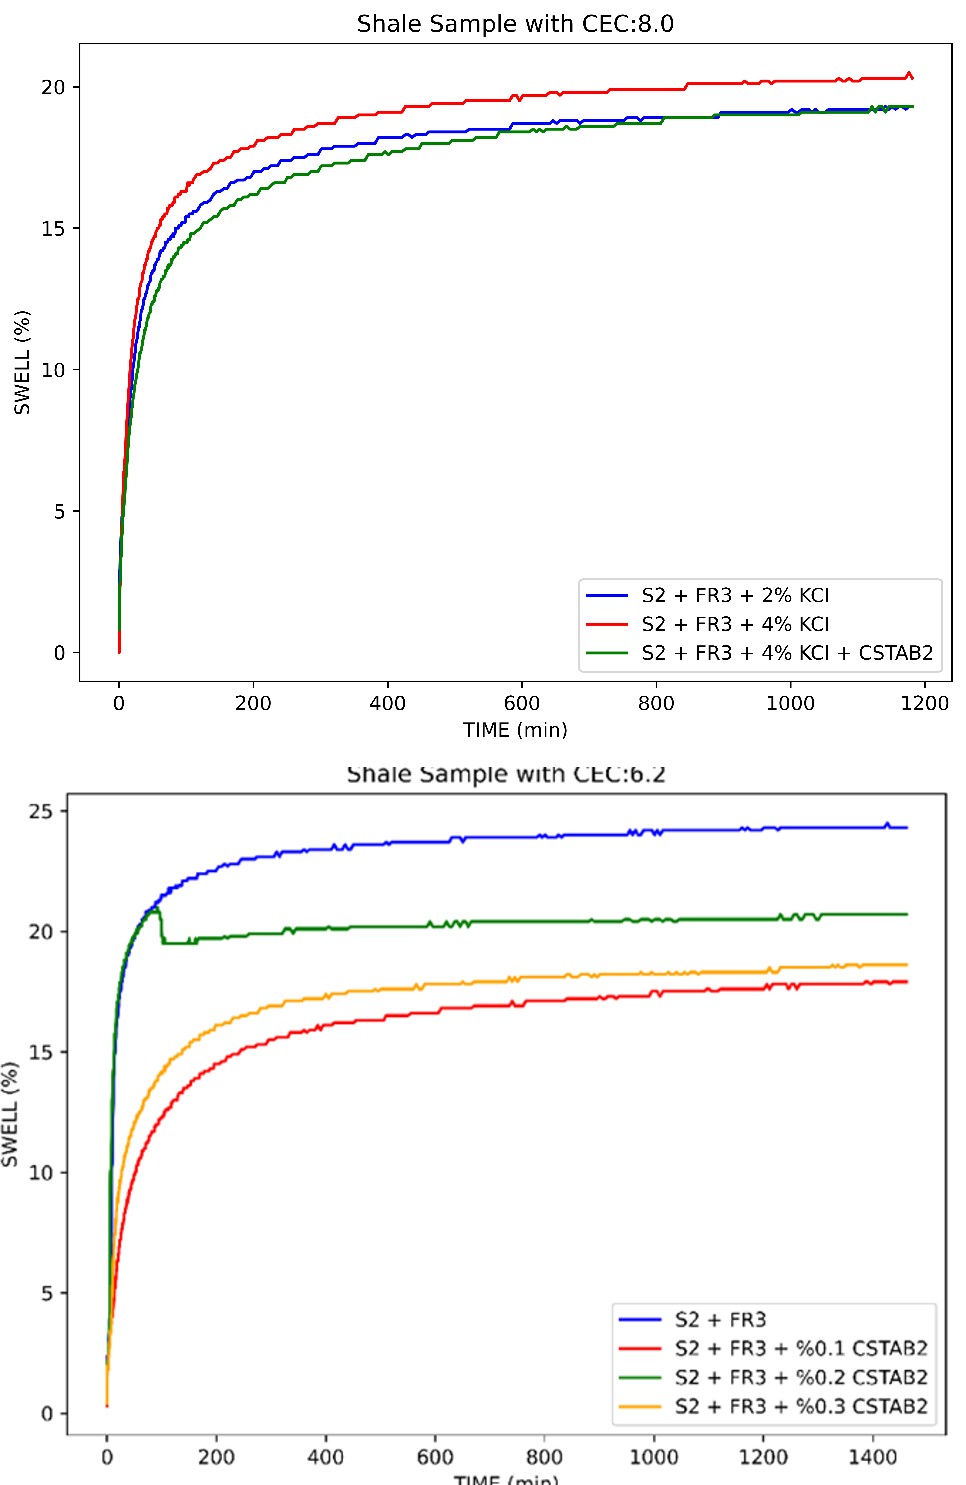
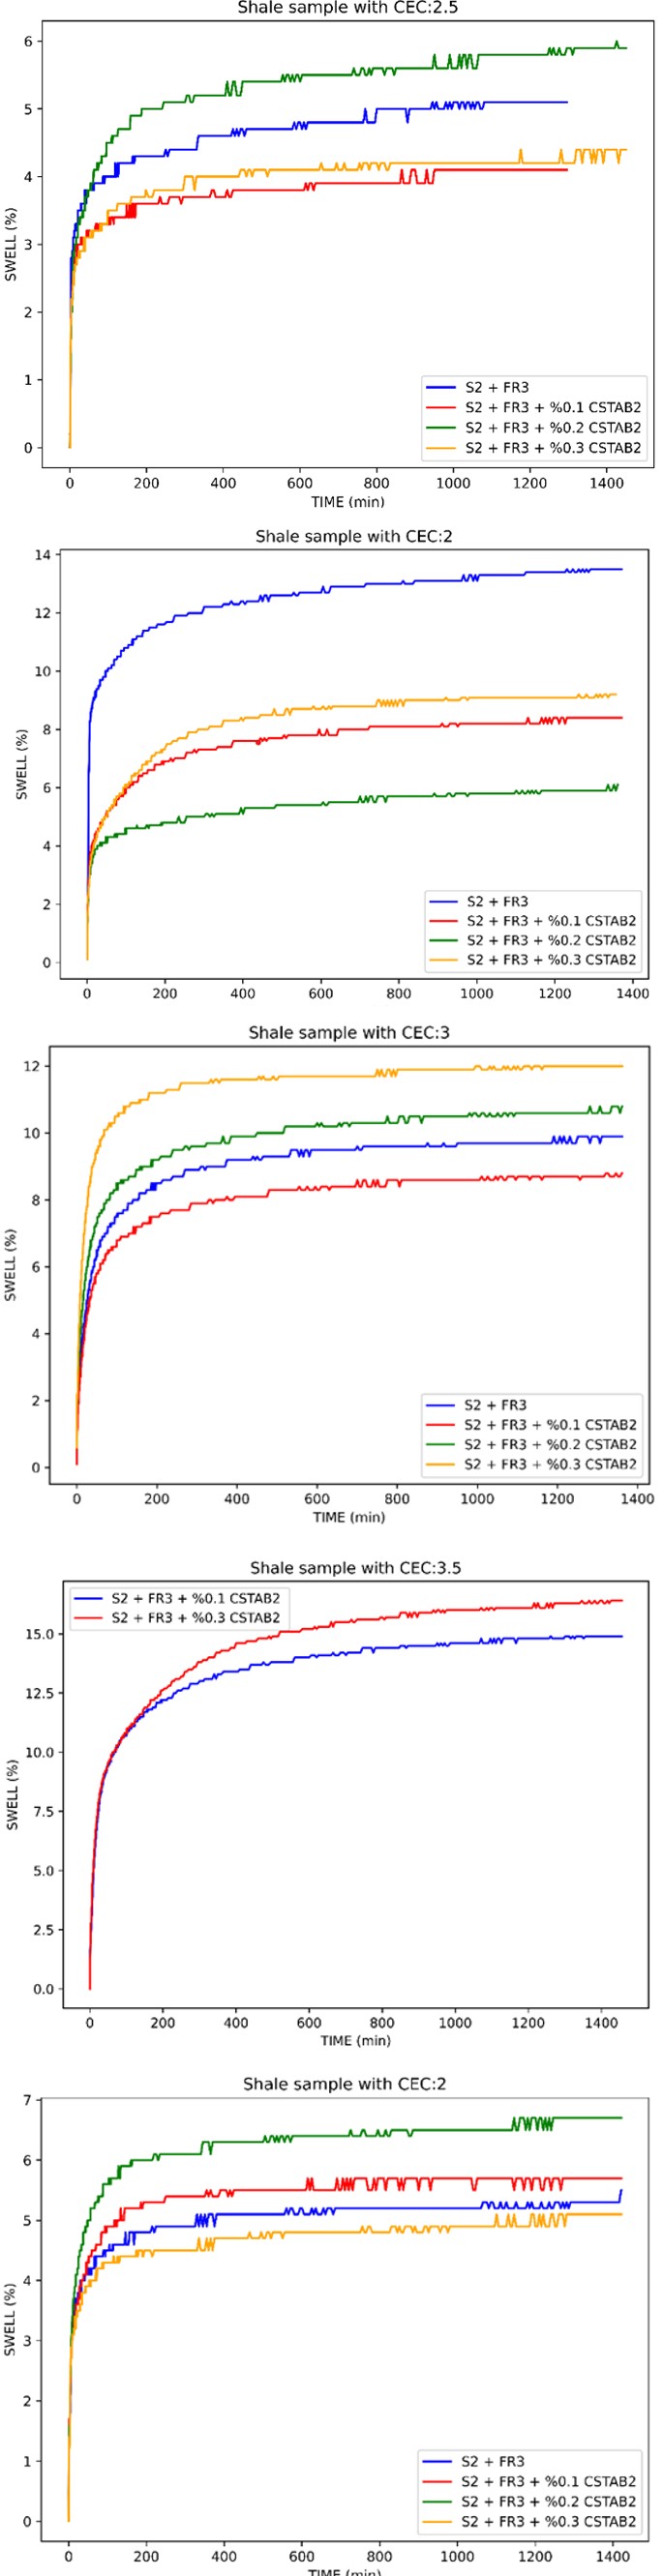
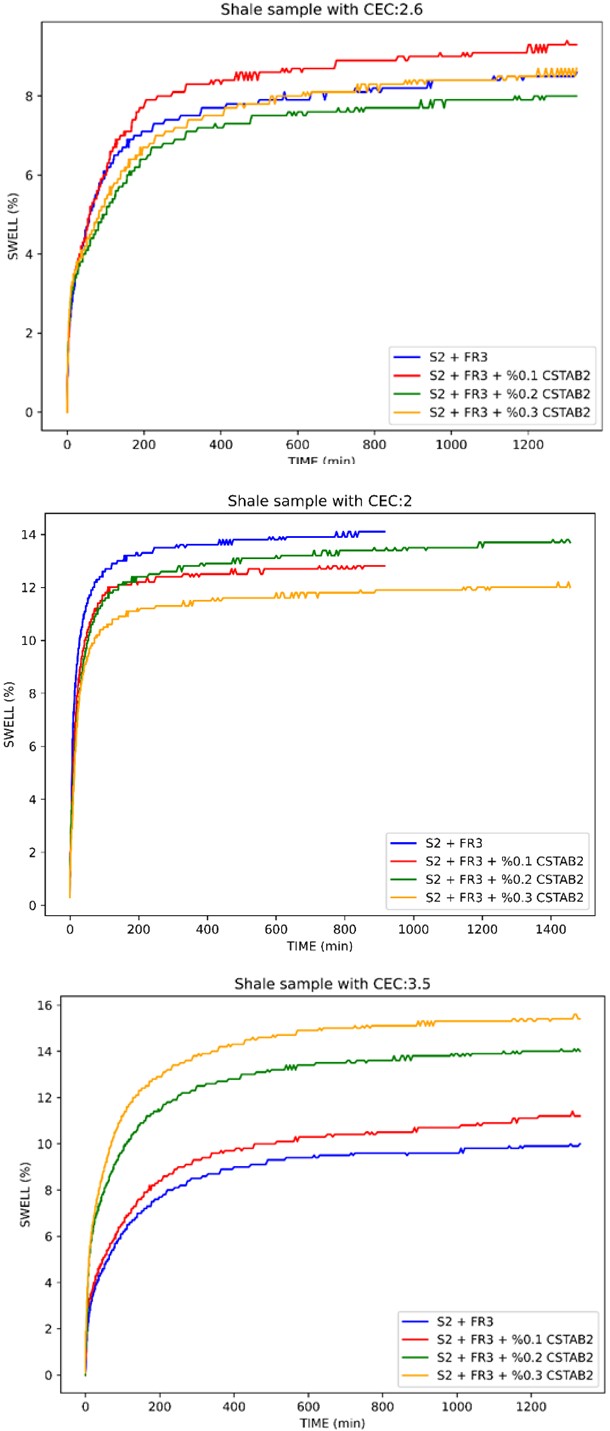
This method always followed based on the advices of manufacturer manual and our experiences for R&D research studies. Total 65 LSM tests carried out by using mentioned methodology. Test results of LSM demonstrated in Figures 5-9.
Results and Discussion
CEC vs LSM
Effect of Fracturing Fluids on Swelling: Use of frac fluid in fracturing can have a significant impact on the swelling of shale rock. When the fluid is injected into the rock formation at high pressure, it can cause an increase in the volume of the shale rock, known as “swelling.” This swelling occurs because the fluid can interact with the minerals in the rock and cause a chemical reaction that leads to an expansion of the rock. The swelling of shale rock can have a negative impact on the hydraulic fracturing process. When the rock swells, it can cause the fractures created by the high-pressure injection to close, which reduces the flow of gas or oil from the well. This can make it difficult to extract the desired resources, and it can also lead to damage to the well. The pressure created by the swelling can cause the well bore to become -severely damaged, which can make it difficult to repair.
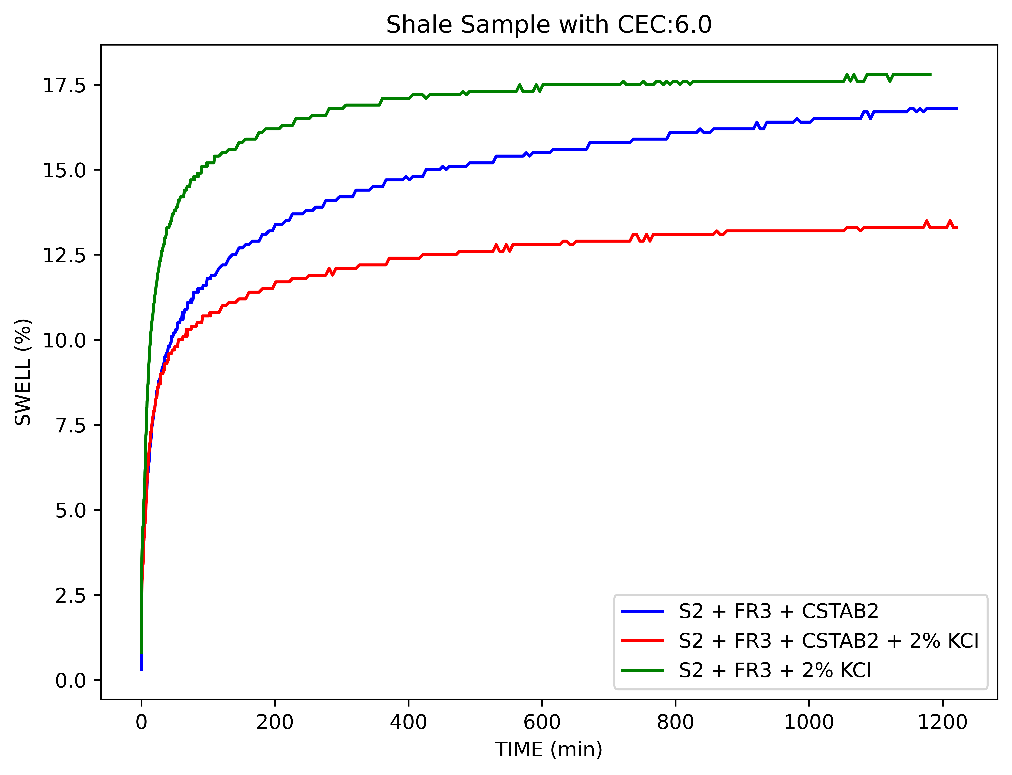
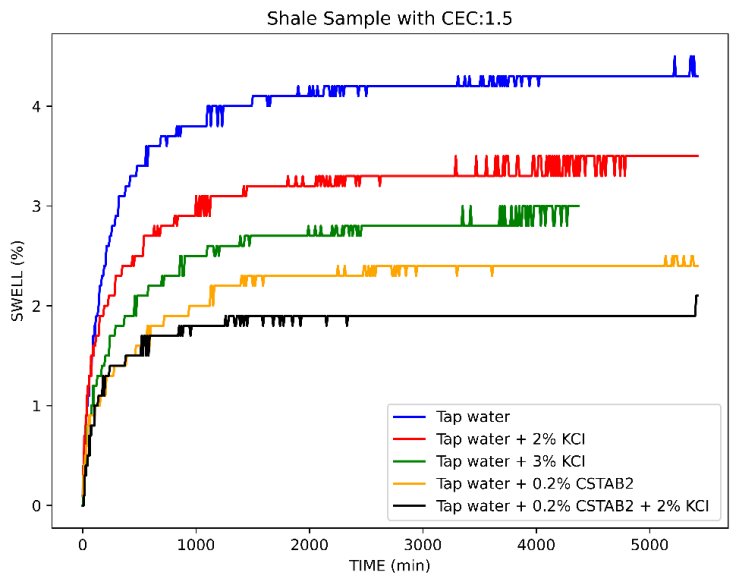
The studies [14, 15, 16] on shale-fluid interaction have investigated the impact of different factors on the rate of imbibition, which is the process by which fluids are absorbed into a porous material. One of the key findings from these studies is that the use of clay stabilizers in conjunction with KCI can effectively decrease the rate of imbibition. This
means that by using these materials together, the fluid is absorbed at a slower rate into the porous material. These findings were determined through the use of two specific test methods: proppant embedment and NMR. Proppant embedment is a technique that measures the amount of fluid that is absorbed into a porous material, while NMR is a non-destructive testing method that is used to study the properties of fluids. Both of these methods provided detailed information on the rate of imbibition and how it was affected by the presence of clay stabilizers and KCI. The test setup used in this study also revealed that clay stabilizer and KCI work well together. This means that when these materials are used in combination, they have a synergistic effect, resulting in an even greater decrease in the rate of imbibition than when used individually. Overall, these research studies provide valuable insights into how shale-fluid interactions can be influenced by different materials, and can be used to optimize the extraction of resources from shale formations.
Conclusion
- By looking at the XRD results, the effect of clays on swelling observed independently of the fracturing fluids.
- An increase in CEC values observed according to the amount of active clays and the degree of activity.
- Clay stabilizers inhibit more effectively with KCI.
- Presented methods can be used to optimize fracturing fluids before the treatments.
- The most active mineral is Smectite.
The reason for its high activity is due to its weak bonding and high repulsive potentials on its surface. This unique characteristic allows water to enter between the layers, which in turn causes an increase in the c-spacing. This expanding lattice greatly increases the colloidal activity of Smectite by making all the layer surfaces available for hydration and cation exchange. This results in a significant increase in specific surface, as observed in reference 26.
References
-
Anders MH, Laubach S, Scholz CH (2014) Microfractures: A review. J Struct Geol 69: 377-394.
-
Can DE (2019) Impact of Natural Fracture Induced Elastic Anisotropy on Completion and Hydraulic Fracturing Designs. Graduate Theses, Dissertations and Problem Reports, pp: 3826.
-
Gale JFW, Laubach SE, Olson JE, Eichhuble P, Fall A (2014) Natural fractures in shale: A review and new observations. AAPG Bull 98: 2165-2216.
-
Dundar EC, Mengen AE, Mironov VS, Khlopkov A, Alagoz E (2023) An analytical study of hydraulic fracturing optimization for tight shale formation. 21th International Petroleum and Natural Gas Congress and Exhibition of Turkiye. IPETGAS held in Ankara, Turkiye.
-
Slatt RM, Brien ONR (2001) Pore types in the Barnett and Woodford gas shales: Contribution to understanding gas storage and migration pathways in fine-grained rocks. AAPG Bull 95: 2017–2030.
-
Alagoz E, Guo Y, Li L (2023) Optimization of Fracture Treatment Design in a Vertical Well. Petroleum and Petrochemical Engineering Journal 7(4): 1-16.
-
Clarkson CR, Haghshenas B, Ghanizadeh A, Qanbari F, Kovacs JD, et al. (2016) Nanopores to megafractures: Current challenges and methods for shale gas reservoir and hydraulic fracture characterization. J Nat Gas Sci Eng 31: 612-657.
-
Dundar, Alhemdi, Aymen, Ming G (2019) Impact of Natural Fracture-Induced Elastic Anisotropy on Completion and Fracturing Design in Different Shale Reservoirs. SPE/AAPG/SEG Unconventional Resources Technology Conference, Denver, Colorado, USA.
-
Zhang C, Liu DD, Jiang ZX, Song Y, Luo Q (2022) Mechanism for the formation of natural fractures and their effects on shale oil accumulation in Junggar Basin, NW China. Int J Coal Geol 254: 103973.
-
Alpkiray M, Dundar EC (2023) A Glance on Hydraulic Fracturing: Benefits, Concerns, and Future. Science Journal of Energy Engineering 11(2): 19-25.
-
Zhang XJ, He JH, Deng HC, Fu MY, Xiang ZH (2022) Controls of interlayers on the development and distribution of natural fractures in lacustrine shale reservoirs: A case study of the Da’anzhai member in the Fuling area in the eastern Sichuan Basin. J Pet Sci Eng 208: 109224.
-
Alagoz E, Mengen AE, Yaradilmis Y (2023) Evaluation of XRD, CEC, and LSM Methods for Fracturing Fluid Optimization: Experimental Findings. 21th International Petroleum and Natural Gas Congress and Exhibition of Turkiye, IPETGAS held in Ankara, Turkiye, pp: 185.
-
Gou QY, Xu S, Hao F, Yang F, Zhang BQ, et al. (2019) Full- scale pores and micro-fractures characterization using FE-SEM, gas adsorption, nano-CT and micro-CT: A case study of the Silurian Longmaxi Formation shale in the Fuling area, Sichuan Basin, China. Fuel 253: 167-179.
-
Alagoz E, Wang H, Russell RT, Sharma MM (2020) New Experimental Methods to Study Proppant Embedment in Shales. Paper ARMA 2020-1933, 54th US Rock Mechanics/Geomechanics Symposium held in Golden, Colorado, USA.
-
Li WH, Ying JF, Huang YR, Wang M (2021) Quantitative characterization of microfractures in the Cretaceous tight reservoirs from the Liuhe Basin. Energy Rep 7: 5795-5803.
-
Alagoz E, Sharma MM (2021) Investigating Shale-Fluid Interactions and Its Effect on Proppant Embedment Using NMR techniques. 55th US Rock Mechanics/ Geomechanics Symposium held in Houston, Texas, USA, pp: 2021-1129.
-
Simonin A, Renard F, Boehm C, Gilbert S (2016) Microfracturing and microporosity in shales. Earth-Sci. Rev 162: 198-226.
-
Alagoz E, Wang H, Russell RT (2022) New Experimental Methods to Study Proppant Embedment in Shales. Rock Mech Rock Eng 55: 2571-2580.
-
Yang F, Ning ZF, Wang Q, Zhang R, Koss BM (2016) Pore structure characteristics of lower Silurian shales in the southern Sichuan Basin, China: Insights to pore development and gas storage mechanism. Int J Coal Geol 156: 12-24.
-
Alagoz E (2020) Interaction of Fracturing Fluids with Shales: Proppant Embedment Mechanisms. MS Thesis, The University of Texas at Austin, Texas.
-
Yuan Y, Zhao JZ, Er C, Wang R, Wei ZK, et al. (2014) Study on types and features of the pore in Mesozoic and Upper Palaeozoic shales in Ordos Basin. J Xian Shiyou Univ 29: 14-19.
-
Moore DM, Reynolds RC (1997) X-Ray Diffraction and the Identification and Analysis of Clay Minerals. Oxford University Press, New York, pp: 215-225.
-
(2003) API Recommended Practice 13B-1, 3rd(Edn.).
-
(2009) ANSI/API Recommended Practice 13I, 8th(Edn.).
-
Caenn R, Darley HCH, Gray GR (2017) Clay Mineralogy and the Colloid Chemistry of Drilling Fluids. In: Composition and Properties of Drilling and Completion Fluids. 7th (Edn.), Gulf Professional Publishing, USA.
-
(2012) M4600 HPHT Liner Swell Meter, Grace Instrument Operational Manual.
- Nigeria’s Vulnerability in the Face of Global Energy Policy
- A Simulation Study of Investigation of Optimum Oil Production Performance by Applying Various Gas Injection Methods in Oil Reservoir
- Characterization of Permo-Triassic Reservoirs through Thermal Maturity Assessment of Westphalian Source Rocks in the Cheshire Basin
- Influence of Microwax on the Rheological and Thermal Behaviour of a Wax Crude Oil
- Real-Time Monitoring and Performance Optimization of Steam Injection in Heavy Oil Reservoirs Using Fiber Optic Sensing and Integrated Predictive Simulation Models
- Rapid On-Site Determination of the Total Petroleum Hydrocarbon Content of Soils by Handheld Fourier Transform Near-Infrared Spectroscopy: Development of a Global, Site- and Scanner- Independent Calibration Model