Reducing Failure Rate of Block and Control Valves Using Lean Six- Sigma Based Approach
This study investigates the causes of failures in block and control valves, identifying four main factors: inappropriate pressure setting, inadequate preventive maintenance, valve design flaws, and the presence of foreign particles in wells. Based on these findings, it proposes an implementation plan for process improvement, comprising short and long-term solutions tailored to address each root cause. Recommendations include consulting material specialists for proper material selection, upgrading valve materials, ensuring spare parts availability, emphasizing rig cleaning, and updating preventive maintenance procedures. Implementation of these measures is expected to lead to a 50% reduction in the failure rate of both block and control valves, resulting in significant cost savings and reduced production downtime.
Background
The Oil and Gas industry heavily depends on different types of valves, such as bleed, block, choke, control, and relief valves. Nonetheless, this study focuses on the challenges associated with block and control valves. There was a total of 490 block valves and 278 control valves at the offshore field under this study. Block valves are designed to prevent any possible leaks during an emergency, while control valves regulate the process variable by adjusting their opening based on the signal received from a controller. Unfortunately, there have been reports of failures with both types of valves. It’s important to ensure that these valves are functioning properly to avoid any potential safety hazards. It is concerning to note that 104 block valves and 44 control valves have experienced failures, resulting in substantial revenue loss, and endangering the lives of personnel. Valve failure in certain cases can lead to backflow towards the producing wells, which can cause liquid to accumulate in the well. As a result, the well may stop producing over time, leading to its demise. Additionally, it may pose a significant danger to nearby personnel, and in extreme situations, it may cause severe injuries or fatalities if a significant leak ignites. Therefore, the objective of this study is to present the company with recommendations that would aid in reducing the failure rate of block and control valves in the field. The Lean Six Sigma approach can help reduce the failure rate of these valves by 50%. Applying the DMAIC five stages will enable us to identify the root cause of the issue and find an effective solution. Let us take action to prevent further damage and ensure a thriving Oil and Gas industry.
Literature Review (Real-World Applications of the Lean Six Sigma Methodologies in the Oil and Gas Industry)
Implementing Lean Six Sigma rigorously brings numerous benefits, regardless of the nature of the problem be it operational, managerial, financial, logistic, or otherwise. Ensuring that all necessary conditions are met at the outset guarantees favorable outcomes before proceeding further with the process [1]. Numerous Lean Six Sigma investigations have been carried out within the oil and gas sector. The approach was applied to improve Propane recovery in a Gas
Plant. The study was conducted to assess the low Propane recovery in Natural Gas Liquid products. The study yielded an implementation plan that resulted in a 70% increase in Natural Gas Liquid products [2]. Another application of the Lean Six Sigma approach was through a study that was carried out to improve the profitability of a refinery using energy optimization, reducing emissions, and energy intensity index. Following the implementation stage, the energy intensity index improved resulting in an astonishing cost avoidance of 1.4 million dollars a year [3]. Another successful Lean Six Sigma project is that of a study to reduce the lead time of the refurbishing wellhead valve process. The thorough study and analysis of the data given and utilizing the Lean Six Sigma methodology and tools led to providing the company with a set of recommendations that once implemented resulted in an outstanding reduction in the refurbishment lead time from 53 to as little as 3 days [4]. In this last story, a drilling contractor offers drilling services utilizing offshore equipment units and drillships. Maintaining high fleet availability is critical both for the company’s operations and customer satisfaction. Excessive or outdated inventory can impede supply chain efficiency and management. Furthermore, the lack of inventory visibility was evident, as there was no available information regarding inventory levels in the rigs or storage areas.
Inventory processes were undocumented and poorly managed, highlighting the need for the flexible yet potent application of Lean Six Sigma methodologies. Through systematic identification of issues, improvements were realized, leading to enhanced inventory visibility, better control, and increased efficiency in requisitioning. Over a span of two years, the implementation of inventory management strategies resulted in a remarkable 50% improvement in cycle counting accuracy [5].
The Define Stage
Several failures have been reported for the block and control valves in the field understudy. A total of 104 and 44 block and control valves respectively have been reported to have failed affecting the flow rate of production wells, causing deviation from the production targets and ultimately heavy loss of revenue. Also potentially even jeopardizing the complete loss of these wells if the fluid builds up to a point where the wells will no longer be able to produce. The main objective is to come up with a set of recommendations that upon implementation will assure the reduction of the failure rate of these valves by 50% aiming ultimately to create a safer work environment and increase the production for the producing wells to their optimum rate to generate target revenue. The study will analyze the collected data to identify potential root causes of the problem. It will also utilize the use of several of the Lean Six Sigma tools such as the fishbone diagram, bar chart, and failure mode and effect analysis (FMEA) to properly classify and rate those potential causes. The previous will be followed by using the five whys concept to analyze those causes to effectively generate an implementation plan that will incorporate all the suggested recommendations for process improvement.
The Measure Stage
To quantify the problem, data gathering was initiated on the failure rate of block and control valves. Based on the provided data, a total of 104 block valves have been reported to have failed for the field understudy thereby representing roughly 21% of the total number of block valves. A total of 44 control valves also failed which is approximately equivalent to 16 % of the total number of control valves representing. With the assumption that the types of failures were combined into one single type, the main concern was classifying the valve to either have failed or not, regardless of the mode of failure. Process capability analysis, which is a statistical tool, was used to find the process sigma to analyze the current performance of the process of both types of valves See Table 1 below. Considering that the objective of this project is to reduce the failure rate by 50% which was calculated to be equivalent to Z values of 2.75 and 2.91 for the block valve and the control valve respectively. This translates to any valve failure that is greater than 10.6 % for the block valve and 7.9% for the control valve will be considered as defective valves See Table 2 below.
| Description | Block valve | Control valve | ||
|---|---|---|---|---|
| Unit | Count | Unit | Count | |
| No. of failures (defects) | D | 104 | D | 44 |
| No. valves in field | U | 490 | U | 278 |
| No. of opportunities | o | 1 | o | 1 |
| Defects per unit | DPU | 0.212244 | DPU | 0.158273 |
| Defects per Opportunities | DPO | 0.212244 | DPO | 0.158273 |
| Defects per Million Opportunities | DPMO | 212244 | DPMO | 158273 |
| Process Sigma | Z | 2.3 | Z | 2.5 |
| DPMO | Process Sigma (Z) | DPMO | Process Sigma (Z) | |
| Current | 212244 | 2.3 | 158273 | 2.5 |
| Goal | 106122 | 2.75 | 79137 | 2.91 |
Table 1: Shows the process capability analysis.
Analyze Phase
In this stage, the root causes of the problem had to be determined. A few of the Lean Six Sigma tools such as fishbone diagram, pie chart, effect analysis (FMEA), and Five- Whys analysis were used to achieve the previously stated. The fishbone diagram was constructed based on grouping all the potential underlying causes under specific categories based on the information obtained. Primary evaluation of the data resulted in classifying the potential causes into four main categories: mechanical, operational, manufacturing, and process. Each of the four categories has one or more sub-causes. The sub-causes related to mechanical were mechanical wear, failure, and fatigue. Under operational, one sub-cause that is improper operation. One item identified under manufacturing is a material defect. The sub-causes attributed to the process were corrosion external, corrosion internal, and erosion (Figure 1).
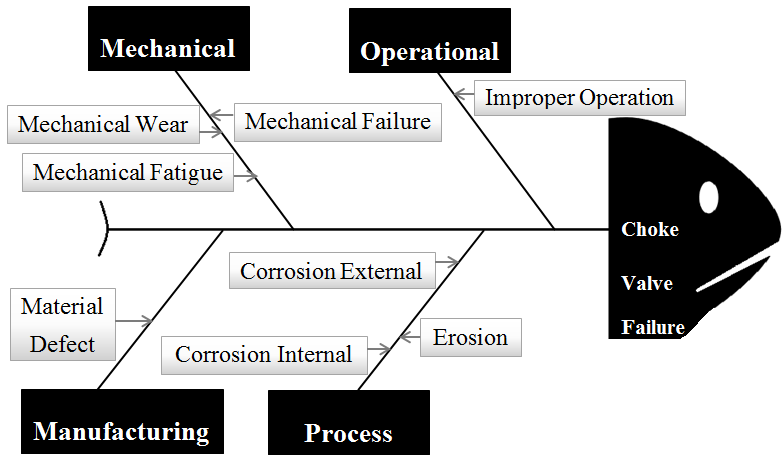
Table 3 also shows the number of failure incidents for the block and control valves based on the potential causes.
| Equipment Failure cause | Block Valve | Control Valve |
|---|---|---|
| Corrosion External | 1 | |
| Corrosion Internal | 4 | |
| Erosion | 5 | 3 |
| Manufacture | 1 | |
| Material Defect | 7 | 4 |
| Mechanical Failure | 38 | 21 |
| Mechanical Fatigue | 2 | |
| Mechanical Wear | 8 | 5 |
| Operational | 40 | 9 |
| Totals | 104 | 44 |
Table 2: equipment failure caused by valve type.
Bar and Pie charts of the potential causes of valve failure incidents are shown for both types of valves in Figures 2 and 3.
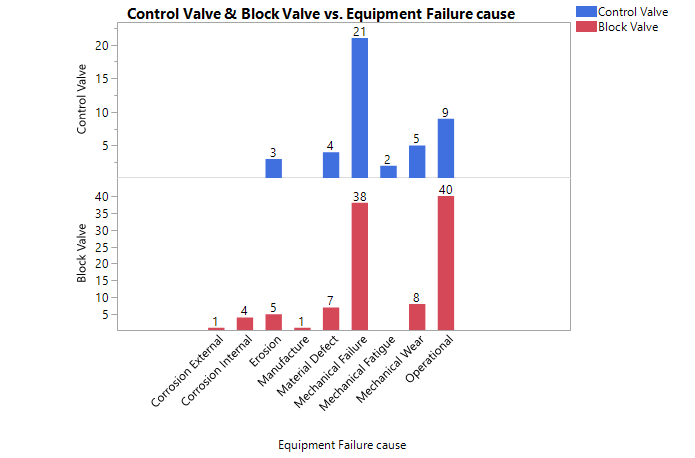
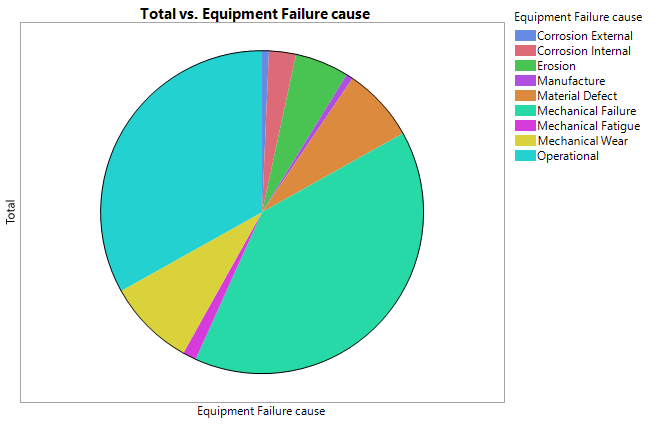
The initial findings suggested that roughly 40% of the valve failure incidents were directly attributed to mechanical failure. It was pointed out that some of these failures were in fact due to more of an operational cause as the mechanical failure was directly caused by an operator leaving the valves in an incorrect position in some cases, or the valve was carelessly operated. Taking the new information into consideration the initial percentages changed suggesting that approximately half of the failure incidents are attributed to operational causes. These causes suggest that there was not a fault with the valve itself but rather an action was done affecting the operation of the valve and causing it to fail.
A secondary evaluation of the data was done and a more in-depth review of all the incidents was carried out on both valves and the underlying causes were determined. A pie chart was constructed to show the new distribution of these causes (Figure 4). The new data revealed that approximately 80% of the incidents were accounted for by only three underlying causes. The three causes are: lack of training, deficient quality assurance procedures, and design inadequate.
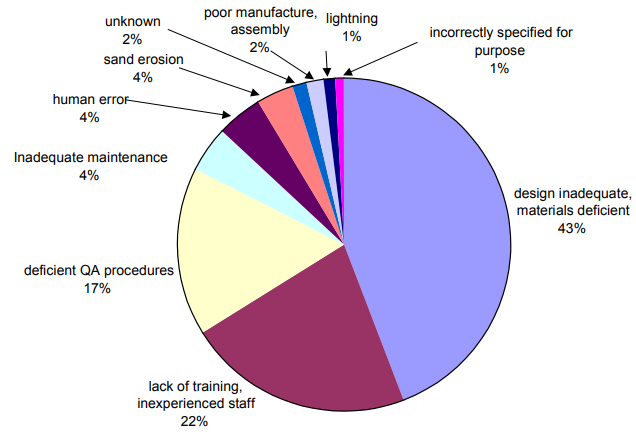
Based on the findings shown in Figure 4, the study will focus on the three main causes stated previously.
Design Inadequate and Materials Deficient
This cause was the highest underlying cause accounting for 43%. Some of the reasons that were identified within this category and were more than likely attributable to the valve design were: mechanical failure, worn out, mechanical fatigue, material defect, and internal/external corrosion. Initially, the internal corrosion, external corrosion, and erosion were attributed to process causes. However, after the secondary evaluation of the data collected, it was revealed that the more likely scenario is that the process conditions have changed and that the valves have been used to outwit their design parameters. Therefore, it can be realized that the design weakness is considered to be a major aspect that affects the data and the question becomes whether a valve has been correctly selected and specified at the time of procurement and if the operating conditions were correctly specified. A high possibility is that the process conditions may have changed over the years. Another likely scenario is that in many cases especially in one involving production streams, the fluid may have sand particles and as the field matures and is close to being depleted, the sand particles can be considered one of the underlying related factors. Nevertheless, it is still the case where the materials and valve design must be within the operating fluid/ process conditions. With that stated, it is important to keep in mind that it is an operator’s responsibility to recognize a change in process conditions and act accordingly to prevent any future failure.
Management and Operational Issues
The second major classification was attributed to ‘management and operational issues’ associated with the location of the installed valve and how it is operated, which is among the responsibilities of the operator and /or their subcontractors. The subcategories are lack of training, and inexperienced staff accounting for 22% of the failure incidents, deficient quality assurance procedures being the cause of approximately 17 % of failure occurrences, and inadequate maintenance making up 4%, bringing the total percentage for the management and operational issues to a total of 43 % of the failure of the valves.
The Lack of Training or Inexperienced Staff
This underlying cause of the valve failure problem was not initially accounted for as preliminary investigation suggested that the failure of the valves was solely a valve problem. Further research revealed that some of the failures were a result of inexperienced staff. Examples of these subcategories include incorrectly fitted, improper testing, improper operation, improper inspection, non-compliance with quality assurance procedures, and human error. Therefore, it can be concluded that the number of failure occurrences can be substantially reduced by ensuring that the staff are well-trained, and those with no experience are supervised at all times, till have incurred sufficient experience, and also that operating procedures are followed.
Next, FMEA and five whys analysis will be included in the next lab report before the improvement section. The FMEA will tabulate the potential defect, the potential consequences of the defect, the potential causes, and control.
As part of the process, the company was presented with the progress and the updated findings. Few from the upper management, senior engineers, and technicians held a meeting to brainstorm and gather alternative viewpoints. Based on the outcome and combining that with the study’s findings, two Failure mode and effect analysis tables were constructed for both the block and control type of valves to point out the detailed causes, including the potential failure mode, highlighting the impact of these failures and their potential causes, and stating the current control mechanism in place to mitigate the failure (Tables 4 and 5). Pressure setting was included as an additional potential cause in this analysis due to its criticality for operation personnel. The Risk Priority Number (RPN) was calculated to be able to sort the risks from highest to lowest. The calculation was done by simply multiplying the three scoring columns: Severity (Sev.), Occurrence (Occ.), and Detection (Det.). Then, a five- whys analysis was used to verify the root cause behind the proposed failures. The results are tabulated in Table 6 below also showing recommended short and long-term solutions for each of the main causes contributing to the failure incidents of the valves. The last two columns of the table demonstrate these suggestions for process improvement.
| Func. | Potential Failure Modes | Potential Effects | Sev. | Potential Causes | Occ. | Potential Controls | Det. | RPN |
|---|---|---|---|---|---|---|---|---|
| blocks possible leaks in case of an emergency | Nonresponsive | Malfunctioning of valve | 8 | Improper material selection | 15 | Standards | 5 | 600 |
| Damage to the main components of the valve | Functioning of valves out of design parameters | 11 | Pressure setting by the production engineer | 4 | 352 | |||
| Internal corrosion attributed to the type of fluid | 7 | No controls | 10 | 560 | ||||
| Design of valve | 4 | Standards | 5 | 160 | ||||
| Quality of manufacturing | 4 | Inspection (QC/QA) | 5 | 160 | ||||
| Foreign particles | 8 | No controls | 10 | 640 | ||||
| Lack of training for the personnel involved | 21 | Electrical PM | 3 | 504 | ||||
| Inadequate quality assurance procedures | 12 | Assessment and supervision | 10 | 960 | ||||
| Inadequate maintenance | 9 | More frequent inspections | 10 | 720 | ||||
| Pressure setting | 8 | Manuel adjustment | 3 | 192 | ||||
| Internal corrosion attributed to the temperature of fluid | 5 | No controls | 10 | 400 | ||||
| Func. | Potential Failure Modes | Potential Effects | Sev. | Potential Causes | Occ. | Potential Controls | Det. | RPN |
| Controls a process variable, such as flow, pressure, or temperature | Damage of Cage | Malfunctioning of valve | 8 | Improper material selection | 6 | Standards | 5 | 240 |
| Damage of Plug | Functioning of valves out of design parameters | 5 | Pressure setting by the production engineer | 4 | 160 | |||
| Damage of Seats | Internal corrosion attributed to the type of fluid | 5 | No controls | 10 | 400 | |||
| Quality of manufacturing | 2 | Inspection (QC/QA) | 5 | 80 | ||||
| Foreign particles | 3 | No controls | 10 | 240 | ||||
| Actuator failures | Lack of training for the personnel involved | 12 | Electrical PM | 3 | 288 | |||
| Inadequate quality assurance procedures | 6 | Assessment and supervision | 10 | 480 | ||||
| Pressure setting | 3 | Manuel adjustment | 3 | 72 | ||||
| Internal corrosion attributed to the temperature of fluid | 2 | No controls | 10 | 160 |
Table 3: failure mode and effect analysis for block valves.
| Causes | Why 1 | Why 2 | Why 3 | Why 4 | Why 5 | Solutions | ||
|---|---|---|---|---|---|---|---|---|
| Short term | Long term | |||||||
| 1 | Design of valves | Improper material selection of internal parts | Information given to the vendor is not full | Actual operating condition changes | Initial study based on assumption and not on actual conditions | Approach material specialist and check for proper material | Upgrade the valve material based on feedback received from the specialist | |
| The material selected for other fields is not suitable for the current field | Process parameters are diff. for the field understudy | Ensure the ability of spare parts of the valve | ||||||
| 2 | Foreign particles | Left over from rig activities | The cleaning procedure is not adequate | 100 % cleaning is not feasible | Emphasis on proper rig cleaning activities as procedures | Study the feasibility of installing a strainer upstream of the valve to avoid foreign particles | ||
| 3 | Inadequate quality assurance procedures | Lack of awareness of valve management | Inadequate procedure | Review the existing procedure and update it accordingly | ||||
| Lack of manpower in that division | ||||||||
| 4 | Pressure setting | The valve unable to withstand pressure- setting | Improper selection of valve | Review the design pressure for the valve | Upgrade the valve material based on feedback received from the specialist |
Table 4: shows the five-whys analysis.
Improve and Control Phases
The identified recommendations and proposed suggestions have been consolidated in an implementation plan (Table 7). The table highlights the causes, and actions required, and identifies responsible discipline. Once the plan was completed and submitted, the control phase started to closely monitor the improvements once the remedial actions were enforced and to ensure corrective actions were taken when necessary to maintain the valves efficiently and effectively.
| Causes | Actions | Who | Remarks | |
|---|---|---|---|---|
| 1 | Design of valves | Approach material specialist and check for proper material | Reliability | |
| Engineer | ||||
| 2 | Upgrade the valve material based on feedback received from the specialist | Field Service Operations Engineer | To be decided based on the outcome of action 1 | |
| 3 | Ensure the ability of spare parts of the valve | Maintenance Engineer | ||
| 4 | Foreign particles | Emphasis on proper rig cleaning activities as procedures | Production Engineer | |
| 5 | Study the feasibility of installing a strainer upstream of the valve to avoid foreign particles | Field Service Operations Engineer | ||
| 6 | Inadequate quality assurance procedures | Review the existing procedure and update accordingly | Maintenance Engineer | |
| 7 | Pressure setting | Review the design pressure for the valve | Field Service Operations Engineer | |
| 8 | Upgrade the valve material based on feedback received from the specialist | Field Service Operations Engineer | To be decided based on the outcome of action 1 |
Table 5: demonstrates the proposed implementation plan.
All the proposed solutions were again discussed with the company to further study the pros and cons of the recommendations and the degree of economic feasibility for each. The payoff matrix was chosen as a decision analysis tool to summarize the pros and cons of each decision in a tabular form (Table 8). The matrix demonstrated three ranking levels (low, medium, and high) to link each action in the implementation plan with the magnitude of cost, effort, and work required to accomplish this task versus the benefits expected upon completion. There were three actions identified with Low cost, three with medium cost, and one with high-cost ranking. In the benefits section, a total of six actions were identified with Medium and one with High benefit rankings.
| Actions | Cost/Effort | Benefit | |
|---|---|---|---|
| 1 | Upgrade the block and control valve materials based on feedback received from the specialist | High | High |
| 2 | Ensure the availability of spare parts for valve | Medium | Medium |
| 3 | Review existing preventative procedures and update accordingly | Medium | Medium |
| 4 | Review the design pressure for the valve | Medium | Medium |
| 5 | Approach material specialist and check for proper material selection | Low | Medium |
| 6 | Emphasis on proper rig cleaning activities as per procedures | Low | Medium |
| 7 | Study the feasibility of installing a strainer upstream of the valve to avoid foreign particles | Low | Medium |
Table 6: represents the pay-off matrix.
Long-Term Monitoring and Evaluation
To ensure the durability of improvements and identify necessary adjustments over time, it is crucial to incorporate a robust system for long-term monitoring and evaluation. The study on valve failures provides a structured approach to monitoring and evaluating the implemented changes for both block and control valves.
Establish Clear Metrics and KPIs
- Track the failure rate of block and control valves monthly.
- Monitor the costs associated with maintenance work to fix valve failures.
- Measure the potential costs of shutting down producing wells during valve repairs.
Regular Data Collection and Analysis
- Collect data on valve performance, including the frequency and nature of failures.
- Record the length of time each valve has been in service before failure.
- Continuously analyze the root causes of failures to identify patterns and emerging issues.
Scheduled Reviews and Audits
- Conduct quarterly reviews to evaluate the effectiveness of the implemented solutions.
- Perform annual audits to assess the overall impact of process improvements on valve reliability and maintenance costs.
Employee Engagement
- Provide periodic refresher training on preventive maintenance procedures and the importance of proper rig cleaning activities.
- Establish a feedback mechanism for employees to report issues and suggest improvements.
Consultation and Continuous Improvement
Maintain regular consultations with material specialists to verify the proper material selection and upgrade as needed. • Continuously review and update the preventive maintenance program based on the latest data and feedback from the field.
Technology Utilization
- Implement monitoring tools to automate data collection and analysis, ensuring timely and accurate insights.
- Utilize predictive maintenance technologies to foresee potential failures and address them proactively.
Adjustments and Adaptation
• Make necessary adjustments to the process improvement plan based on monitoring results and changing operational conditions.
By following this long-term monitoring and evaluation plan, operations can ensure the sustained effectiveness of Lean Six Sigma improvements, leading to reduced block and valve failure rates, lower maintenance costs, and minimized production downtime. Regular reviews, continuous data collection, and a commitment to ongoing improvement will help maintain the gains achieved and adapt to new challenges as they arise.
Conclusion
The study evaluated the failures of two types of valves, namely block and control valves. It identified four main causes of valve failures, including inappropriate pressure setting, inadequate preventive maintenance program, the design of the valves, and the presence of foreign particles in the well. The study recommended an implementation plan for process improvement that includes short and long-term solutions for each cause contributing to the block and control valves’ failures. To address these issues, the study suggested consulting material specialists to verify proper material selection, upgrading the materials of block and control valves based on specialist feedback, ensuring the availability of spare parts for the valves, emphasizing proper rig cleaning activities, and reviewing and updating the existing preventive maintenance procedures. It is expected that the implementation of the proposed plan will lead to a decrease in the failure rate by 50% in both block and control valve failures. As a result, the cost associated with maintenance work required to fix these failures and the potential cost of shutting down producing wells during this repair period will be reduced by 50%. Additionally, it might be useful for future research on valve failure and reliability to consider the length of time a valve has been in service. However, this aspect was not addressed in the provided data. If a valve fails after only a short time in service (a few weeks or months), it could be due to different factors, which would raise questions. On the other hand, if valves have been in service for several years before failing, the main cause may be ‘wear and tear’.
Guideline for Differently Configured Oil and Gas Operations
Implementing Lean Six Sigma in smaller or differently configured oil and gas operations requires a tailored approach to address unique challenges and constraints. First, assess organizational readiness to ensure the culture and capabilities are aligned with Lean Six Sigma principles.
Customized training programs, such as online courses and in- house sessions, can provide cost-effective education tailored to the needs of smaller teams. Project selection should prioritize high-impact, low-complexity projects for quick wins, while resource allocation should creatively leverage existing employees and tools. Simplified data collection and analysis methods can empower staff to identify and solve problems independently. Flexible implementation strategies, such as phased approaches and incremental improvements, help manage risks and refine processes. Fostering a culture of continuous improvement through recognition and engagement, along with leveraging affordable technology solutions, enhances efficiency and collaboration. Regular performance monitoring and adaptation based on key performance indicators ensure ongoing refinement and success. By adopting these guidelines, smaller oil and gas operations can effectively utilize Lean Six Sigma to improve efficiency, reduce costs, and achieve sustainable improvements.
Future Research
Encourage future research on valve failure and reliability, particularly considering the service time of valves to differentiate between early-life failures and wear-and-tear issues.
References
-
Atanas JP, Rodrigues CC, Simmons RJ (2015) Lean Six sigma applications in oil and gas industry: Case studies. International Petroleum Technology Conference.
-
Amminudin KA, Enezi TS, Jubran MA, Hajji AT, Enizi AS, et al. (2011) Gas plant improves C3 recovery with Lean Six Sigma approach. Oil and Gas Journal 109(19): 102- 109.
-
Bhanumurthy MV (2012) Profitability through lean Six Sigma: Save energy - Save the environment. AIChE Spring Meeting and 8th Global Congress on Process Safety, pp: 233-238.
-
Aramco S (2012) Organization Consulting Department OCD, Lean Six Sigma Green Belt Wave-12 Projects.
-
Anurag M (2022) Lean Six Sigma Usage in the Oil and Gas Industry. Six Sigma, USA.
- Nigeria’s Vulnerability in the Face of Global Energy Policy
- A Simulation Study of Investigation of Optimum Oil Production Performance by Applying Various Gas Injection Methods in Oil Reservoir
- Characterization of Permo-Triassic Reservoirs through Thermal Maturity Assessment of Westphalian Source Rocks in the Cheshire Basin
- Influence of Microwax on the Rheological and Thermal Behaviour of a Wax Crude Oil
- Real-Time Monitoring and Performance Optimization of Steam Injection in Heavy Oil Reservoirs Using Fiber Optic Sensing and Integrated Predictive Simulation Models
- Rapid On-Site Determination of the Total Petroleum Hydrocarbon Content of Soils by Handheld Fourier Transform Near-Infrared Spectroscopy: Development of a Global, Site- and Scanner- Independent Calibration Model