Analysis of Heavy Metals and Petroleum Based Contaminants in Surface Water and Sediment near Two Illegal Refining Sites in Niger Delta, Nigeria
The pollution of the environment from heavy metals and petroleum based contaminants in surface water and sediments resulting from illegal refining activities were looked at. The study was aimed at assessing the levels of heavy metals (Pb, Zn, Cu, Co, Cr, As, Cd and Ni), Benzene, Toluene, Ethyl-Benzene, and Xylene (BETX), Polycyclic Aromatic Hydrocarbons (PAHs) and Total Hydrocarbon Content (THC) in surface water and sediments. Samples were collected from two deactivated sites of illegal refineries in Oshika and Egbalor communities of Rivers State, Nigeria. The samples were analyzed for the contaminants which were compared with the World Health Organization (WHO) standard. The findings indicate that the surface water and sediments were highly polluted and may pose a health hazard to the community members that may use it for drinking.
Introduction
The Niger Delta region of Nigeria is one of the most environmentally impacted regions of the world caused by petroleum crude oil production activities (exploration, production, processing and transportation) is reported in particular as the hub for crude oil activities while also being one of the world’s most bio-diverse eco-systems. The Nigerian Niger Delta is home to the world’s third largest mangrove forest with huge variety of plants and animal species [1].
Adedapo OA, et al. [2], also reported that severe environmental hazards have been attributed to crude oil exploration, production and processing in Africa, mostly arising from the discharge of wastes, including drilling fluids, atmospheric emissions, oily drill cuttings, oil spills, gas flares, well treatment fluids, and deck waste water, etc. [3]. The pollutions include noise, atmospheric air, and marine pollution arising from onshore and offshore operations of oil rigs, distillation plants, tank farms, and vehicular emissions; negatively impact water and air quality [4, 5]. Besides, trace elements are introduced into surface waters from deep aquifers, as a result of the exploration processes, and many of these metals, such as cadmium, arsenic, mercury, copper, zinc, and lead, etc., are toxic to aquatic animals as well as humans [6]. Largely of recent, the activities and practice of illegal oil refineries in the Niger Delta region have brought to the fore these adverse environmental hazards. It has been proven by various researches that Crude oil is a naturally occurring mixture of hydrocarbons and non-hydrocarbon compounds (including heavy metals), which is highly toxic to the environment at high concentrations [7].
It is estimated that there are well over 142 illegal refineries in Rivers State out of which the State government has destroyed about 128 while those in Bayelsa, Delta, Abia, Imo and Akwa Ibom States are still left and amount to about 250 illegal refineries dotted across the Niger Delta region [8], Oshika and Egbalor communities in Rivers State are two of the known sites of illegal petroleum refinery that has devastated the community environment.
The operations of the illegal refinery involves the crude oil being boiled at high temperatures and petroleum products like petrol, diesel and kerosene are collected while the tars and other residues are discharged into the adjoining water creeks and rivers. Most often than not, there are blow outs with the entire area being a flamed as the products are highly inflammable, this causes environmental pollution of water, land and air as it impacts significantly on the health and livelihood of the communities, nature, plants regeneration, loss of natural wild life habitats, disruption of crops, farming in general, water cycle and in most cases lead to loss of life.
Heavy metals are generally referred to as trace metals which are metallic chemical elements with relatively high density that could be toxic in small quantities and are essential to maintain the metabolism of the human body. However, at higher concentrations they can lead to poisoning [9]. Examples of these Heavy metals are Lead (Pb), Zinc (Zn), Copper (Cu) etc.
The aim of this this paper is to show the level of heavy metal and hydrocarbon contaminations in surface water and sediment from the activities of illegal petroleum refinery which operated at Oshika community and Akpa-Chara forest in Egbalor community.
Materials and Methods
Description of Study Area
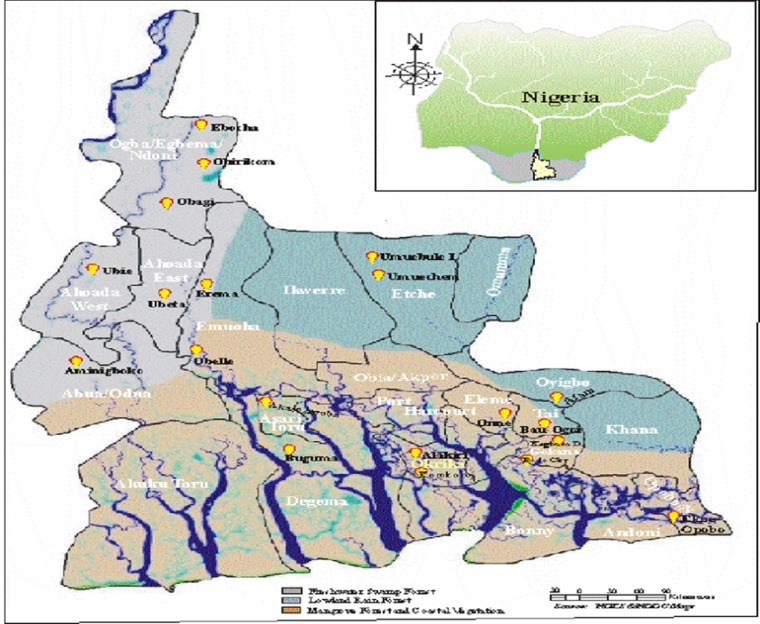
The study area covered two communities in Rivers State, Niger Delta Nigeria. The region is generally bounded by the Atlantic Ocean and separated by barrier island ridges bordering the Atlantic Ocean. It covered area falling within the classification of a generally low-lying terrain that consists of unconsolidated mud and sandy particles which results in little or no resistance to tidal and wave impact on its shoreline [10, 11]. This partly makes it difficult to police the area and therefore allows for criminals to tamper with pipelines and steal crude oil for artisanal refining. Oshika community is a community in Ahoada West Local Government Area with coordinates, latitude 5.04 North (5.073665) and longitude 6.51(6.562638) East and further referred to as SITE A. The site and host community is situated between SPDC pipeline (Right of Way) and Agip Oil Company (NAOC) pipeline (Right of Way) making up the Ebocha- Brass Pipeline (14” Okordia-Rumuekpe Trunk, Osika). Unfortunately, this unique situation makes the place attractive for illegal petroleum refiners as they steal from both lines with the surrounding stream into which waste products are emptied and also makes them prone to oil spills. The second site sampled is in Akpa- Chara forest site is about 20 kilometer away from the Egbalor community in Eleme Local Government Area of Rivers State (referred to as SITE B), covering vast hectares of devastated land and water bodies. The area coordinates are latitude 4o46” North (4.782922) and longitude 7o09” (7.154665) East. The site is within the Egbalor mangrove forest hosting the SPDC 24inch Nkpoku-Bomu Trunk pipe line Right of Way.
Sample Collection
The selection criteria for this study were based on known destroyed illegal refinery sites with adjoining streams, while the control samples were taken from a stream located about 80km away from the sites with no known illegal refinery activity or oil spillage in its vicinity.
Surface water and sediments samples were collected using plastic bottle and eckman grab from the stream and its embankment respectively adjoining the illegal refinery sites with samples taken from a depth of about 0.5meters and subsequently analyzed in the laboratory for some parameters like; heavy metal content (Cd, Ni, As, Zn, Cu, Co, Cr, Pb), Polycyclic Aromatic Hydrocarbons (PAHs), Benzene, Toluene, Ethyl-benzene and Xylene (BTEX) and Total Petroleum Hydrocarbon Contents (THC).
Sample Preparation
100mls of the surface water and sediments each were collected with two 250ml conical flask for the different samples and 10ml of sulphuric acid (H2SO4) was added and heated to facilitate the extraction process. Digestion process continued, after which the solution was neutralized to the required pH level. The various solutions were then analyzed according to APHA 3111B test method with AAS for heavy metal contents.
Determination of BTEX, THC and PAH Using Gas Chromatograph-Flame Ionization Detector (GC- FID) Equipment
Sample Extraction: 10grams of anhydrous sodium sulphate (Na2SO4) was added into an amber glass bottle containing 10g of sediment sample for removing moisture after being stirred. 300µg/ml of surrogate (1-chloro-octadecane) standard was added and 30ml of dichloromethane (DCM) was also added as extracting solvent. The bottle was then corked tightly and transferred to a mechanical shaker. The sample was agitated for about 6hr at room temperature and allowed to settle for 1hr, then filtered through 110mm filter paper into a clean beaker. The filtrate was allowed to concentrate to 1ml by evaporation overnight in a fume cupboard.
Sample Clean-up: A glass column was used for preparation by inserting glass cotton into it and 10g silica gel was dissolved with 50ml (DCM) to form slurry in the column. 10g anhydrous Na2SO4 was added with pentane into the column. The concentrated sample extract was mixed with 20ml cyclohexane in a beaker and transferred to the prepared column which was then eluted using 30ml pentane as solvent and collected in a beaker below the column. The sample extract was eluted further by adding more 20ml pentane into the column, thereafter rinsed with 20ml DCM. The eluted sample was allowed to stand overnight at room temperature in a fume cupboard for evaporation to take place.
Sample Separation and Detection: A GC-FID (gas chromatograph – flame ionization detector) equipment model Agilent 6890N was employed for the detection and subsequent separation of the compounds in the samples. 3.0µl of conc. sample was injected into the GC vial then the blank DCM was also injected into the GC micro-syringe for the syringe cleaning prior to sample analysis. The micro- syringe was further washed using the sample, then injected into the column to effect the compounds separation within the sample. After separation, the compounds were allowed passage through a flame ionization detector that detects the sample components. The quantity of BTEX was resolved at a particular chromatogram in mg/kg for the sample. Same procedures were applied for the resolution of THC and PAH in all the samples.
Statistical Analysis
Statistical analysis was carried out using Statistical Package for Social Statistics (SPSS) software for the data got from the field work for sediments and surface water. The various means and standard deviations were separated with the aid of The Duncan’s New Multiple Range (DNMR) Test (p ≤ 0.05).
Results
The results obtained from the analysis of surface water and sediments samples to quantify the heavy metals, PAH, BTEX concentrations and THC in surface water and sediments are shown in various Tables with graphical representations. The analysis of variance results showed that the concentrations of pollutants; heavy metals, BTEX, PAH and THC are significantly different (p ≤ 0.05).
| Surface Water | Sediment | Standard (WHO) | ||||||
|---|---|---|---|---|---|---|---|---|
| Heavy Metal (mg/kg) | Site A | Site B | Control | Site A | Site B | Control | S. Water | Sed |
| Pb | 3.34±0.02a | .43±0.01a | 0.02±0.24a | 6.274±0.002a | 3.23±0.01a | 1.80±0.00a | 0.05 | 2 |
| Cd | 3.518±0.29a | .691±0.2a | 0.004±0.01a | 5.53±0.02a | 2.49±0.2a | .015±0.03a | 0.005 | 0.003 |
| Cr | 4.996±0.01a | .28±0.01a | 0.25±0.04a | 6.821±0.06a | 2.68±0.01a | .66±0.02a | 0.05 | 1.5 |
| As | 4.882±0.06a | .81±0.02a | 0.02±0.02a | 8.55±0.03a | 3.31±0.02a | .035±0.01a | 0.01 | 0.01 |
| Zn | 6.602±0.17a | .04±0.04a | 1.34±0.01a | 9.306±0.17a | 3.44±0.04a | 2.78±0.04a | 1.5 | 3 |
| Cu | 8.149±0.06a | .62±0.02a | 0.02±0.03a | 9.894±0.06a | 2.92±0.02a | .041±0.02a | 0.05 | 0.05 |
| Ni | 3.908±0.00a | .30±0.01a | 0.01±0.00a | 7.213±0.12a | 1.852±0.01a | .014±0.00a | 0.2 | 0.02 |
| Co | 5.274±0.04a | 1.72±0.02a | 0.002±0.01a | 7.137±0.06a | 1.92±0.02a | .015±0.03a | 0.011 | 0.011 |
| BTEX (mg/l) | ||||||||
| Benzene | - | 0.30±0.46a | - | 2.55±0.31a | 3.05±0.01a | - | 0.0001- 0.0003 | 0.1 |
| Toluene | 1.72±0.40 a | 1.80±0.04a | - | - | - | - | 0.0006- 0.0018 | 0.1 |
| O-Xylene | 1.43±0.24a | 1.27±0.22a | 0.003±0.11a | 1.94±0.32a | 1.28±0.12a | - | 0.0001- 0.0003 | 0.2 |
| M-Xylene | 0.80±0.46a | - | - | 3.15±0.09a | 1.88±0.32a | 0.05±0.00a | 0.0001- 0.0003 | 0.3 |
| P-Xylene | - | - | 0.002±0.04a | 1.55±0.31a | 1.40±0.31a | 0.015±0.00a | 0.0001- 0.0003 | 0.3 |
| Ethylbenzene | - | 0.40±0.01a | - | 2.92±0.53 a | 1.94±0.02a | - | 0.0001- 0.0003 | 0.1 |
Table 1: Heavy Metal and BTEX in Surface Water and Sediment. Values represent Mean ± S.E.M at n= 3 and p≤ 0.05. means in the same
The levels of all the heavy metals tested in both surface water and sediments from the study locations were all higher than their allowable limits. Also, the concentrations were more in the samples from Oshika community that the other community. However, in the two locations, the heavy metal contents were more in the sediment than in the water samples. The values in the sediments are about 50% to 100% more in the sediment than in the water samples. Table 1 showed that the concentration of Cu was higher in Site A than Site B with the mean values 8.149±0.06 mg/l and 2.62±0.02 mg/l respectively, while Zn followed with 6.602±0.17 mg/l and 2.04±0.04 mg/l respectively. Co recorded 5.274±0.04 mg/l and 1.72±0.02 mg/l. The other metals were Cr with 4.996±0.01 mg/l and 2.28±0.01 mg/l for the two sites respectively. Arsenic was present with mean value 4.882±0.06 mg/l and 1.81±0.02 mg/l while Ni recorded a mean value of 3.908±0.00 mg/l and1.302±0.01 mg/l for Sites A and B respectively. Cd had mean value of 3.518±0.29 mg/l and 1.691±0.2 mg/l and Pb showed 3.34±0.02 mg/l and 1.43±0.01 mg/l for Sites A and B respectively. However, they all have higher mean values than the permissible WHO limit [12]. The distribution and pattern of heavy metal in the Surface Water for Site A is Cu > Zn > Co > Cr > As > Ni > Cd > Pb while Site B shows Cu > Cr > Zn > Co > Cd > Pb > Ni.
Again, for the characteristics of Sediment in Sites A and B; Pb had a mean values of 6.274±0.002 mg/kg and 3.23±0.01 mg/kg respectively and higher than the standard of 2.0 mg/ kg while Cd had 5.53±0.02 mg/kg and 2.49±0.2 mg/kg for the respective Sites respectively. Cr recorded 6.821±0.06 mg/kg and 2.68±0.01 mg/kg respectively for Sites A and B, Arsenic concentrations were 8.55±0.03 mg/kg, 3.31±0.02 mg/kg for the sites respectively. Zn had 9.306±0.17 mg/ kg and 3.44±0.04 mg/kg mean values for Sediment Sites A and B respectively. Cu recorded mean values of 9.894±0.06 mg/kg and 2.92±0.02 mg/kg respectively. Ni on the hand recorded mean values of 7.213±0.12 mg/kg and 1.852±0.01 mg/kg respectively while Co had 7.137±0.06 mg/kg and 1.92±0.02 mg/kg for site A and B respectively. Although all the values obtained from Site A are higher than those of Site B, all the values obtained were higher than the control for all sites except Zn in Site B for surface water that is lower than the control and WHO permissible limit. The result obtained from the Sediment shows a pattern and distribution of heavy metals in Site A as Cu > Zn > As > Ni > Co > Cr > Pb > Cd while Site B shows Zn > As > Pb > Cr > Cd>Co > Ni. The lower values observed at Site B (Ogoni land) could be attributed to the previous cleaned up exercised carried out in that area.
The results from the study could be seen at a glance from Figure 2 when comparing the values of heavy metals in Water from Sites A and B, as that of A is by far higher than that of B, This difference is attributed to the on-going remediation and general clean-up of Ogoni land project by the Federal Government of Nigeria called Hydrocarbon Pollution Remediation Project (HYPREP) in collaboration with United Nations Environmental Programme (UNEP). Site B, Egbalor is in Ogoni land.
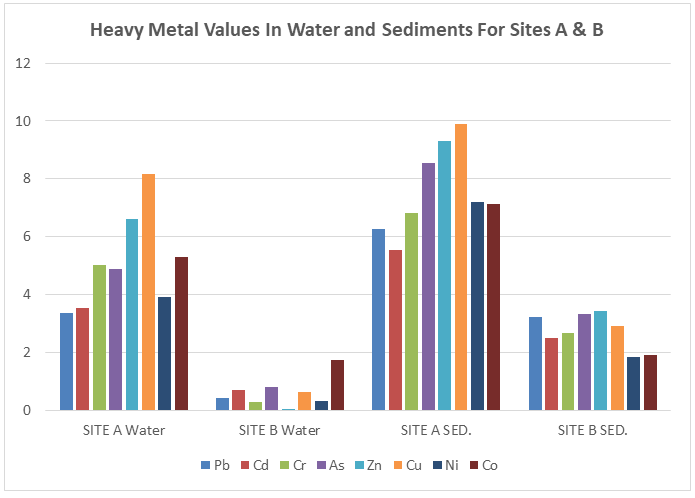
Also, a comparison between the heavy metals in water to sediment as in Table 1 and Figure 2 shows that the values in the sediment is higher than that of water which is in line with the results of other scholars Egbeja, et al. [9, 13, 14] as sediments enhances the detection of pollutants that otherwise may not be detected in surface water.
Figure 3 shows at a glance that the values of heavy metals are higher in Site A that in site B with both sites higher than the WHO permissible standard although Zn is lower than the standard in site B water.
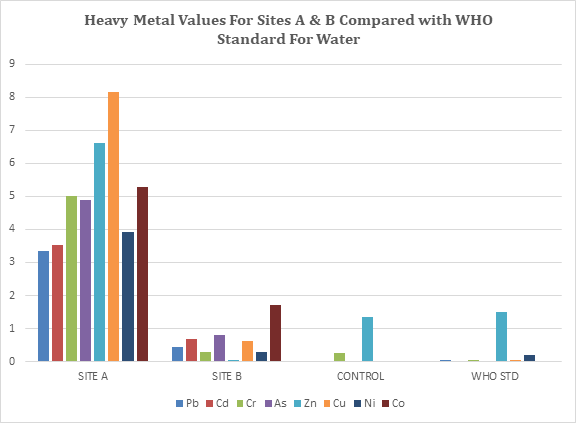
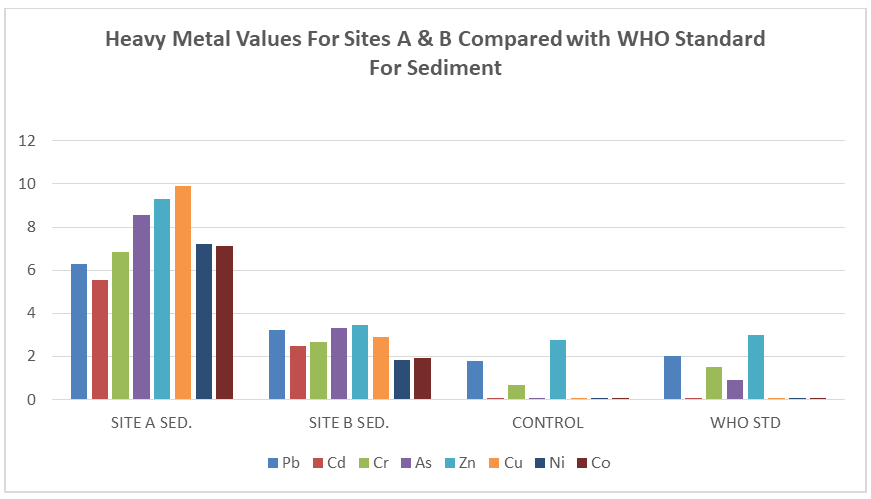
Figure 4 shows at a glance that heavy metal values from both sites are higher than the control and WHO Standards for sediment.
The BTEX levels in the surface water shows that Benzene was not detected at Site A but recorded in Site B sample with mean value of 0.30±0.46 mg/l. Toluene was present in both Sites A and B with mean values of 1.72±0.40 mg/l. and 1.80±0.04 mg/l.. O-Xylene was present in Sites A and B with mean values of 1.43±0.24 mg/l. and 1.27±0.22 mg/l while M-Xylene was present in Site A only with the mean value of 0.80±0.46 mg/l. Ethylbenzene was not detected in Site A samples but present in Site B with a mean value of 0.40±0.01 mg/l.. However, the values recorded were all above the WHO permissible limit. Meanwhile, BTEX for Sediment at Site A has a lower Benzene hydrocarbon than Site B with mean values 2.55±0.31 mg/kg and 3.05±0.01 mg/kg, while Toluene was below detection limit at all the Sites. M-Xylene mean values were high at both Sites amongst the Xylene group with M-Xylene 3.15±0.09 mg/kg, 1.88±0.32 mg/kg followed by O-Xylene 1.94±0.32 mg/kg and 1.28±0.12 mg/kg for Sites A and B respectively. P-Xylene recorded 1.55±0.31 mg/kg and 1.40±0.31 mg/kg for the respective sites. Ethylbenzene values were 2.92±0.53 mg/kg and 1.94±0.02 mg/kg for Sites A and B. All the BTEX mean values were higher than the WHO permissible limits.
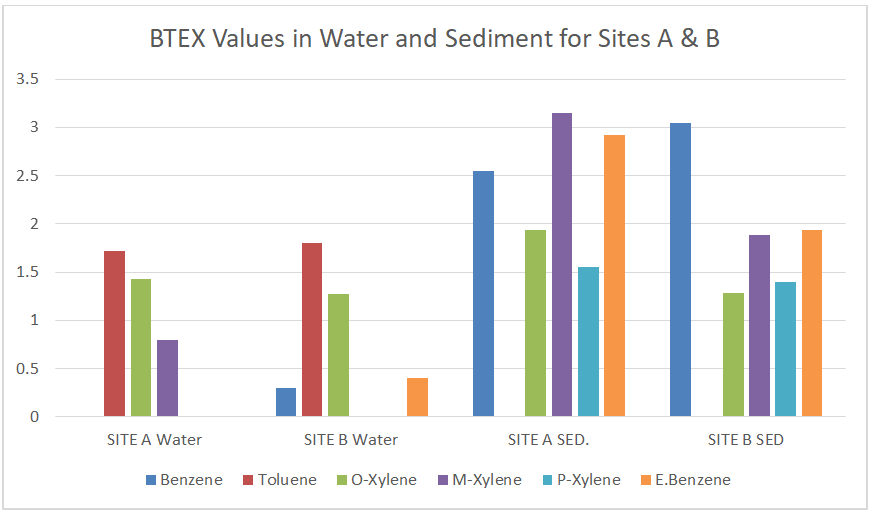
Figure 5 shows at a glance the BTEX as recorded from the study. Site A has no Benzene, P-Xylene and Ethylbenzene, but has Toluene, O-Xylene and M-Xylene while Site B has Benzene, Toluene, O-Xylene, and Ethylbenzene in water. It also shows Benzene, O-Xylene, M-Xylene, P-Xylene and Ethylbenzene in both sites A and B with more spread in Sediment but no Toluene observed. The values are also higher than the control sample and the WHO permissible standard. It is also observed that the control values are higher than the WHO standard. This is attributed to other anthropogenic sources like seismic and oil exploration, agricultural (that involves pesticides, herbicides and other agro-based chemicals) marine transportation, waste/ refuse dump incineration other than the illegal refinery operations are common activities within the Niger Delta region. Illegal refinery activities have been implicated in the contamination and pollution of other water bodies like fish ponds, farms and streams that a far away from its activities; fumes and black soot emanating from its operations and destruction by burning the illegal sites by government agencies [15].
| PAH (mg/l) | Surface Water | Sediment | *Standard | ||
|---|---|---|---|---|---|
| Site A | Site B | Site A | Site B | ||
| Naphthalene | 7.16±0.10b | 4.12±0.01c | 174.52±0.01a | 86.12±0.01c | |
| Acenaphthylene | 1.85±0.02b | 2.62±0.02b | 293.98±0.01a | 184.62±0.02b | |
| Acenaphthene | 13.25±0.14b | 15.52±0.12c | 157.43±0.24a | 78.52±0.12c | |
| Fluorene | 28.01±0.116a | - | - | - | |
| Phenanthrene | 10.49±0.283b | 8.22±0.21a | 113.24±0.025a | 174.22±0.21a | |
| Anthracene | - | - | - | - | |
| Fluoranthene | - | - | 252.55±0.027a | - | |
| Pyrene | 6.14±0.069b | 9.52±0.02a | 149.01±0.008a | 124.52±0.02a | |
| Benzo(g,h,i)perylene | - | 2.25±0.01c | - | 92.25±0.01c | |
| Benz(a)anthracene | - | - | 310.49±0.283a | - | 0.1mg/l |
| Chrysene | 4.49±0.001b | 2.02±0.01a | 187.85±0.027a | 164.02±0.01a | 0.2mg/l |
| Benzo(b)fluoranthene | - | - | - | - | 0.2mg/l |
| Benzo(k)fluoranthene | - | - | - | - | 0.2mg/l |
| Benzo(a)pyrene | - | - | - | - | 0.2mg/l |
| Indeno(1,2,30cd)pyrene | - | - | - | - | 0.4mg/l |
| Dibenz(a,h) anthracene | - | - | - | - | 0.3mg/l |
| TOTAL | 71.4 | 44.27 | 1639.08 | 904.27 | |
| Σ Carcinogenic PAHS | 4.49 | 4.25 | 498.34 | 256.27 | |
| ‰ Carcinogenic | 6.29 | 9.5776 | 30.4 | 28.34 |
Table 2: Polycyclic Aromatic Hydrocarbon Characteristics of Surface Water and Sediment. Values represent Mean ± S.E.M at n= 3 and
Table 2: Polycyclic Aromatic Hydrocarbon Characteristics of Surface Water and Sediment. Values represent Mean ± S.E.M at n= 3 and p≤ 0.05. Means in the same row with the same superscript alphabets are not significantly different, while means in the same row with different superscript alphabets are significantly different at p ≤ 0.05 *USEPA Regulatory Standards for Polycyclic Aromatic Hydrocarbons (PAH) in water, fish and plants [16].
Table 2 shows the Surface Water and Sediment Characteristics for Polycyclic Aromatic Hydrocarbon (PAH). Fluorene was detected only in surface water at Site A while Fluoranthene was detected in Site A sediment only. Chrysene as a carcinogenic PAH was present in both Sites A and B 4.49±0.001 mg/l and 2.02±0.01 mg/l mg/l-, while Benzo (g,h,i) perylene was observed at Site B with a mean value of 2.25±0.01 mg/l in surface water. The total PAH for Surface Water was 71.40 mg/l and 44.27 mg/l for Sites A and B while the summation of carcinogenic PAH was 4.49 mg/l and 4.24 mg/l in Sites A and B. The total percentage of carcinogenic PAH present at both sites were 6.29 and 9.58 respectively for the surface water. The Total PAH recorded from Sites A and B for the Sediments are 1639.08 mg/kg and 904.27 mg/kg respectively while the total summation of carcinogenic PAH found are 498.34 (Benz(a)anthracene and Chrysene) and 256.27(Chrysene) Sites A and B respectively. The values were all above the permissible WHO limit. The total PAH found in the sediment was higher than those observed in the surface water and the percentage of carcinogenic PAH in sediment was also higher than those of the surface water.
| Hydrocarbon | Surface Water | Sediment | ||
|---|---|---|---|---|
| Site A | Site B | Site A | Site B | |
| C8 | - | - | 484.52±0.3a | 435.95±0.55a |
| C9 | - | - | - | 702.16±0.09a |
| C10 | 82.19±0.11b | 67.22±0.12b | 1263.94±0.02a | 928.48±0.16c |
| C11 | - | - | - | - |
| C12 | - | - | 513.35±0.20a | 1121.9±0.52a |
| C13 | - | - | - | 394.43±9.25a |
| C14 | - | 72.19±0.11b | 473.42±0.24a | 781.85±0.49a |
| C15 | 71.24±0.14b | 59.04±0.06b | 1150.03±0.02a | - |
| C16 | - | - | 339.7±0.40a | - |
| PRISTON | - | - | 611.13±0.08a | 323.72±0.42c |
| C17 | - | - | - | - |
| C18 | 35.1±0.06b | 43.10±0.01b | 773.47±0.27a | 501.25±0.14a |
| Ph | 98.12±0.07b | 92.20±0.06b | 962.94±0.02a | 195.88±0.05 |
| C19 | - | 254.13±0.06a | - | |
| C20 | 51.94±0.02b | 1173.74±0.01a | 863.12±0.07c | |
| C21 | - | - | - | |
| C22 | - | 38.19±0.01b | - | 394.14±0.09a |
| C23 | - | - | 558.5±0.29a | |
| C24 | - | 553.19±0.00a | - | |
| C25 | - | 152.82±0.00a | 257.95±0.03a | |
| C26 | - | - | - | |
| C27 | - | - | 406.92±0.01a | |
| C28 | - | - | 217.90±0.03a | |
| C29 | - | - | - | |
| C30 | - | - | 176.16±0.09a | |
| C31 | - | - | - | |
| C32 | - | - | - | |
| C33 | - | - | - | |
| TOTAL | 338.59 | 371.94 | 8706.38 | 8654.29 |
Table 3: Total Hydrocarbon Content of Surface Water and Sediment. Values represent Mean ± S.E.M at n= 3 and p≤ 0.05. Means in the
Table 3 showed that hydrocarbon C8 and C9 were recorded in the sediments at the two sites but were not detected in the surface water. There were more hydrocarbons generally occurring in the sediments than in the surface water as shown by the result of the THC 8706.38 mg/kg and 8654.29 mg/kg for sites A and B, 338.59 mg/kg and 371.94 mg/kg respectively. This also implied that Site A had more hydrocarbons in the sediment than Site B while Site B has more hydrocarbons than Site A in surface water.
Generally, the study showed that heavy metal content (Cd, Ni, As, Zn, Cu, Co, Cr, Pb) were determined by using the Atomic Absorption Spectrophotometer (AAS) for surface water and sediments, the mean values were found to be higher than the permissible WHO standard from anthropogenic activities like illegal petroleum refinery from the two sites. This agrees with research findings of other scholars that water sediments serve as sink for heavy metals [9, 13] Cu, Zn, Co, Cr and As recorded the highest concentration while Cd, Ni and Pb showed the lowest concentrations. The distribution and pattern of heavy metal in the Surface Water for Site A is Cu > Zn > Co > Cr > As > Ni > Cd > Pb while Site B shows Cu > Cr > Zn > Co > Cd > Pb > Ni. All the Tables show that Petroleum hydrocarbons were found in both surface water and sediments from both sites. This also is as a result of incessant oil spill and disposing of the residue and waste from the illegal refinery into the adjoining stream and mangrove forest. The sediment mean values are higher than that of surface water and Site A higher than Site B. The high mean value of Site A is as a result of the National Ogoni land Clean-up and remediation being carried in Site B area. The BTEX mean values are also higher in sediment than in surface water and are well above the permissible limits standard recommended by WHO.
From the Table 3 for surface water and sediment characteristics, total PAH is 71.40 and 44.27 for Sites A and B while the summation of carcinogenic PAH is 4.49 and 4.24 in Sites A and B. Chrysene as a carcinogenic PAH is present in both Sites A and B 4.49±0.001b and 2.02±0.01a, while Benzo(g,h,i)perylene is present in Site B with a mean value of 2.25±0.01c. The total percentage of carcinogenic PAH present at both sites are 6.29% and 9.58 respectively for surface water, while the total PAH recorded from Sites A and B for the Sediments are 1639.08 and 904.27 respectively. The total summation of carcinogenic PAH found are 498.34 (Benz (a) anthracene) and Chrysene) and 256.27(Chrysene) Sites A and B respectively. They are all above the permissible WHO limit.
Several scholars; Onwuna DB, et al. [17], Igben JL, et al. [18], Nwachoko N, et al. [19], Douglas SI, et al. [20] have carried out similar studies in the Niger Delta as the problem of illegal refinery is unique and peculiar to Nigeria. They all agree that its activities in the Niger Delta region are disastrous to the entire ecosystem leading to ecological damage and consequently threatening food security of the country. Whereas other petroleum oil producing countries do not have such experience but try to contain issues of oil spillage and theft.
Conclusion
The heavy metal concentration was found to be high in the surrounding surface water and sediments. Although they are found more in sediments than in the surface water and are all above the control and the WHO permissible limit. PAHs, BTEX and THC were detected in surface water and sediments with higher mean values than the WHO standard. This could pose some degree of danger to community members that use the surface water from the stream for drinking especially with the detection of carcinogenic PAHs.
References
-
Gideon F (2022) Nigeria’s Illegal Oil Refineries: What to Know about How They’re Harming People & Planet. Global Citizen.
-
Adedapo OA, Adedibu SA, Odunayo TO, Oladotun AO, Adetola HA, et al. (2022) Crude oil exploration in Africa; Socio-economic implications, environmental impacts and mitigation strategies. Environmental Systems and Decisions 42: 26-50.
-
Beyer J, Goksoyr A, Hjermann DO, Klungsoyr J (2020) Environmental effects of offshore produced water discharges: a review focused on the Norwegian continental shelf. Mar Environ Res 162: 105155.
-
Pathak C, Mandalia HC (2012) Petroleum industries: environmental pollution effects, management and treatment methods. Int J Sep Environ Sci 1(1): 2163- 3851.
-
Jiang D, Chen L, Xia N, Norgbey E, Darkwah WK, Koomson DA, et al. (2020) Elevated atmospheric Co2 impact on carbon and Nitrogen transformations and microbial community in replicated wetland. Ecol Process 9(1): 57.
-
Ore OT, Adeola AO (2021) Toxic metals in oil sands: review of human health implications, environmental impact and potential remediation using membrane- based approach. Energy Ecol Environ 6: 81-91.
-
Akpomrere OR, Uguru H (2020) Ecotoxicity Effect of Illegal Refineries on the Environment: A Case Study of Delta State, Nigeria. International Journal of Innovative Agriculture & Biology Research 8(2): 40-49.
-
Alexander O (2022) Nigeria’s illegal oil refineries keep killing people. Quartz, Africa.
-
Egbeja TI, Kadiri JU, Onoja AO, Isah AO (2019) Determination of heavy metals in water, sediments and tissues of Clarias garipienus and Oreochromis niloticus from Kpata River, Lokoja, Nigeria. International Journal of Fisheries and Aquatic Studies 7(5): 25-29.
-
Anifowose B, Lawler D, Horst VD, Chapman L (2014) Evaluating interdiction of oil pipelines at river crossings using Environmental Impact Assessments. Area 46: 4-17.
-
Aminayanaba A, Omokhua G (2013) Environmental Impact of illegal refineries on the vegetation of the Niger Delta, Nigeria. Journal of Agriculture and Social Research 13(2):121-126.
-
WHO (1996) Permissible limits of heavy metals in soil and plants, Geneva, Switzerland.
-
Funtua MA, Dailami SA, Onakpa SA (2016) Heavy metal contents of Water, Sediment and Fish from Kpata River Lokoja, Kogi State-Nigeria. International Journal of Environmental Science and Toxicology Research 4(9): 162-168.
-
Aderinola OJ, Clark EO, Olarinmoye OM, Kusemiju V, Anatekhai MA, et al. (2009) Heavy metals in surface water, sediments, fish and periwinkles at Lagos lagoon. American-Eurasian J of Agriculture and Environmental Science 5(5): 609-617.
-
Dimkpa HI, Dimkpa CA (2023) Crude oil contaminated river fishes arising from activities of illegal petroleum refineries in Oshika and Egbalor Communities in the Niger Delta Region of Nigeria. Journal of Petroleum and Mining Engineering 25(2): 38-44.
-
USEPA Regulatory Standards for Polycyclic Aromatic Hydrocarbons (PAH) in water, fish and plants.
-
Onwuna DB, Stanley HO, Abu GO, Immanuel OM (2022) Impact of Artisanal Crude Oil Refinery on Physicochemical and Microbiological Properties of Oil and Waterin Igia-Ama, Tombia Kingdom, Rivers State, Nigeria. Asian Journal of Environment Ecology 19(3): 56-67.
-
Igben JL (2021) Artisanal petroleum refining and occupational dynamics in the Niger Delta, Region, Nigeria. Journal of Applied Science and Environmental Management 25(3): 341-345.
-
Ndidi N, Bekenbo D, Gbenenee TJ (2020) Impact of illegal crude refining in Jike-Ama River of Bille Kingdom, Rivers State, Nigeria. International Journal of Biochemistry Research and Review 29(6): 46-51.
-
Douglas SI, Cornelius BT (2019) Impacts of Artisanal crude oil refining activities in soil microorganisms. Journal of Advance Biology and Biotechnology 20(3): 1-9.
- Nigeria’s Vulnerability in the Face of Global Energy Policy
- A Simulation Study of Investigation of Optimum Oil Production Performance by Applying Various Gas Injection Methods in Oil Reservoir
- Characterization of Permo-Triassic Reservoirs through Thermal Maturity Assessment of Westphalian Source Rocks in the Cheshire Basin
- Influence of Microwax on the Rheological and Thermal Behaviour of a Wax Crude Oil
- Real-Time Monitoring and Performance Optimization of Steam Injection in Heavy Oil Reservoirs Using Fiber Optic Sensing and Integrated Predictive Simulation Models
- Rapid On-Site Determination of the Total Petroleum Hydrocarbon Content of Soils by Handheld Fourier Transform Near-Infrared Spectroscopy: Development of a Global, Site- and Scanner- Independent Calibration Model