Efficient Model for Estimation of Dew Point Pressure in Gas Condensate Systems
Gas condensate reservoirs are a special class of gas reservoirs with temperatures which plot between the critical point temperature Tc and the cricondentherm Tcric on a Pressure–Temperature (P-T) phase diagram. The reservoirs’ produced streams are characterized by relatively, low C1 : C2+ratio, implying compositions with significant fractions of high molecular weight (C2+) hydrocarbons, called Natural Gas Liquids (NGLs). NGLs exist as gas at reservoir conditions of high pressures and temperatures but as liquids, called condensates (or distillates) at separator conditions, havinge higher market price than separator gas fractions. Condensation of NGLs can occur within reservoirs if reservoir pressures fall to the reservoir’s Dew Point Pressure (DPP) during production. Condensates formed within reservoirs are never produced owing to their less than critical saturation. Therefore, accurate estimation of DPP and ensuring production occurs above such estimates, is necessary for ensuring optimum productivity and profit. Correlations have proven valuable in providing quick DPP estimates, however, the several correlating parameters of common types, make them computationally intense, yet their associated errors remain immense. This study aims at presenting a simple correlation, with fewer correlating parameters that would guarantee better accuracy when compared to other popular models. A new correlation for DPP as a function of gas compositional analysis data and reservoir temperature was developed using method of multiple regression analysis. A total of 1,568 gas condensate datasets from 984 reservoirs obtained from literature with unrestricted geographic locations were used to develop the model. These data were divided in the ratio of 3:1:1 for training, cross validation and testing. The results obtained showed that the new correlation significantly outperforms other existing popular industry models and provides predictions with higher accuracy. This was verified in terms of highest correlation coefficient, lowest average absolute percentage error and lowest root mean square error.
Introduction
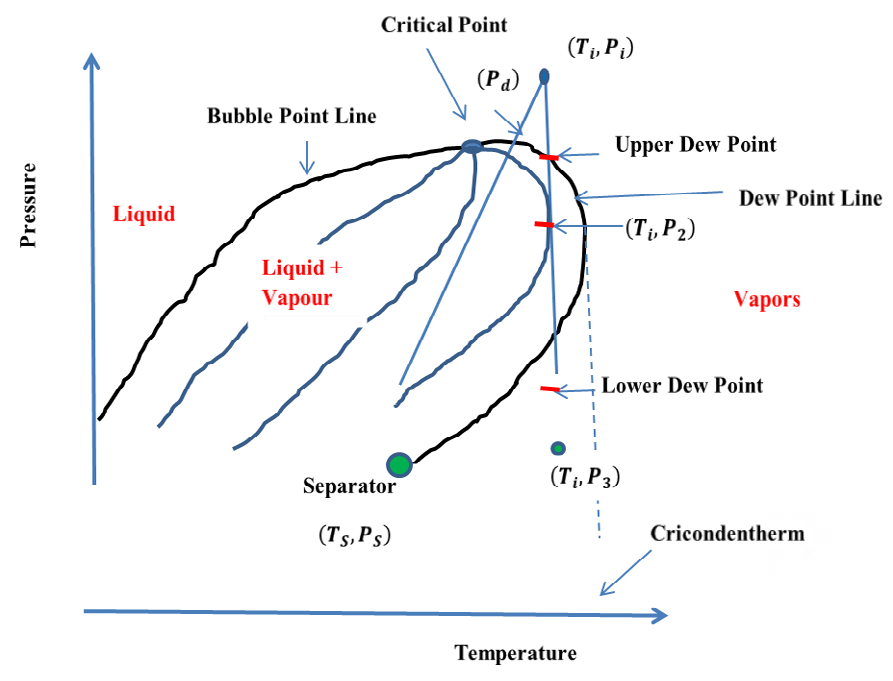
Gas condensate reservoirs are a special class of gas reservoirs with very rich gas composition which has high economic value. This is because of the prevalence of high molecular weight fractions in gas condensate reservoirs which condense at separator conditions to give premium fuel of high market price. Figure 1 below is a Pressure-
Temperature phase diagram showing a gas condensate reservoir at initial conditions of reservoir temperature, Ti and pressure, Pi.
When put on production, the path of production to surface separators is one of decreasing temperature and decreasing pressure as the fluid moves from the reservoir to the separator, as shown in figure 1 by the path (Ti, Pi) to (Ts, Ps). The separator conditions fall within the two phase (liquid and vapour) region and so, two phases are obtained in the separator: a gas phase, (consisting mainly of methane (C_1) and small amounts of mostly ethane (_C_2+) and a liquid phase, called condensates or distillates consisting of heavier molecular weight hydrocarbons (_C_3+) collectively called Natural gas Liquids (NGLs). Condensates have higher market price than separator gas, therefore, producing the NGLs as components of the produced gas stream is very profitable to the operator. Condensation occurs when the gas pressure falls to or below the dew point pressure, (_Pd) which is the pressure at which the first drop of liquid condenses out of a gas stream as its pressure decreases such as during production. At the dew point, the gas phase is said to have just become ‘saturated’. The drop of liquid formed at the dew point forms a separate (liquid) phase which remains in equilibrium with the predominantly gas phase, as shown in the two phase region in figure 1. At the low separator temperature and pressure, significant volume of condensates is attained.
Within the reservoir, path of decreasing pressure at constant reservoir temperature (isothermal condition) is shown by the path joining (Ti, Pi) to (Ti, P3). Pressure falls from an initial pressure of Pi and continues to drop as production from the reservoir continues, at constant reservoir temperature. If production continues and the reservoir pressure falls to the point labelled as upper dew point which is the saturation or dew point pressure, a drop of liquid would condense out of the vastly gas phase and remain in equilibrium with it as a new phase, thus, forming two phases. The fact that gas phase condenses to form a liquid phase at reducing pressure conditions is contrary to physical laws which would rather stipulate further expansion on decreasing pressure on a gas phase. This phenomenon is therefore, termed “retrograde condensation” or ‘abnormal condensation’. Retrograde condensation in reservoirs occurs in gas condensate reservoirs only. If production continues after the upper dew point is reached, more condensates form within the reservoir, and may can continue up until some point of maximum liquid condensation, depicted in figure 1 as (Ti, P2). The liquid formed inside the reservoir is usually never producible to the surface because the saturation, even at its maximum, is usually below the critical saturation required to guarantee flow. Therefore, the liquid accumulates within the pores around the wellbore where pressure is lowest.
This accumulation of condensates around the near wellbore region is termed “condensate banking”.
After the maximum liquid condensation is attained, at (Ti, P2) in figure 1, further decline in pressure would cause the liquid phase formed to begin revapourizing. If it were possible to continue to produce the reservoir to very low reservoir pressures, a lower dew point pressure would be reached where the last drop of liquid initially formed, is at equilibrium with a vast amount of gas. Below the lower dew point pressure, all the condensates previously formed in the reservoir would revapourize to give a single gas phase at conditions depicted in figure 1 as (Ti, P3). However, attaining total revapourization is not practically attainable because production from most gas condensate reservoirs reach economic limits at pressures way above the lower dew point pressure, making it impossible for the condensed fluid to be completely revapourized and produced.
Condensate banking is an unfavourable occurrence because it causes economic losses to the operator. This is because, the constituents of the gas which condense in the reservoir are majorly the heavy molecular weight fractions (C3+) which would otherwise form condensates within the separator. When condensates begin to form in reservoirs, produced streams from such reservoirs witness lower yields of condensates at the separator and thus, lower income for the operator. Good reservoir management requires that retrograde condensation in reservoirs be avoided by all means. Moreover, the accumulating oil banks in reservoirs tend to hinder free flow of gas through it towards production wells, thus decreasing the effective permeability to gas. This would result in diminishing gas volumes at the surface, thus, decreasing proceeds from gas sales, further decreasing the profit margin of the operator Figure 1.
Knowledge of the upper dew point pressure, which for simplicity, would be referred to as just, Dew Point Pressure
(DPP) in this study, is very important for effective reservoir management and to avoid loss of productivity of both gas and condensates. Different approaches are available for obtaining dew point pressures values of retrograde gas condensate reservoirs. One approach is by experimental measurements of collected laboratory samples. This approach is generally acclaimed to be accurate; however, it is costly in terms of money and time expended and requires specialized skills by laboratory experts to obtain reliable results.
Another approach involves the use of equations of state (EOS). This method is not straight forward but requires amongst other challenges, making a choice of a reliable EOS out of the several available, splitting of the heptane plus fraction of gas mixture into a number of pseudo-fractions and characterization of each of the sub-fractions. Also, parameters of the selected EOS have to be tuned with some experimental data such as constant volume depletion or constant composition expansion data to improve the accuracy of the estimates. This method is iterative and accuracy is limited to the accuracy afforded by the selected EOS and the data set used for the EOS tuning. Dew point pressures can also be calculated using equilibrium ratios (K-values). This approach involves trial and error as K-values are also dependent on pressures. Moreover, K-value approaches at high pressures are not precise, diminishing the reliability at such conditions. Another approach to determining DPP is by use of empirical correlations. Correlations are by far the easiest to apply. They can be programmed easily using straight forward, algorithms without need for characterizing and splitting the heptane plus fractions into pseudo components as is the case with EOSs.
Literature Review
Efforts to relate dew point pressures to reservoir parameters started quite early as the need for better understanding of and for optimum production of gas condensate reservoirs gained attention. Olds, et al. [1, 2] are among the first researchers to estimate the DPP for gas condensate reservoirs from reservoir fluid properties. Olds, et al. [1] studied the behavior of reservoir fluids’ composition on DPP and established a correlation between the two. The data used for the study was based on reservoir fluids from Paloma field. They found that the intermediate molecular weight components have greater influence, albeit inverse proportionality, to DPP than does temperature changes. Sage and Olds in 1947, conducted experiments to study the behavior of five paired samples of oil and gas obtained from wells in San Joaquin fields in California. The study resulted in development of a correlation that relates retrograde dew-point pressure to the gas-oil ratio, temperature and stock-tank oil API gravity. They presented the results of the correlation in tabulated and graphical forms which make it difficult to be programmed easily with calculators or computers. The correlation’s applicability is for the gas-oil ratio ranges of 15,000-40,000 scf/STB, for temperature range of 100-220°F, and for oil API gravity range of 52°-64°.
Organick and Golding [3] presented a graphical correlation in form of 14 working charts that can be used to estimate saturation pressures of gas condensates and volatile oils as a function of modified weight average equivalent molecular weight and a molal average boiling point. The authors noted that, the correlation cannot be used with confidence for simple mixtures and pure components. Published mathematical correlations for estimating dew point pressures that can be programmed with computers can be classified into three different groups. The first category estimates dew point pressures as functions of temperature and gas compositions obtained from pressure-volume-temperature (PVT) data routinely measured in laboratories. The second estimates DPPs as functions of temperature and field production data. The third category is based on artificial intelligence approaches, such as genetic programming, machine learning, artificial neural networks (ANN), and others, to estimate DPP.
Nemeth and Kennedy [4] were the first to present a mathematical correlation to be used in estimating dew point pressure of gas condensate mixtures as functions of mixtures’ chemical composition, temperature and characteristics of the heptane plus fraction. Nemeth and Kennedy’s correlation is included as Appendix I(a). Elsharkawy [5, 6] presented another mathematical correlation to determine the DPP for gas condensate reservoirs as a function of routinely measured gas analysis and reservoir temperature. The model was developed using 340 experimentally measured data within a pressure range of 1560-11830 psi and temperature ranging from 40 to 340°F. The correlation has 19 constants, all non-integers as shown in Appendix I (b).
Humoud and Al-Marhoun investigated the relationships of gas condensate fluid dew point pressures to field production data and fluid compositional data using seventy four data sets obtained from Middle East gas condensate fields. They presented an empirical correlation which predicts DPP of gas condensate fluids as a function of reservoir temperature, pseudo reduced pressure and temperature, primary separator gas to oil ratio, primary separator pressure and temperature, relative densities of separator gas and the heptane-plus fraction. Mathematically,
$$DPP = f \left( T_R, R_{SP}, P_{SP}, T_S, P_{Pr}, T_P, \gamma_{G_{SP}}, \gamma_{C_{+}} \right)$$
Where,
$$T_R = \text{reservoir temperature}$$
SP R = primary separator gas-oil ratio SP P = primary separator pressure SP T = primary separator temperature Pr P = pseudo reduced pressure Pr T = pseudo reduced temperature SP g γ = primary separator gas specific gravity (air =1)
7 C γ + = heptanes-plus specific gravity (air = 1). Their correlation has the form as shown by the equation of Appendix I(c).
In 2002, Marruffo presented a correlation (Appendix I(d)) for estimating retrograde DPP as a function of Gas Condensate Ratio (GCR), degree API gravity, reservoir temperature and percentage heptane plus fraction.
As earlier noted, the determination of dew point pressures of gas condensate reservoirs from laboratory measurements is expensive and time consuming. These shortcomings provide the greatest strengths for the use of mathematical relations that can be programed with computers for estimating DPPs of retrograde gas condensate reservoirs. Unfortunately though, most published correlations are complex, having several non-integer correlation parameters and their uses in estimation of DPP are associated with high errors which diminish confidence on their use. Therefore, developing a simple correlation for estimating dew point pressure for gas condensate reservoirs with lower errors (Average Absolute Deviation (AAD) and Root Mean Square Error (RMSE)), than can be presently achievable with existing correlations is the objective of this study.
Model Development
A total of 1,568 gas condensate datasets from 984 reservoirs obtained from literature from unrestricted geographic locations were used to develop the model. Data parameters consisted of gas condensate fluid compositions, heptane plus (_C_7+) specific gravities and molecular weights, fluid temperatures and experimentally measured DPP values. These data were divided in the ratio of 3:1:1 for training, cross validation and testing sets. Sixty percent of the data were used to develop the correlation, twenty percent were used to validate same. Twenty percent of data not previously used, were deployed to test the accuracy and performance of the correlation developed. DPP estimates with the new model were compared to results from three popular industry correlations, namely, Nemeth & Kennedy’s (NK), ElSharkarwy’s (ES), and Organick & Golding’s (OG).
The ranges of fluid properties used for this study are as shown in Table 1 below.
| Parameter | Minimum Value | Maximum Value |
|---|---|---|
| T , reservoir temperature in °F f | 40 | 337 |
| γ C 7+ , heptane plus specific gravity | 0.53 | 0.85 |
| MWC 7+ , Molecular weight of heptane plus fraction | 110 | 253 |
| P , Experimentally measured DPP (psia) d | 2651 | 11830 |
| Mole Composition of Gas Mixture Constituents | 0 | 3.9 |
| CO (mole %) 2 | 0 | 9.31 |
| H S (mole %) 2 | 0 | 0.87 |
| N (mole %) 2 | 57.8 | 95.2 |
| C (mole %) 1 | 1.62 | 14.15 |
| C (mole %) 2 | 0.35 | 6.89 |
| C (mole %) 3 | 0.08 | 1.79 |
| iC (mole %) 4 | 0.26 | 2.58 |
| nC (mole %) 4 | 0 | 2.52 |
| iC (mole %) 5 | 0.04 | 1.68 |
| nC (mole %) 5 | 0 | 1.21 |
| C (mole %) 6 | 0.05 | 1.78 |
| C + (mole %) 7 | 0.39 | 11.18 |
Table 1: Ranges of Gas-Condensate Fluid data.
Development of the new correlation was based on analysis of several linear and non-linear combinations of mole percent of hydrocarbon and non-hydrocarbon gas components, reservoir temperatures in degree Fahrenheit, and properties of heptane plus fractions, being the independent variables, as functions of dew point pressure, as the dependent variable. Performances of the various models in approximately reproducing known values of experimentally determined DPPs for similar compositions and reservoir temperatures were evaluated using developed FORTRAN 90 program and PLATO IDE*, a commercial FORTRAN compiler.
A fewer number of models which showed promise in correlating the experimental dew point pressure data was selected and sensitivity on the presence of, coefficients and exponents of various terms in the models were investigated. Parameters that were found to influence DPP were retained and those that had almost no influence were excluded. In line with the study’s objective of keeping the model simple, terms with powers greater than two were eliminated, and though with painstaking effort, improved accuracy was sought with only integer numbers. The optimum model was selected based on minimization of absolute average relative deviation (AAD), defined by equation (2). A lower value of AAD is indicative of a better correlation.
1 , % / *100 n
$$ A A D, \% = \frac {1}{n} \sum_ {i = 1} ^ {n} \left| \left[ \left(D P P _ {e s t} - P _ {d}\right) / P _ {d} \right] _ {i} * 1 0 0 \right| \tag {2} $$ ( )
1 Where, n = number of data points used, so that i = 1, 2, 3,…n and DPPest is estimated value of DPP using correlation, Pd is dew point pressure obtained by experimental measurements. The final form which satisfied the requirement of simplicity as well as minimization of AAD from this study is shown as equation (3) below, consisting of only EIGHT additive terms with simple correlation constants, all of which are integers.
$$ \begin{array}{l} D P P = \left(T _ {f}. z C _ {1}. z C _ {2}. z C _ {3}\right) - 5 4 \left(\frac {M W _ {C _ {7 +}}}{\left(Z C _ {1} + \gamma_ {C _ {7 +}}\right)}\right) - 5 5 \left(\frac {M W _ {C _ {7 +}}}{\left(Z C _ {1} + Z C _ {2} + Z C _ {3}\right)}\right) + 5 9 \left(M W _ {C _ {7 +}}\right) + \\ 9 8 \left(z H _ {2} S + z C O _ {2} + z N _ {2}\right) + 9 8 \left(M W _ {C _ {7 +}} \cdot \gamma_ {C _ {7 +}} ^ {2}\right) + 1 2 8 \left(z C _ {7 +}. M W _ {C _ {7 +}} \cdot \gamma_ {C _ {7 +}}\right) + 7 7 3 \left(z C _ {1}\right) \\ \end{array} $$ (3) Where, DPP is dew point pressure, to be estimated in psia, fT is reservoir fluid temperature in 0 F
7 C γ + is specific gravity of heptane plus fraction,
7 C MW + is molecular weight of heptane plus fraction and is mole fraction of gas constituents.
Results and Discussions
The performance of the model from this study was compared with performances of three other popular industry models for estimating DPP. The other models are: Organick and Golding’s, Nemeth and Kennedy’s and Elsharkawy’s. The data used for performance comparison of the models was based on data consisting of varying fluid compositions, wide ranges of reservoir temperatures, varying amounts of molecular weights and specific gravities of heptane plus fractions and measured DPP values from literature Elsharkawy [5], which were not used in the development of the model. The results of estimated DPPs using the various correlations are shown in table 3. The samples are arranged and labelled as in the original paper of reference 1. However, the samples labelled B1 through to B7 in Table 2 correspond to the samples contained in columns 9 through 15 of reference [5] that were without sample labels.
| A1 | M1 | T1 | 66 | E1 | 45 | Mix2 | B1 | B2 | B3 | B4 | B5 | B6 | B7 | |
|---|---|---|---|---|---|---|---|---|---|---|---|---|---|---|
| A1 | M1 | T1 | 66 | E1 | 45 | Mix2 | B1 | B2 | B3 | B4 | B5 | B6 | B7 | |
| H S 2 | 0.0 | 0.0005 | 0.0 | 0.00 | 0.0 | 0.00 | 0.00 | 0.00 | 0.00 | 0.0001 | 0.00 | 0.00 | 0.0075 | 0.00 |
| CO 2 | 0.0 | 0.0650 | 0.0045 | 0.0097 | 0.0010 | 0.0018 | 0.0864 | 0.0082 | 0.0095 | 0.0045 | 0.0098 | 0.0006 | 0.0070 | 0.0347 |
| N 2 | 0.0 | 0.1171 | 0.0038 | 0.0041 | 0.0 | 0.0015 | 0.0071 | 0.0087 | 0.0077 | 0.0047 | 0.0066 | 0.0085 | 0.0040 | 0.0039 |
| C 1 | 0.8238 | 0.7906 | 0.830 | 0.8616 | 0.9522 | 0.8657 | 0.7085 | 0.6404 | 0.5980 | 0.6073 | 0.6810 | 0.6702 | 0.6568 | 0.8019 |
| C 2 | 0.0428 | 0.0162 | 0.0376 | 0.0355 | 0.0168 | 0.0383 | 0.0853 | 0.1057 | 0.1415 | 0.1383 | 0.0700 | 0.1174 | 0.1217 | 0.0628 |
| C 3 | 0.0351 | 0.0035 | 0.0144 | 0.0154 | 0.0091 | 0.0197 | 0.0495 | 0.0575 | 0.0689 | 0.0633 | 0.0505 | 0.0579 | 0.0547 | 0.0275 |
| iC 4 | 0.0161 | 0.0008 | 0.0089 | 0.0046 | 0.0026 | 0.0049 | 0.0075 | 0.0135 | 0.0140 | 0.0130 | 0.0179 | 0.0096 | 0.0119 | 0.0043 |
| nC 4 | 0.0303 | 0.0010 | 0.0 | 0.0046 | 0.0033 | 0.0072 | 0.0126 | 0.0237 | 0.0252 | 0.0238 | 0.0198 | 0.0237 | 0.0226 | 0.0088 |
| iC 5 | 0.0060 | 0.0004 | 0.0463 | 0.0026 | 0.0016 | 0.0034 | 0.0041 | 0.0106 | 0.0102 | 0.0100 | 0.0162 | 0.0078 | 0.0088 | 0.0031 |
| nC 5 | 0.0068 | 0.0004 | 0.0 | 0.0020 | 0.0011 | 0.0040 | 0.0040 | 0.0098 | 0.0119 | 0.0109 | 0.0108 | 0.0101 | 0.0118 | 0.0035 |
| C 6 | 0.0099 | 0.0006 | 0.0308 | 0.0035 | 0.0025 | 0.0057 | 0.0046 | 0.0101 | 0.0175 | 0.0165 | 0.0177 | 0.0133 | 0.0151 | 0.0053 |
| C + 7 | 0.0292 | 0.0039 | 0.0263 | 0.0564 | 0.0098 | 0.0478 | 0.0304 | 0.1118 | 0.0956 | 0.1076 | 0.0997 | 0.0809 | 0.0781 | 0.0442 |
| MWC + 7 | 125 | 161.9 | 106 | 253 | 122.6 | 200 | 155.3 | 186 | 163 | 162 | 162 | 148 | 154 | 171 |
| γC 7+ | 0.74 | 0.80 | 0.733 | 0.850 | 0.723 | 0.82 | 0.8311 | 0.807 | 0.791 | 0.789 | 0.807 | 0.787 | 0.777 | 0.813 |
| T (oF) f | 40 | 337 | 60 | 271 | 220 | 224 | 246 | 251 | 290 | 290 | 256 | 150 | 319 | 300 |
| Exp. DPP | 3095 | 3337 | 2651 | 11830 | 3345 | 8750 | 5780 | 5229 | 4203 | 4173 | 5219 | 4172 | 4160 | 7871 |
| Calculated DPP (Psia) | ||||||||||||||
| This Study | 31255 | 3915 | 2467 | 11829 | 3515 | 8750 | 5159 | 5821 | 4228 | 4393 | 5099 | 4329 | 3939 | 6317 |
| Elshar- kawy | 3214 | 6542 | 2655 | 12080 | 3345 | 8934 | 5808 | 5348 | 4270 | 4170 | 5179 | 4172 | 4139 | 6733 |
| Organick & Golding | 2650 | 2750 | 2620 | 7800 | 3850 | 7055 | 3468 | 4270 | 3674 | 3740 | 4054 | 3808 | 3520 | 4800 |
| Nemeth & Kennedy | 2823 | 4144 | 2792 | 5545 | 2507 | 9136 | 5492 | 5062 | 4054 | 3983 | 4932 | 4061 | 4063 | 7178 |
Table 2: Estimated DPPs by different correlations compared to Experimental DPP Values.
Statistical Error Analysis
The accuracy of the correlation was statistically analyzed and compared with the three other correlations in popular industry use, being Nemeth and Kennedy’s, Organick and Golding’s and Elsharkawy’s. The error analysis criteria adopted in this study are the average relative deviation error (ARD), average absolute deviation error (AAD), standard deviation (SD), absolute maximum relative error ( ( ) i max E ), root mean square error (RMSE) and correlation coefficient.
The formulae for these statistical methods are contained in Appendix II and the results of the error analyses are shown in Table 3 below. The new correlation, given in Equation (3), gave best estimates of dew point pressure of retrograde gas condensates with significantly reduced errors when compared to the other correlations. The model presented in this study gave the highest correlation coefficient of 99.59%. This implies that more than 99 percent of the data variation in the dew point pressure analyzed can be explained by the model.
| This Study | Elsharkawy | Organick & Golding | Nemeth & Kennedy | |
|---|---|---|---|---|
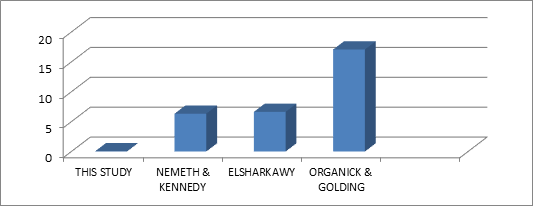
| ARD (%) | -0.05 | 6.63 | -17.02 | -6.33 |
| AAD (%) | 0.05 | 6.63 | 17.02 | 6.33 |
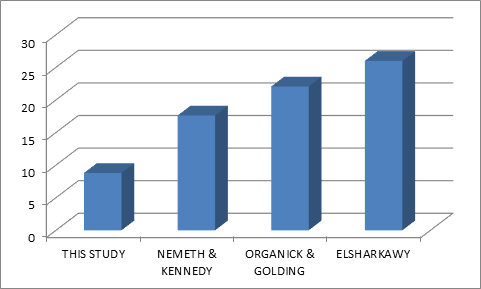
| RMSE (%) | 8.80 | 26.00 | 22.07 | 17.62 |
| E i (max) | 0.20 | 0.96 | 0.39 | 0.53 |
| Correlation Coefficient, R2 (%) | 99.59 | 98.81 | 92.35 | 93.86 |
Table 3: Accuracy of the Various Methods for predicting DPP for gas condensate samples.
Figure 2 below, represents the average absolute relative error was less than one-tenth of a percent with a value of -0.052% and the relative mean square error (RMSE) was 8.80%. The error distribution of this new correlation is presented in Figure 3 as Average Absolute Relative Error versus data frequency. It indicates that approximately 65% of the predicted dew point pressures fall within 5% average absolute error, and about 95% of the data points are within 10% error. The model’s accuracy for all the data points used to develop this correlation is 15%.
Conclusion
- A simple model based on a large data bank that is comprised of a wide range of pressures, temperatures, and various gas condensate compositions, has been developed. The new model has the following features:
- The new model is simple having only eight correlation constants all of which are integers.
- The results of the use of the new model gave better agreement between estimated dew point pressure values and the experimentally measured ones found in literature.
- When compared to three other industry-popular correlations for use in estimating DPP of gas condensate reservoirs, the new model gave best performance with lowest errors and highest correlation coefficient.
- The effect of temperature on DPP is minimal when compared to effects of gas composition and heptane plus properties.
- The effect of intermediate hydrocarbon composition,, on DPP is negligible.
- The molecular weight and specific gravity of heptane plus fraction, as well as mole fraction of methane, have profound influence on DPP.
- The new model can be used with greater confidence to predict the dew point pressure for retrograde gas condensate reservoirs when measured values are unavailable. References
1. Olds RH, Sage BH, Lacy WN (1943) Phase Equilibrium in Hydrocarbon System, Composition of Dew Point. Trans AIME 160: 77-99.
2. Olds RH, Sage BH, Lacy WN (1949) Volumetric Phase Behavior of Oil and Gas from Several San Joaquin Valley Field. Trans AIME 179: 287-302.
3. Organic EI, BH Golding (1952) Prediction of saturation pressure for Consdensate-gas and Volatile oil mixtures. J Pet Technol 4(5): 135-148.
4. Nemeth LK, Kennedy HT (1967) A Correlation of Dew point Pressure with Fluid Composition and Temperature. SPE Journal 7(2): 99-104.
5. Elsharkawy AM (2001) Characterization of the Plus Fraction and Prediction of the Dew point Pressure for Gas Condensate Reservoirs. SPE Western Regional Meeting, 26–30 March, Bakersfield, California.
6. Elsharkawy M (2002) Predicting the Dew Point Pressure for Gas Condensate Reservoirs: Empirical Models and Equations of State. Fluid Phase Equilibria 193(1–2): 147-165.
7. Reamer HH, Sage BH (1950) Phase Behavior of Hydrocarbon System. AIME 189: 261-268.
8. Kurata K, Katz DL (1942) Critical Properties of Volatile Hydrocarbons Mixtures. Trans AIChE 38: 99-1021.
- Nigeria’s Vulnerability in the Face of Global Energy Policy
- A Simulation Study of Investigation of Optimum Oil Production Performance by Applying Various Gas Injection Methods in Oil Reservoir
- Characterization of Permo-Triassic Reservoirs through Thermal Maturity Assessment of Westphalian Source Rocks in the Cheshire Basin
- Influence of Microwax on the Rheological and Thermal Behaviour of a Wax Crude Oil
- Real-Time Monitoring and Performance Optimization of Steam Injection in Heavy Oil Reservoirs Using Fiber Optic Sensing and Integrated Predictive Simulation Models
- Rapid On-Site Determination of the Total Petroleum Hydrocarbon Content of Soils by Handheld Fourier Transform Near-Infrared Spectroscopy: Development of a Global, Site- and Scanner- Independent Calibration Model