Extraction and Characterization of Type 1 Collagen from Heterotis niloticus and Lates niloticus Skin and Scales
Collagen is the principal segment of the extracellular grid that constitutes roughly 30% of the aggregate protein in vertebrates. It can be generally utilized as part of sustenance, medication, beauty care products and biomedical materials. There is developing enthusiasm for the procedures used to extricate collagen and its subsidiaries, because of the growing inclination to utilize this protein. A set up of manufactured operators of different modern procedures have been put in place. The aim of this study was to extract and characterize collagens from wastes (skin and scale) of two (2) selected Nigerian freshwater fish species (Heterotis niloticus and Lates niloticus) using either pepsin or acid soluble extraction. Proximate analysis of the waste (skin and scales) of both fishes were conducted, collagen was extracted using 0.5M acetic acid and pepsin. The collagen yield was determined and characterized by Sodium Dodecyl Sulfate Polyacrylamide Gel Electrophoresis (SDS PAGE), amino acid profile and Fourier Transform-Infra Red Spectrum (FTIR). Proximate composition of the samples revealed that at p
Introduction
About 30% of all proteins in vertebrates are collagen, which is the fundamental component of the extracellular grid [1]. It is typically distributed throughout vertebrates’ diverse connective tissues to support and guarantee the protection of the body and its organs [2]. Furthermore, collagen is a biological natural asset that can be widely used in food, cosmetics, pharmaceuticals, and biomedical materials due to its emulsification, gel quality, low viscosity, biological compatibility, water ingestion, and saturating impact.
Collagen is a very functional biomaterial because it has an extensive variety of industrial usage [3].
Because of its characteristics like high level of the content of protein as well as properties that are functional, like capacity of absorption of water, the ability to stabilize as well as form emulsions and gel formation; gelatin and collagen are of great demand within the food industry. In the biomedical as well as pharmaceutical fields, it serves as a vehicle for proteins, genes and drugs, it is also be used as an alternative for the skin of humans, ligaments and blood vessels [4, 5]. A lot of researches have been carried out to examine collagen so as to collect compounds that are bioactive that contain anti-hypertensive, antioxidant, and antimicrobial properties [6].
Collagen can be isolated from different species of animal; it is usually gotten from by-products of slaughter animals. Collagen is mainly gotten from skins, tendons, cartilage and bones. The risks of diseases like bovine spongiform encephalopathy [7], the disapproval of pigs by Muslims and Jews, and the use of cow-based products by Hindus have all led to research into methods of extracting collagen from different animal sources, such as fish and birds [8].
Therefore, skin collagens have been extracted and characterised from a number of fish species, including Nile perch [9], carp [10], channel catfish [11], sheephead seabream [12], threadfin bream [13], bigeye snapper [14], black drum ( [12], brown stripe red snapper [15], carp [10], and yellowfin tuna [16].
Few research have been conducted on fish scales, such as those by Kimura, et al. [17], despite the fact that there are several publications on collagen from the skin of marine organisms.
As a result, a lot of focus has been placed on alternate collagen sources, particularly fish skin and bone, which are byproducts of fish processing facilities. The skin of fish has been used to extract fish collagens [18, 19]. Offal from fish, including the scales, fins, bones, and skin, has gained popularity as a substitute collagen source [20]. Skin, scales, fins, and other discarded parts of fish offal waste are excellent sources of collagen and can be used to make fish collagen. Nineteen collagen varieties, type I–XIX, are found in the skins, bones, cartilage, tendons, ligaments, blood vessels, teeth, cornea, and every other vertebrate organ.
In particular, all connective tissues, including the skin and bones, contain type I collagen. Since there is developing enthusiasm for the procedures used to extricate collagen and its subsidiaries, because of the growing inclination to utilize this protein, the current research work sought to make provision for another means of collagen extraction and characterization from the skin and scale of Heterotis niloticus and Lates niloticus fishes obtained from Minna, Niger State’s fish market.
Materials and Methods
Experimental Fish Materials
Fish waste scale as well as skin was collected separately from the indigenous fish commercial market in Minna, Niger state, washed and used immediately.
Proximate Study
Moisture Content Determination: Twin (2) grams of every one of the examples was weighed in a crucible pot and warmed at 105°C, until the point when a consistent weight was achieved. The amount of moisture for each sample was determined in percentage using original weight of the sample [21].
% Moisture = $\frac{M_2 M_3}{M_2 - M_1} \times 100$
Where:
$M_1 =$ starting weight of crucible pot
$M_2 =$ weight of crucible pot + sample before it is dry
$M_3 =$ last weight of cauldron + test in the wake of drying
Crude Protein Determination: Two (2) grams of the example were weighed alongside $20\text{cm}^3$ of refined water into a small scale Kjeldahl processing jar. It was shake and allowed left to remain for 15 minutes. A tablet of Selenium catalyst was included then concentrated $\text{H}_2\text{SO}_4$ ($20\text{cm}^3$). In the digestion square, the jar was heated for 4 hours at $100^{\circ}\text{C}$ to the point that the process turned out to be clear. The jar was taken away from the square and left to cool. The substance was moved into $50\text{cm}^3$ volumetric jar and water added until it got to the mark.
Part of the process ($10\text{cm}^3$) was moved into another small scale Kjeldahl jar and put in the distilling outlet of the small scale Kjeldahl distillation part. $5\text{cm}^3$ of boric acid was put into a conical jar as an indicator; it was then placed under the outlet of the condenser. A solution of NaOH ($10\text{cm}^3$, $40\%$) was put into the substance in the Kjeldahl jar by opening the channel stopcock. Distillation starts and the supplied heat were controlled to prevent going back. Once the distillate available was collected completely by Boric acid of $5\text{cm}^3$, the process was ended. Titration using $0.01\text{M}$ of $\text{H}_2\text{SO}_4$ was used to determine the quantity of nitrogen in the distillate; color changes from green to pink once the end point is reached. Nitrogen percentage was determined and was multiplied by 6.25 to get the value of the crude protein [21].
$$\% \text{Nitrogen} = \frac{(\text{Ss-Sb}) \times \text{Aacid} \times 0.01401}{\text{M}} \times 100$$
Where:
$Ss =$ Sample titer value
$Sb =$ Volume of acid required to titrate
$Aacid =$ Acid normality
$M =$ Sample weight in grams
Crude Lipid Determination: This carried out using the Soxhlet extraction technique. 10 grams every one of the examples was measured, it was then wrapped with filter paper and put in a thimble. Cotton wool was used to cover the thimble, it was the kept in the column meant for extraction which was connected to a condenser. The lipid was extracted using $200\text{ml}$ of n- Hexane [21].
$$\% \text{Fat} = \frac{M_2 - M_3}{\text{Weight of test}} \times 100$$
Where:
Crude Fiber Determination: AOAC [21] method was used to determine the quantity of crude fiber. 5 grams of every one of the samples was weighed, for 30 minutes, $200\text{ml}$ of $\text{H}_2\text{SO}_4$ ($1.25\%$) was heated and a Buchner funnel was used to filter. Distilled water was used to wash the residue till it was free from acid. For 30 minutes, the residue was boiled using $200\text{ml}$ of NaOH ($1.25\%$); it was then filtered and washed severally using distilled water till it was free from alkaline. $10\%$ HCl was used to rinse it once and ethanol was used twice. Lastly, petroleum ether was used to rinse thrice. The remaining residue was gathered into a crucible pot and was dried overnight at $105^{\circ}\text{C}$. It was cooled in desiccators and the burnt in a furnace (muffle) for 90 minutes at $550^{\circ}\text{C}$, so as to get the weight of the ash.
$$\% \text{fiber content} = \text{Loss in weight after cremation} \times 100$$
Ash Content Determination: AOAC [21] method was used to determine the ash content. The percentage of the inorganic residue that stays after the organic matter has been burnt off. 2 grams of every one of the samples was put into a crucible pot and burnt in a furnace (muffle) for 6 hours at $550^{\circ}\text{C}$. Desiccator was used to cool the sample and then it was weighed at room temperature so as to obtain ash weight. The formula used was:
$$\% \text{Ash content} = \frac{\text{Weight of ash}}{\text{Weight of original food}} \times 100$$
Carbohydrate Content Determination: The sum of percentage compositions from protein, moisture, lipid, ash and fiber contents was calculated and subtracted from 100. The value gotten was known as the carbohydrate content [22].
$$\% \text{Carbohydrate} = \left( \% \text{Fiber} + \% \text{Moisture} + \% \text{Protein} + \% \text{Ash} \right) - 100$$
Extraction of Collagen
Pretreatment: The fish species’ collected wastes (scales and skin) were cleaned with water before being cut into little pieces with scissors. Each fish species’ small skin fragments were immersed in 0.1M (1:10 w/v) NaOH for three days, and the scales were immersed in the same solution for five days. The samples were stored at refrigerator temperature ($4-6^{\circ}\text{C}$), and the solution was changed every 24 hours. This was done in order to increase the surface area of the non-collagenous proteins and remove them from the sample. Following the third day, distilled water was used to cleanse the skin until the pH was neutral or slightly alkaline (between 7.2 and 7.3).
To defatten the samples, deproteinised skin was submerged in 10% Butanol (1:10 w/v) for two days, with a daily solution change. In 0.5M ethylenediaminetetraacetic acid (EDTA) (1:10 w/v), which was changed once day, deproteinised scales were decalcified. A neutral or slightly alkaline pH (between 7 and 7.2) was achieved by carefully washing the extract with distilled water.
Extraction of Acid Soluble Collagen (ASC): With minor adjustments, ASC was eliminated using Li ZR, et al. [23] methodology. Every operation was carried out at 4°C while being constantly stirred. Samples that had been defatted and decalcified were both immersed in 0.5M (1:15 w/v) acetic acid for a whole day. A two-layer cheese cloth was used to filter the mixture, and after a day, the residue was again extracted using the same solvent. After filtering, the extracts were mixed together. Cold acetone was used to precipitate the extract. 5:1 v/v of cold acetone was added. After an hour of incubation, it was spun for ten minutes at 4°C at 14,000 rpm. The particle, known as Acid Soluble Collagen (ASC), was frozen after the supernatant was decanted.
Extraction of Pepsin Soluble Collagen (PSC): According to Singh, et al. the residue obtained from each ASC extraction was employed, with minor modifications, in the extraction of PSC. Pepsin (20 U/g residues) was added, and each residue was submerged in 0.5 M acetic acid (1:15 w/v). After 48 hours of constant stirring at 4°C, the liquid was filtered through a double-layered cheesecloth. The filtrate was precipitated using cold acetone in the same manner as for ASC. The dialysate, known as Pepsin Soluble Collagen (PSC), was frozen to dry it out.
Determination of Collagen Yield: Yield of collagen (dry weight) from the skin was determined using the formula below:
$$\% \text{Yeild} = \frac{(\text{Weight of separated collagen in grams})}{(\text{Weight of test after pretreatment in grams})} \times 100$$
Determinations of Protein and Ash Substance of the Extracted Collagens: The ash content was defined as the percentage of inorganic residue obtained after the organic matter (collagens) had been burned off. The protein content of the collagens was ascertained using the small-scale Kjeldahl distillation technique [21].
Characterization of the Extracted Collagens
Amino Acid Composition of the Extracted Collagens: The amino acids content of the extracted collagen was carried out by the use of Amino Acid Analyser High Performance Liquid Chromatography at the Institute of Agricultural Research and Technology in Ibadan, Oyo State (Model: Waters 501 Millipore Corporation, USA). The freeze-dried collagen was extracted in an inert environment at 105°C for 24 hours using 6M HCl, and then hydrolysed with 1% phenol (v/v). The hydrolyzate was vacuum-dried at 60°C until brittle sheets were discovered. To finish the derivatisation, the AccQ-Fluor Reagent pack was used. The collagen tests were hydrolysed for 24 hours at 115°C with reduced pressure in 4.0 mol/L methane sulphonic acid with 2 mL/L 3-2(2-aminoethyl) indole. 3.5 mol/L of NaOH was used to deactivate the hydrolysates, and 0.2 mol/L of citrate buffer (pH 2.2) was used to dilute them. The hydrolysed tests were then subjected to the procedure to determine the amount of free amino acid.
Fourier Transform-Infra Red Spectrum Analysis (FTIR): Fourier transform infrared (FTIR) spectroscopy (Biored FT-IR 40 display, USA) was used to evaluate the functional groups of collagen samples of fish species that were frozen (ASC and PSC) as described by Muyonga JH, et al. [24] at an Institute of Agricultural Research and Technology, Ibadan, Oyo state. In order to read the spectrum encouraged by the usage of KBr for pelleted types of samples, 10 milligrammes of each sample were mixed with 100 milligrammes of KBr and fastened into a salt disc that was 10 mm wide. Effective picks were obtained by recording the range of ASC and PSC and comparing them to that of regular collagen.
Sodium Dodecyl Sulfate-Polyacrylamide Gel Electrophoresis (Sds-Page): The method of Li ZR, et al. [23] was used to perform an electrophoretic example of the collagen tests. A five-times sample buffer (0.5M Tris-HCl containing 4% (w/v) SDS, pH 6.8, 10% (v/v) β-mercaptoethanol, and 20% (v/v) glycerol) was combined with each collagen sample in 0.1M acetic acid. The samples were heated to between 93°C and 95°C for four minutes prior to loading onto a 7.5% gel. Using a Compact-PAGE device, the gel was electrified with a steady current of 70V/gel. The proteins were viewed using Coomassie blue (R-250). To estimate the molecular size of proteins, high-weight molecular markers (212 kDa to 66.4 kDa) were used. As benchmarks, collagen types I, II, III, and V were employed.
Statistical Analysis: A statistical program called SPSS version 21 was used to statistically analyse the collected data. Analysis of variance, or ANOVA, was used for comparisons (P<0.05). The t-Test was used to distinguish the means differences.
Results and Discussion
Proximate Composition of the Fish Wastes
Table 1 displays the measured proximate content of the skin and scale of *Lates niloticus* and *Heterotis niloticus*. When
compared to the skin samples of Lates niloticus (2.31±0.12%) and Heterotis niloticus (3.03±0.35%), the ash content was significantly higher (P<0.05) in the scales of Lates niloticus (28.68±2.34%) and Heterotis niloticus (24.80±3.45%). Similarly, compared to the skin samples of Lates niloticus (2.31±0.12%) and Heterotis niloticus (3.03±0.35%), the fibre content was substantially (P<0.5) greater in the scales of Lates niloticus (0.45±0.02%) and Heterotis niloticus (0.25±0.01%). In contrast, the skin of Lates niloticus (30.44±3.43%) and Heterotis niloticus (44.47±4.32%) had a considerably greater protein content (P<0.5) than the identical samples of Lates niloticus (22.39±1.23%) and Heterotis niloticus (18.44±0.34%). Furthermore, the fat contents of Lates niloticus’s skin (14.91±1.34%) and Heterotis niloticus’ skin (8.66±1.03%) were significantly higher (P<0.5) than those of the same samples (0.81±0.19%) and Lates niloticus (5.77±0.56%) (Table 1).
| Sample identification | % Moisture | % Ash Content | % Crude Protein | % Crude Fibre | % Oil Extract | % NFE (CHO) |
|---|---|---|---|---|---|---|
| Heterotis niloticus (skin) | 36.82±3.44 b | 3.03±0.35 a | 44.47±4.32c | 0.25±0.01 a | 8.66±1.03 c | 6.77±0.34 a |
| Lates niloticus (skin) | 40.42±2.39 b | 2.31±0.12 a | 30.44±3.43b | 0.45±0.02 ab | 14.91±1.34d | 11.47±0.43 ab |
| Heterotis niloticus (scale) | 46.50±5.66 b | 24.80±3.45 b | 18.44±0.34a | 0.90±0.01 b | 0.81±0.19 a | 8.55±0.21 a |
| Lates niloticus (scale) | 24.90±3.45a | 28.68±2.34 b | 22.39±1.23a | 2.70±0.47 c | 5.77±0.56 b | 15.56±0.45 b |
Table 1: Proximate Compositions of Scale and Skin of Lates niloticus and Heterotis niloticus.
*Data are Mean ± SEM of triplicate determination. Columns with different superscript are significantly (p<0.05). Table 1: Proximate Compositions of Scale and Skin of Lates niloticus and Heterotis niloticus.
Due to their high protein content (18.44%-44.47%), Lates niloticus and Heterotis niloticus scale and skin proximate studies indicated their potential for application as a protein substrate for collagen extraction. The highest amount of collagen that can be anticipated from the collagenous material is determined by its protein concentration [24]. However, compared to their scale samples, Lates niloticus (22.39%) and Heterotis niloticus (18.44%), the protein levels in their skins were significantly greater (30.44%) and (44.47%), respectively. The high total protein output in the skins may be due to the fact that, as Figure 1 and earlier studies have shown, skin contains more protein than the scale [25]. Consequently, it is anticipated that the skin of Heterotis niloticus and Lates niloticus will produce more collagen than the scale.
Likewise, fish skin accumulates more subcutaneous fat than scale, which may explain the greater fat concentrations in the skin of Lates niloticus and Heterotis niloticus compared to the scale samples (Table 1). The presence of calcium- lacking hydroxyappatite (Ca5 (PO4)3OH) in the scale’s lower fibrillar plate and higher osseous layer may be the cause of the scales’ high amount of flaming debris (24.80±3.45%– 28.68±2.34%) [26]. However, due to the high levels of fat and ash, the samples must be pretreated in order to properly defatten and decalcify them before extraction [26].
The results of Zhang Y, et al. [27], who found a significant amount of collagen in fish bones and scales, further supported the availability of collagen in the scale, which was previously believed to be waste.
Nagai T, et al. [28] also documented collagen from waste sources, such as fish processing leftovers, and revealed that collagen type I could be isolated from fish skin, bones, and fins. It was determined that the skin had higher protein content than the scales, which had moderately low protein content. This result is consistent with Iqbal’s Z [29] findings. The inherent potential of each fish species may be the cause of the variations in proximal examination of the sampled fish species. According to Nalinanon S, et al. [14], fish protein content depends on both genetic potential and fishing time. When there is a shortage of food, albumin and globulin break down, increasing the amount of collagen in the skin. It’s possible that variations in fish species and protein extraction techniques led to discrepancies in the outcomes.
Percentage Yield of Collagen Extracted
Table 2 shows the scale of Heterotis niloticus and Lates niloticus as well as the yield of collagen that was isolated from the skin. While Heterotis niloticus produced collagen with a yield ranging from 3.78% to 33.97%, Lates niloticus produced collagen with a yield ranging from 1.76% to 27.85%. In comparison to PSC, which yielded collagen at a rate of 1.76±0.13% to 8.74±0.34%, the maximum collagen output from ASC exceeded 6.11±0.65% to 33.97±1.78%. In a similar vein, the collagen yield in skin from the two extraction methods varied significantly (p<0.05) from the scale (1.76 %-8.05%) to 5.08±0.34% - 33.97±1.78%.
| Sample Identification | Yield Of Collagen Dry Basis (%) |
| ASC HS | 33.97±1.78 c |
| ASC LS | 27.85±1.02 c |
| ASC LSC | 6.11±0.65 ab |
| ASCHSC | 8.05±0.95 b |
| PSC HS | 8.74±0.34 b |
| PSC HSC | 3.78±0.18 a |
| PSC LS | 5.08±0.34 ab |
| PSC LSC | 1.76±0.13a |
Table 2: Percentage Collagen Yield from Scales and Skin of _Heterotis niloticus_ and _Lates niloticus_ Fishes Extracted By Pep
*Data are Mean ± SEM of triplicate determination. Columns with different superscript are significantly (p<0.05). PSC: Pepsin Soluble Collagen; ASC: Acid Soluble Collagen; HS: Heterotis niloticus Skin; HSC: Scale of Heterotis niloticus; LS: Lates niloticus Skin; LSC: Lates niloticus scale. Table 2: Percentage Collagen Yield from Scales and Skin of Heterotis niloticus and Lates niloticus Fishes Extracted By Pepsin and Acid Methods.
Collagen was extracted using pepsin and acetic acid, and the yield was reported on a dry weight basis. The yield of collagen typically varies depending on the extraction technique. On the scales, the PSC and ASC were 6.11% and 1.76% for Lates niloticus and 8.05% and 3.78% for Heterotis niloticus, respectively; on the skin, they were 27.85% and 5.08% for Lates niloticus and 33.97% and 8.74% for Heterotis niloticus. The high production of ASC was caused by 0.5M acetic acid nearly completely dissolving the skin of both species. These results did not match those of Jongjaeonrak A, et al. [15], who found that big eye snapper skins partially dissolved in 0.5M acetic acid.
Collagen derived from aquatic organisms has been employed in the culinary, cosmetic, and medical industries, and there has been a vigorous effort in recent years to extract it for industrial use. The following factors have been used to account for the yields of collagens from marine organisms: the purple sea urchin test (35.0%); the outer skin of the paper nautilus (50.0%) [30]; the skin of the fish (Japanese sea bass, 51.4%, chub mackerel, 49.8%, bullhead shark, 50.1%, and ocellate puffer fish, 44.7%) [28]; the edible jellyfish exumbrella (46.4%) [29]; the unesu [31], the fish bone (Japanese sea bass, 40.7%, horse mackerel, 43.5%, and ayu, 53.6%; the Callistoctopus arakawai arm (62.9%) [32]; the rhizostomous jellyfish mesogloea (35.2%); and the cuttlefish outer skin (35.0%) [33]. Recent studies have reported the following collagen yields from fish skin: deep- sea redfish acid-solubilized (47.5%) and pepsin-solubilized collagens (92.2%) [19], channel catfish acid-soluble (25.8%) and pepsin-soluble collagens (38.4%) [11], and grass carp pepsin-soluble collagen (46.6%) [27].
However, the yield was just 0.8% on a dry weight basis, and only a little amount of the acid-soluble collagen from the surf smelt’s bones was removed.
The low yield in PSC may be caused by cross-links created when aldehyde reacts with hydroxylysine and lysine at the helical locations of the telopeptide [34]. The telopeptide region’s cross-linked molecules were probably broken down, and additional restricted acid digestion increased the effectiveness of collagen extraction [13]. Compared to pepsin extraction, acid extraction yielded a larger amount of collagen from snakehead fish scale [35]. On a wet weight basis, the brown banded bamboo shark, Chiloscyllium punctatum, produced 9.38% ASC and 8.86% PSC [36]. Through additional restricted pepsin digestion, the cross-linked molecules in the telopeptide region were broken down, leading to more extraction.
According to Nalinanon S, et al. [24], pepsin was able to precisely cleave the telopeptide region of collagen found in bigeye snapper skin. The collagen yield in this study was higher than collagen yield from silky fowl feet (7.31 %, dry basis) [37], and bird feet collagen (16.79%, dry basis) using papain enzyme [38].
Low yield of collagen from the scales could be as a result of high amount of cross-links at the telopeptide region as well as other intermolecular cross-links, which could leads to low solubility in acid [39].
Amino Acid Profile of the Extracted Collagen
Table 3 shows the size of Heterotis niloticus and Lates niloticus as well as the amino acid collagen profile that was taken from the skin. Collagen that is acid soluble and extracted from the Heterotis niloticus scale had the highest (p<0.05) amino-acid content (74.95±2.84%), followed by collagen that was separated by pepsin from the Lates niloticus scale (57.09±2.65%), Lates niloticus scale (51.37±3.45%), Heterotis niloticus scale (38.45±1.89%), and Heterotis niloticus scale (37.85±2.89%). Collagen that was separated by acid from the Heterotis niloticus and Lates niloticus scales had the lowest amino acid contents (31.60±0.52% and 29.48±1.03%, respectively).
The physical characteristics of collagen are significantly influenced by the amino acid content. Glycine is the most prevalent amino acid in collagen, according to Balti R, et al. [40]. It is known that all members of the collagen family contain Glycine with repeating proline-rich tripeptides (Gly- X-Y), which are utilised to form the triple helix, where X is Pro and Y is primarily Hyp. Compared to collagen derived from fish, collagen derived from mammals contains more serine and threonine and less proline and hydroxyproline;
methionine is also present in greater amounts [41]. The results of a study using human collagens on fish and squid skin were comparable [42]. Thus, glycine was the primary amino acid in the collagen that was recovered from the scale and skin of Lates niloticus and Heterotis niloticus. It was also high in threonine (2.42% - 6.32%) and histidine (0.89% - 4.11%). Glycine is the most significant amino acid in collagen that was isolated from carp, according to a 2009 study by Duan et al. The current study’s findings corroborate those of Zhang Y, et al. [27] and Kui SK, et al. [43], who confirmed that glycine is the most crucial amino acid in all forms of collagen. According to a study by Wang L, et al. [7], collagen taken from calf skin has a very low level of His (8.2 residues/1000 residues). But compared to the pepsin digestion method from chicken feet (16–19%), the glycine content reported in this study (20.15%–30.30%) was higher [26].
| Amino acid % | ASC HS | ASC HSC | PSC HSC | PSC LS | ASC LS | PSC HS | PSC LSC |
|---|---|---|---|---|---|---|---|
| Tryptophane | 0.16 ±0.01ab | 0.25±0.01 b | 0.10±0.00 a | 0.52±0.10 a | 0.14±0.00 ab | 0.15±0.01 ab | 0.93±0.14a |
| Cystine | 0.88±0.10 a | 1.36±0.21 b | 0.57±0.03 a | 0.34±0.02 a | 0.73±0.02 a | 0.81±0.11 a | 0.73±0.21 a |
| Glutamine | 0.09±0.00 a | 0.47±0.02 b | 0.08±0.02 a | 3.06±0.52 c | 0.10±0.00 a | 0.10±0.00 a | 0.80±0.12 b |
| Proline | 0.30±0.01 b | 0.53±0.03 c | 0.20±0.00 b | 0.10±0.00 a | 0.21±0.01 b | 0.28±0.02 b | 0.31±0.00 b |
| Serine | 0.52±0.01 a | 1.15±0.20 b | 0.34±0.03 a | 0.67±0.02 a | 0.37±0.11 a | 0.42±0.02 a | 1.22±0.12 b |
| Glycine | 20.15±0.00 a | 30.30±0.10 b | 20.14±0.00 a | 30.60±0.13 c | 20.13±0.11 a | 20.16±0.00 a | 22.79±0.10 c |
| Asparagine | 0.27±0.01 a | 0.63±0.01 b | 0.25±0.01 a | 1.60±0.01 c | 0.19±0.00 a | 0.16±0.00 a | 0.51±0.01 b |
| Glutamic acid | 0.14±0.00 a | 0.51±0.02 a | 0.13±0.01 a | 0.61±0.01 b | 0.13±0.01 a | 0.11±0.01 a | 1.35±0.21 c |
| Aspartic acid | 1.00±0.00 a | 1.80±0.11 b | 0.91±0.15 a | 1.36±0.21 | 0.98±0.01 a | 0.86±0.01 a | 1.53±0.13 b |
| Histidine | 0.89±0.01 a | 2.67±0.43 b | 4.11±0.62 b | 0.87±0.11 a | 0.60±0.01 a | 3.83±0.52 b | 1.00±0.00 a |
| Alanine | 0.23±0.01 a | 0.71±0.02 b | 0.21±0.00 a | 3.06±0.33 c | 0.16±0.02 a | 0.18±0.01 a | 4.80±0.56 c |
| Valine | 0.57±0.01 a | 1.08±0.12 b | 0.53±0.14 a | 0.10±0.00 a | 0.64±0.02 a | 0.68±0.01 a | 0.30±0.02 a |
| Argine | 0.43±0.01 a | 3.02±0.52 c | 0.39±0.01 a | 3.49±0.55 c | 0.39±0.01 a | 0.25±0.00 a | 1.10±0.10 b |
| Phenylamine | 0.29±0.01 a | 0.44±0.01 a | 3.04±0.01 b | 0.16±0.01 a | 0.20±0.01 a | 2.89±0.02 a | 0.39±0.02 a |
| Tyrosine | 0.82±0.10 a | 6.40±0.16 c | 0.75±0.19 a | 2.03±0.21 b | 0.69±0.05 a | 0.98±0.02 a | 3.23±0.45 b |
| Lysine | 1.47±0.01 b | 2.61±0.04 c | 0.84±0.05 a | 2.34±0.18 c | 1.05±0.14 b | 0.67±0.12 a | 2.09±0.29 c |
| Methionine | 0.12±0.01 a | 1.81±0.19 b | 0.07±0.01 a | 1.92±0.18 b | 0.09±0.01 a | 0.15±0.00 a | 1.05±0.12 b |
| Threonine | 2.42±0.10 a | 6.32±0.45 c | 4.71±0.32 b | 2.15±0.28 a | 2.08±0.16 a | 5.29±0.22 c | 3.83±0.22 a |
| Leucine | 0.51±0.14 a | 4.90±0.21 c | 0.29±0.01 a | 2.43±0.21 b | 0.39±0.01 a | 0.36±0.21 a | 2.16±0.21 b |
| Isoleucine | 0.33±0.10 a | 7.99±0.38 c | 0.19±0.02 a | 4.65±0.23 b | 0.21±0.15 a | 0.14±0.11 a | 1.22±0.145 b |
| Total Amino acids | 31.60±0.52 a | 74.95±2.84 d | 37.85±2.89 b | 57.09±2.65 c | 29.48±1.03 a | 38.45±1.89b | 51.37±3.45 c |
*Data are Mean ± SEM of triplicate determination. Columns with different superscript are significantly (p<0.05). PSC: Pepsin Soluble Collagen; ASC: Acid Soluble Collagen; HS: Heterotis niloticus Skin; HSC: Scale of Heterotis niloticus; LS: Lates niloticus Skin; LSC: Lates niloticus scale. Table 3: Amino Acid Profile of Collagen Isolated from the Skin and Scale of Heterotis niloticus and Lates niloticus by Pepsin and Acid Methods.
Since it influences the functional characteristics of collagen derived from protein preparations, amino acids play a crucial role in the amino acid contents of collagen [44]. In contrast to the imino acid amounts (9.62–10.75%) reported for chicken feet [26], the collagens’ imino acid (proline) contents (0.10%–0.31%) in this study are lower. The species, body part compositions, collagen sources, and living environments are all obviously responsible for the variations in amino acid concentrations [7, 45].
According to Jongjareonrak A, et al. [15] amino acids contribute to the integrity of collagen’s helix structure.
Pyrrolidine rings of proline assist to strengthen the triple helix by enforcing conformational restrictions on the polypeptide chain [46]. Because of this, the molecular characteristics of collagen from Lates niloticus and Heterotis niloticus may differ from those of other species because of variations in imino acid concentration and cross-linking.
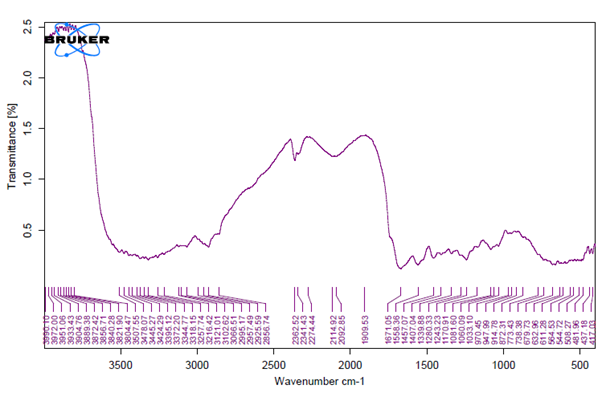
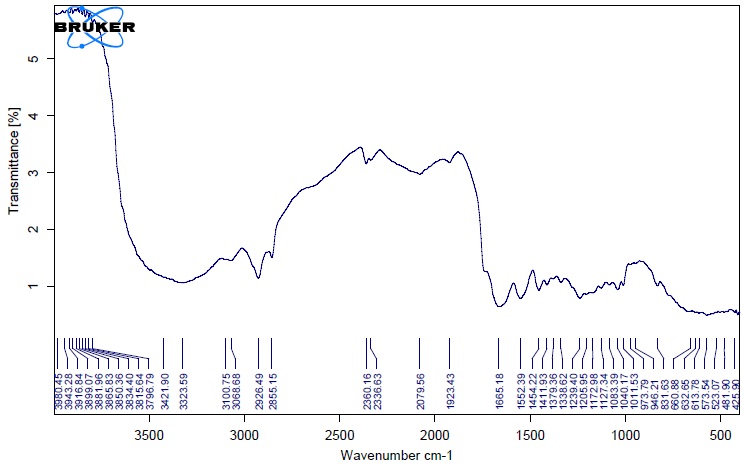
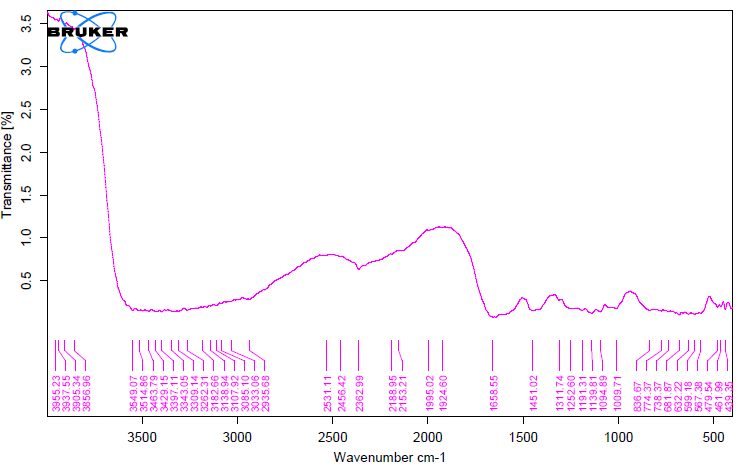
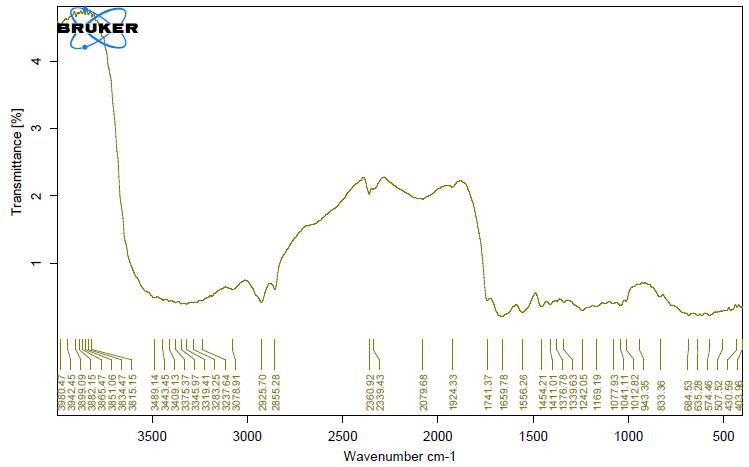
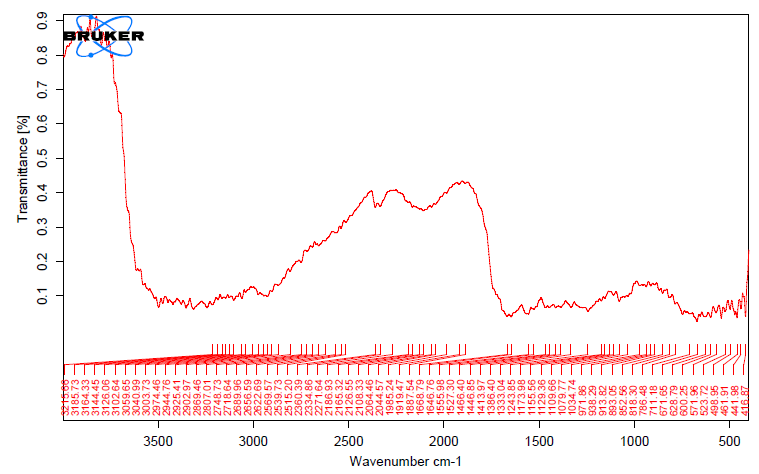
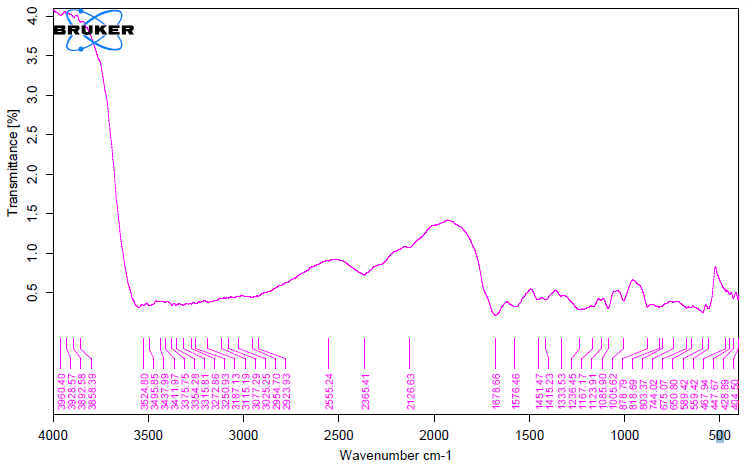
Fourier Transforms Infrared (FTIR) Spectroscopy
The unique highpoints of amides A, B, I, II, and III were revealed by FTIR spectra of collagen taken from the skin and scale of Heterotis niloticus and Lates niloticus, which are shown in Figures 1-7. Table 4.4 displays the peak regions of the isolated collagen’s major elongating FTIR frequencies. The absorption peaks of amide A are 3344.27 cm-1 for ASC HS and 3495.85 cm-1 for ASC HSC. Similarly, the absorption peak (amide II properties) is visible in ASC HS (1558.36cm-
1) and ASC HSC (1576.46cm-1). Peak ranges for amide B characteristics were observed in ASC LS (2974.46 cm-1) and PSC HS (2925.7 cm-1). Absorption peaks in the range typical of amide 1 are seen in ASC HS (1671.05cm-1), PSC HSC (1658.55cm-1), and ASC HSC (1678.65cm-1). ASC LS, PSC HSC, and ASC HSC all showed another peak that represented the carbohydrate moieties (1,100-1,005cm-1).
FTIR spectroscopy has been used to identify structural alterations in collagen. The characteristics of amide. N-H stretching vibrations, which occur in the range of 3400- 3440cm-1 wave numbers, are primarily responsible for absorption [47]. ASC of skin (3344.27 cm-1) and scale (3495.85 cm-1) of Heterotis niloticus are the only samples that exhibit the peaks typical of Amide A in the absorption peaks of the extracted collagen using acetic acid and pepsin. The position of the Amide A peak begins to shift to lower frequencies when an N-H group is connected with an H-bond in a peptide chain, according to Wang et al. This suggests that more NH groups in the skin of Heterotis niloticus were involved in hydrogen bonding than in size.
| Region | Assignment | Peak wavenumber range (/cm) | PSC LS | ASC LS | PSC LSC | ASC LSC | PSC HS | ASC HS | PSC HSC | ASC HSC |
|---|---|---|---|---|---|---|---|---|---|---|
| Amide A | NH stretch coupled with hydrogen bond | 3400 ~ 3440/cm | 3344.27 | 3495.85 | ||||||
| Amide B | CH2 asymmetrical stretch | 2900- 2926/cm | 297446 | 2925.7 | ||||||
| Amide I | C=O stretch/hydrogen bond coupled with COO- | 1600 ~ 1700/cm | 1671.05 | 1658.55 | 1678.65 | |||||
| Amide II | NH bend coupled with CN stretch | 1,480-1,350/cm | 1558.36 | 1576.46 | ||||||
| Amide III | NH bend coupled with CN stretch | 1,300-1,180 cm | 1243.23 | |||||||
| carbohydrate moieties | 1,100-1,005 cm | 1034.47 | 1009.71 | 1005.87 |
Table 4: Important Stretching FT-IR Frequencies of Isolated Collagen.
*PSC: Pepsin Soluble Collagen; ASC: Acid Soluble Collagen; HS: Heterotis niloticus Skin; HSC: Scale of Heterotis niloticus; LS: Lates niloticus Skin; LSC: Lates niloticus scale. Table 4: Important Stretching FT-IR Frequencies of Isolated Collagen.
The asymmetrical stretch of CH2 was represented by the Amide B peaks of collagen that were recovered from the skin and scale of Heterotis niloticus and Lates niloticus, which were discovered at 2974.46 cm-1 and 2925.7 cm-1. Collagens from Heterotis niloticus and Lates niloticus were found to have similar absorption peaks, indicating that they form a complex with hydrogen bonds between free N-H stretches that are joined to hydrogen in the polypeptide chain [9]. The amide I band, which has distinctive frequencies between 1600 and 1700 cm-1, was discovered to be a sensitive indicator of the secondary structure of peptides and was primarily linked to the stretching vibrations of the carbonyl groups (C=O bond) along the polypeptide backbone [48]. Only ASC HS, PSC HSC, and ASC HSC exhibited the collagen absorption peaks of Amide I in the range of 1658.55 cm-1 and 1678.65 cm-1. These findings suggested that during purifying procedures, the collagen that was isolated from Heterotis niloticus maintained its natural structure. In contrast to those of PSC (1658.55cm-1), the amide I peaks of ASC (1671.05cm-1 and 1678.65cm-1) were more often occurring. Since the shift of these peaks to higher frequencies was linked to an increase in molecular order, this suggested that ASC possessed a higher degree of molecular order than PSC. But according to Shanmugam V, et al. [25], the outer skin of Sepiella inermis has more amide I and II peaks (1655 and 1548 cm-1, respectively) from PSC than from ASC (1644 cm-1). The N-H deformation and C-N stretching vibrations are linked to the amide III band (1220–1320 cm-1). Furthermore, the absorption peaks were discovered at approximately 1,100- 1,005 cm-1. This was much in line with Muyonga JH, et al. [9] description of carbohydrate moieties (Figures 1-7).
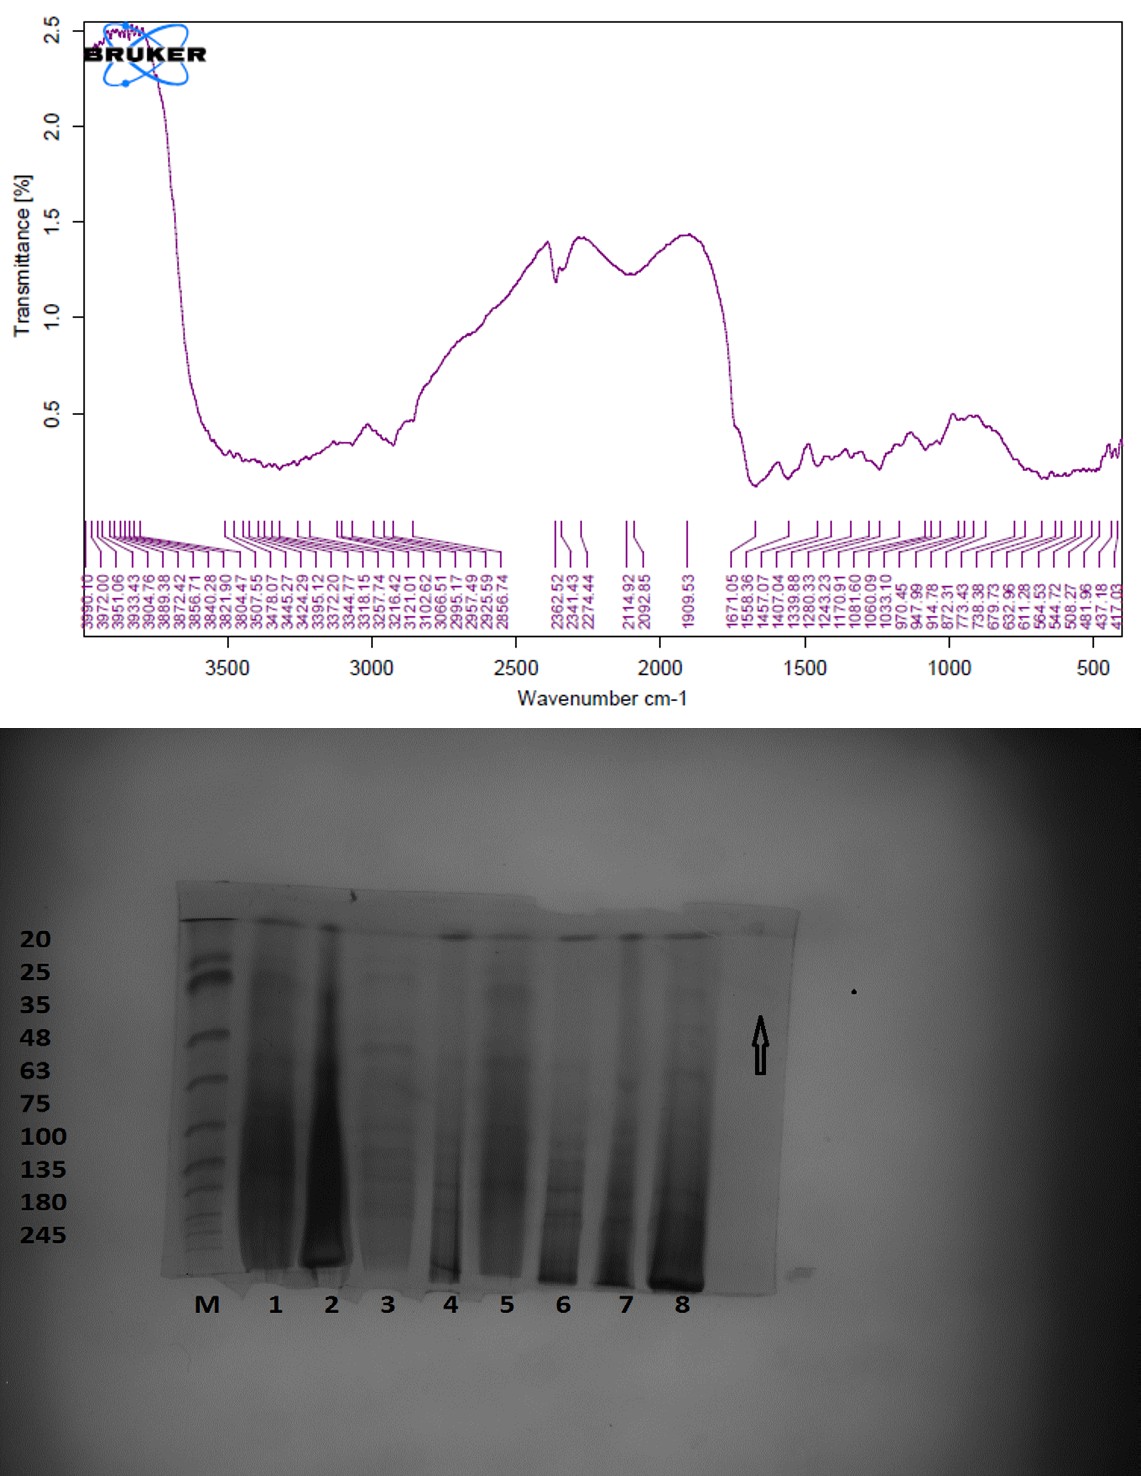
Molecular Weight of the Extracted Collagen
Plate I shows the SDS-PAGE gel profile of the band made from skin collagen of ASC and PSC as well as the scale of Heterotis niloticus and Lates niloticus angles. In the well (M), a marker with known molecular weights ranging from 20 to 245 kDa was run. Two groups in lane 1 that spoke to PSC LS with molecular weights of 25 and 63 kDa, respectively, were shown by the bands obtained using SDS-PAGE. Five bands with individual molecular weights of 25, 63, 75, 100, and 135 kDa were recorded by Lane 3, which stands for ASC HS.
Lane 4 represents the ASC HSC, which individually recorded three bands with molecular weights of 63, 135 and 180 kDa. Lane 5 represents PSC HS, which independently reported four bands with molecular weights of 25, 63, 100, and 135 kDa. Lane 6 represents PSC HSC, which recorded three bands with unique molecular weights of 100, 135 and 180 kDa. Lane 7 represents PSC LS, which recorded three bands with individual molecular weights of 63, 135 and 180 kDa. Lane 8 represents AS LS, which displayed three bands with individual molecular weights of 63, 135 and 180 kDa.
Plate I: The bands identified for ASC and PSC collagen from the scales and skin of Heterotis niloticus and Lates niloticus fishes’ SDS-PAGE gel profile.
In collagen hydrolysates, the smallest molecular mass that seemed to cause hypertensive action was between 900 and 1,900 Da. Specifically, the molecular weight distribution of 1,000 Da has been found to be decisive. The molecular weight distribution of collagen hydrolysates from fish skin ranged from 300 to 1,500 Da, with the majority of the peptides being 1,200 Da [49]. SDS-PAGE analysis of the skin and scale collagen profiles of the two fish species revealed no changes (Plate I). Collagens from the epidermis and scales of Heterotis niloticus and Lates niloticus showed comparable protein patterns for the same collagen, ASC or PSC. According to the findings, such collagens did not include any disulphide linkages. Since cysteine was not found in those collagens, the amino acid profile corroborated this once more (Table 4). These results were comparable to those published by Yung M, et al. [12, 50]. According to Kimura, et al. [17] and Muyonga JH, et al. [24], who stated that the collagen found in carp skin, scale, and bone was type I based on its electrophoretic mobility, the separated collagen might be type I. Consequently, the findings showed that a significant portion of the collagen found in the scales and skin of Heterotis niloticus and Lates niloticus fishes is type 1 collagen. However, these might suggest that the collagen contains certain contaminants, such as haemoglobin or an enzyme [26].
Denaturation Temperature of the Collagens
Figures 8 and 9 show the changes in fragmented consistency as a function of increasing temperature for ASC and PSC collagen that were extracted from the scale and skins of Lates niloticus and Heterotis niloticus. When heat was added, collagen from both PSC and ASC showed a rapid rise in viscosity. It was found that the thermal denaturation temperature (Figure 10) ranged between 18.64 and 35.50oC for PSC and between 20.50 and 30.00oC for ASC. The thermal denaturation temperature of the collagen recovered from Heterotis niloticus was greater (20.86–35.50oC) than that of the collagen isolated from Lates niloticus (18.64–25.50oC).
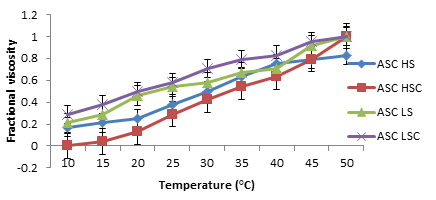
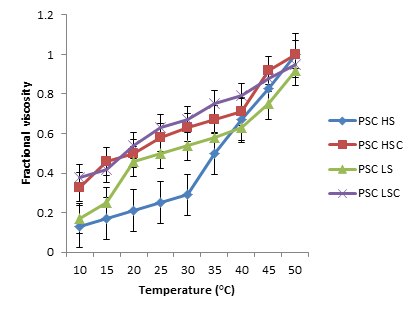
Figure 9: The Skin’s PSC Collagen Denaturation Curve and the Lates niloticus and Heterotis niloticus Scale are Displayed by the Temperature-Dependent Change in Fractional Viscosity. LS: Lates niloticus Skin; LSC: Lates niloticus Scale; HS: Heterotis niloticus Skin; HSC: Scale Of Heterotis niloticus; PSC: Pepsin Soluble Collagen; ASC: Acid Soluble Collagen.
The proportion of these amino acids is correlated with the temperature of the fish’s habitat, and collagen thermal stability influences the amount of these amino acids [51]. Compared to Lates niloticus, the collagen isolated from Heterotis niloticus has a slightly greater denaturation temperature.
The collagen extracted from Heterotis niloticus has a greater denaturation temperature, which indicates that it is more stable in a high-temperature environment [52]. Nonetheless, the study’s findings regarding the denaturation temperature of collagen derived from skin and scale of Heterotis niloticus and Lates niloticus were marginally lower than those of pork collagen (66.4°C) and calf skin collagen (67.84°C) as well as Nile tilapia fish (41.09°C) [53, 54, 55, 56, 57, 58, 59, 60, 61, 62, 63, 64]. This study’s lower denaturation temperature for collagen could be explained by its lower amino acid content when compared to the previously mentioned literature.
Conclusion
Using two distinct approaches, type I collagen was extracted from the scale and skin of Lates niloticus and Heterotis niloticus, and this was confirmed by a number of analytical methods. As an alternative to collagen derived from animal sources, the results indicate that collagen might be obtained effectively by managing the usage of Lates niloticus and Heterotis niloticus using the ASC and PSC technique. The study’s findings demonstrated the presence of helical collagen arrangements, leading to the conclusion that scale and skin, which are waste products from Lates niloticus and Heterotis niloticus, may serve as an additional, unconventional source of collagen for the pharmaceutical and other industries.
References
-
Voet D, Voet J, Pratt CFDB (2006) Fundamentals of Biochemistry. In: 3rd (Edn.), Porto Alegre: Armed.
-
Song W, Wei C, Ya’nan Y, Caiyan L, Guoying Q (2014) Extraction Optimization and Characterization of Collagen from the Lung of Soft-Shelled Turtle _Pelodiscus_ _Sinensis_. International Journal of Nutrition and Food Sciences 3(4)3: 270-278.
-
Lafarga T, Hayes M (2014) Bioactive Peptides from Meat Muscle and By-products: Generation, Functionality and Application as Functional ingredients. Meat Science 98(2): 227-239.
-
Kim SE, Mendis E (2006) Bioactive Compounds from Marine processing Byproducts – a review. Food Research International 39(4): 383-393.
-
Gómez-Guillén MC, Giménez B, López-Caballero MA, Montero MP (2011) Functional and Bioactive Properties of Collagen and Gelatin from Alternative Sources: A review. Food Hydrocolloids 25(8): 1813-1827.
-
Abedin MZ, Karim AA, Gan CY, Ghazali FC, Barzideh Z, et al. (2015) Identification of Angiotensin I converting Enzyme inhibitory and Radical scavenging Bioactive Peptides from Sea Cucumber (Stichopus vastus) Collagen Hydrolysates through Optimization. International Food Research Journal 22(3): 1074-1082.
-
Wang L, Liang Q, Chen T, Wang Z, Xu J, et al. (2014) Characterization of collagen from the skin of Amur sturgeon (Acipenser schrenckii). Food Hydrocolloids 38: 104-109.
-
Pranoto, Lee CM, Park HJ (2007) Characterizations of fish gelatin films added with gallant and k-carrageenan. Food Science and Technology 40: 766-774.
-
Muyonga J, Cole CG, Duodu K (2004a) Fourier Transform Infrared (FTIR) Spectroscopic Study of Acid Soluble Collagen and Gelatin from Skins and Bones of Young and Adult Nile Perch (_Lates niloticus_). Food Chemistry 86: 325-332.
-
Duan R, Zhang J, Du X, Yao X, Konno K (2009) Properties of collagen from skin, scale and bone of carp (_Cyprinus_ _carpio_). Food Chemistry 112: 702-706.
-
Liu H, Li D, Guo S (2007) Studies on collagen from the skin of channel catfish (_Ictalurus punctaus_). Food Chemistry 101: 621-625.
-
Ogawa M, Moody MW, Portier RJ, Bell J, Schexnayder M, et al. (2003) Biochemical properties of black drum and Sheepshead sea bream skin collagen. Journal of Agricultural and Food Chemistry 51: 8088-8092.
-
Nalinanon S, Benjakul S, Kishimura H (2010) Collagens from the skin of arabesque greenling (_Pleurogrammus_ _azonus_) solubilized with the aid of acetic acid and pepsin from albacore tuna (_Thunnus alalunga_) stomach. Journal of Sciences, Food and Agriculture 90: 1492-1500.
-
Nalinanon S, Benjakul S, Visessanguan W, KIshimura H (2007) Use of Pepsin for Collagen extraction from the Skin of Bigeye Snapper (_Priacanthus tayenus_). Food Chemistry 104: 593-608.
-
Jongjareonrak A, Benjakul S, Visessanguan W, Nagai T, Tanaka M (2005) Isolation and characterization of acid and pepsin-solubilised collagens from the skin of brown stripe red snapper (Lutjanus vitta). Food Chemistry 93: 475-484.
-
Woo JW, Yu SJ, Cho SM, Lee YB, Kim SB (2008) Extraction optimization and properties of collagen from yellow fin tuna (Thunnus albacores) dorsal skin. Food Hydeocolloids 22(5): 879-887.
-
Kimura S, Omura Y, Ishida M, Shirai H (1993) Molecular characterization of fibrollar collagen from the body wall of starfish Asterias amurensis. Comp Biochem Physiol Part B Comp Biochem 104: 663-668.
-
Skierka E, Sadowska M (2007) The influence of the different acids and pepsin on the extractability of collagen from the skin of Baltic cod (Gadus morhua). Food Chemistry 105(3): 1302-1306.
-
Wang L, An X, Xin Z, Zhao L, Hu Q (2007) Isolation and characterization of collagen from the skin of deep-sea redfish (_Sebastes mentella_). Journal of Food Science 72(8): E450-E455.
-
Gomez-Guillen MC, Turnay J, Fernandez-Diaz MD, Ulmo N, Lizarbe MA, et al. (2002) Structural and Physical properties of gelatin extracted from different marine species: A comparative study. Food Hyrocolloids 16(1): 25-34.
-
(2010) Officials Methods of Analysis. In: 17th (Edn.), Association of Official Analytical Chemists. Washington DC, USA.
-
Otitoju GTO (2009) Effect of dry and wet milling processing techniques on the nutrient composition and organoleptic attributes of fermented yellow maize (Zea mays). African Journal of Food Sciences 3: 113-116.
-
Li ZR, Wang B, Chi CF, Zhang QH, Gong YD, et al. (2013) Isolation and characterization of acid soluble collagens and pepsin soluble collagens from the skin and bone of Spanish mackerel (_Scomberomorous niphonius_). Food Hydrocolloids 31(1): 103-113.
-
Muyonga JH, Cole CGB, Duodu KG (2004b) Characterization of Acid soluble Collagen from Skins of young and adult Nile perch (_Lates niloticus_). Food Chemistry 85(1): 81-89.
-
Shanmugam V, Ramasamy P, Subhapradha N, Sudharsan S, Seedevi P, et al. (2012) Extraction, structural and physical characterization of type I collagen from the outer skin of Sepiella inermis (Oribigny, 1848). African Journal of Biotechnology 11(78): 14326-14337.
-
Hashim P, Ridzwan MSM, Bakar J (2014) Isolation and characterization of collagen from chicken feet. International Journal of Biological Agricultural Biosystems. Life Science and Engineering 8: 231-235.
-
Zhang Y, Liu W, Li G, Shi B, Miao Y, et al. (2007) Isolation and partial characterization of pepsin-soluble collagen from the skin of grass carp (Ctenopharyngodon idella). Food Chemistry 103(3): 906-912.
-
Nagai T, Suzuki N (1999) Isolation of collagen from fish waste material - skin, bone and fins. Food Chemistry 68: 277-281.
-
Iqbal Z (2002) Proximate composition of skin, scales and fins of Catla catla, Labeo rohita and Cirrhina mrigala. University of Panjab, Pakistan.
-
Nagai T, Araki Y, Suzuki N (2002a) Collagen of the skin of oscillate puffer fish (Takifugu rubripes). Food Chemistry 78(2): 173-177.
-
Nagai T, Suzuki N, Nagashima T (2008) Collagen from common minke whale (Balaenoptera acutorostrata) unesu. Food Chemistry 111(2): 296-301.
-
Nagai T, Nagamori K, Yamashita E, Suzuki N (2002b) Collagen of octopus Callistoctopus arakawai arm. International Journal of Food Science and Technology 37(3): 285-289.
-
Nagai T, Yamashita E, Taniguchi K, Kanamori N, Suzuki N (2001) Isolation and characterization of collagen from the outer skin waste material of cuttlefish (Sepia lycidas). Food Chemistry 72: 425-429.
-
Knott L, Bailey AJ (1998) Collagen cross-links in miner- alizing tissues: A review of their chemistry, function, and clinical relevance. Bone 22(3): 181-187.
-
Hee-Seok J, Jayachandran V, Se-Kwon K (2013) Isolation and Characterization of Collagen from Marine Fish (Thunnus obesus). Biotechnology and Bioprocess Engineering 18: 1185-1191.
-
Kittiphattanabawon P, Benjakul S, Visessanguan W, Kishimura H, Shahidi F (2010a) Isolation and characterisation of collagen from the skin of brownbanded bamboo shark (Chiloscyllium punctatum). Food Chemistry 119(4): 1519-1526.
-
Cheng FY, Hsu FW, Chang HS, Lin LC, Sakata R (2009) Effect of Different Acids on the Extraction of Pepsin- Solubilised Collagen Containing Melanin from Silky Fowl Feet. Food Chemistry 113(2): 563-567.
-
Lin YK, Liu DC (2006b) Comparison of Physical–Chemical Properties of Type I Collagen from Different Species. Food Chemistry 99(2): 244-251.
-
Zhang J, Duan R, Tian Y, Konno K (2009) Characterisation of acid-soluble collagen from skin of silver carp (_Hypophthalmichthys molitrix_). Food Chemistry 116(1): 318-322.
-
Balti R, Jridi M, Sila A, Souissi N, Nedjar-Arroume N, et al. (2011) Extraction and functional properties of gelatin from the skin of cuttlefish (Sepia officinalis) using smooth hound crude acid protease-aided process. Food Hydrocolloids 25(5): 943-950.
-
Piez KA, Gross J (1960) The Amino Acid Composition of some Fish Collagens: The Relation between Composition and Structure. The Journal of Biological Chemistry 235(4): 995-998.
-
Nam KA, You SG, Kim SM (2008) Molecular and Physical Characteristics of Squid (_Todarodes pacificus_) Skin Collagens and Biological Properties of their Enzymatic Hydrolysates. Journal of Food Science 73(4): 249-255.
-
Kui SK, Mendis E (2008) Bioactive compounds from marine processing byproducts- a review. Food Research International 39(4): 383-393.
-
Li F, Jia D, Yao K (2009b) Amino acid Composition and Functional properties of Collagen Polypeptide from Yak (_Bos gruinniens_) bone. Food Science and Technology 42(5): 945-949.
-
Kittiphattanabawon P, Benjakul S, Visessanguan W, Nagai T, Tanaka M (2005) Characterization of acid soluble collagen from the skin and bone of bigeye snapper (_Priacanthus tayenus_). Food Chemistry 89(3): 263-372.
-
Bae I, Osatomi K, Yoshida A, Osako K, Yamaguchi A et al. (2008) Biochemical Properties of Acid-soluble Collagens extracted from the Skins of Underutilised fishes. Food Chemistry 108(1): 49-54.
-
Matmaroh K, Benjakul S, Prodpan T, Encarnacion AB, Kishimura H (2011) Characteristics of Acid Soluble Collagen and Pepsin Soluble Collagen from Scale of spotted Golden Goatfish (Parupeneus heptacanthus). Food Chemistry 129(3): 1179-1186.
-
Payne KJ, Veis A (1988) Fourier Transform infra red spectroscopy of collagen and gelatin solutions: Deconvolution of the amide 1 band for conformational studies. Biopolymers 27(11): 1749-1760.
-
Jian-xin H, Zheng Z (2009) Study on enzymatic hydrolysis of Gadusmorrhua skin collagen and molecular weight distribution of hydrolysates. Agricult Sci China 8(6): 723-729.
-
Yata M, Yoshida C, Fujisawa S, Mizuta S, Yoshinaka R (2005) Identification and characterization of molecular species of collagen in fish skin. Food Science 66(2): 247-
-
Hue CT, Hang NTM, Razumovskaya RG (2017) Physicochemical Characterization of Gelatin Extracted from European Perch (Perca fluviatilis) and Volga Pikeperch (Sander volgensis) Skins. Turkish Journal of Fisheries and Aquatic Sciences 17: 1117-1125.
-
Lin YK, Liu DC (2006a) Effects of Pepsin Digestion at Different Temperatures and Times on Properties of Telopeptide-poor Collagen from Bird feet. Food Chemistry 94(4): 621-625.
-
Doerscher DR, Briggs JL, Lonergan SM (2004) Effects of Pork Collagen on Thermal and Viscoelastic Properties of Purified Porcine Myofibrillar Protein Gels. Meat Science 66(1): 181-188.
-
Balian G, Bowes H (1977) The structure and properties of collagen. In: Ward AG, Courts A (Eds.), The Science and Technology of Gelatin, London: Academic Press, UK, pp: 1 - 30.
-
Hashim P, Mohd Ridzwan MS, Bakar J, Mat Hasim D (2015) Collagen in Food and Beverage Industries. International Food research Journal 22(1): 1-8.
-
Khan MI, Arshad MS, Anjum FM, Semeen A, Rehman A, et al. (2011) Meat as a functional food with special reference to probiotic sausages. Food Research International 44(10): 3125-3133.
-
Kretshmer CB (1957) Infrared spectroscopy and optical rotatory dispersion of zein, wheat gluten and gliadin. Journal of Physical chemistry 61(12): 1627-1631.
-
Li D, Mu C, Cai S, Lin W (2009a) Ultrasonic Irradiation in the Enzymatic Extraction of Collagen. Ultrasonics Sonochemistry 16(5): 605-609.
-
Lin YK, Lin TY, Su HP (2011) Extraction and Characterization of Telopeptide-Poor Collagen from Porcine Lung. Food Chemistry 124(4): 1583-1588.
-
Liu DC, Lin YK, Chen MT (2001) Optimum condition of extracting collagen from chicken feet and its characteristics. Asian Australasian Journal of Animal Sciences 14(11): 1638-1644.
-
Blow N (2009) Cell culture: building a better matrix. Nature Methods 6(8): 619-622.
-
Nelson DL, Cox MM (2005) Lehninger. Principles of Biochemistry. In: 4th (Edn.), WH Freeman, New York.
-
Pang S, Chang YP, Woo KK (2013) The Evaluation of the Suitability of Fish Wastes as a Source of Collagen. 2nd International Conference on Nutrition and Food Sciences IPCBEE 53: 77-81. 64. Queensland Department of Primary Industries and Fisheries (2014) Fish note, Nile Perch (_Lates niloticus_).
- An Efficient and Affordable Method for Isolating Bone Marrow- Derived Mesenchymal Stem Cells from Swiss Albino Mice
- Superposition of Cryo-EM and AlphaFold Predictions of Dengue Antigen-Antibody Complexes
- Jugular-Applied Coherent Low-Level Laser Therapy Enhances Systemic Mitochondrial Metabolic Function and Antioxidant Response
- Role of OMC32 Polypeptide in Acrosin-Mediated Exocytosis during the Bovine Sperm Acrosome Reaction
- Association of Galectin-3 but not Laminin in Tamoxifen-Induced Growth Suppression in Breast Cancer MCF-7 Cells
- Effect of Different Wavelengths of Light on the Rate of Photosynthesis