Method for Estimating Ecological Carrying Capacity of DataPoor Coastal Finfish Cage Aquaculture Sites in Southeast Asia at System-Scale
This study presents the development of a simple and generally applicable method for estimating ecological carrying capacity (ECC) of coastal finfish cage aquaculture at the system-scale in Southeast Asia and potentially other data-poor island nations. The ECC method relies primarily on results of dynamic models for simulation of organic loading due to multiple fish farms. In this study, the ECC method was successfully integrated within a methodology under development at Kiel University to holistically evaluate site suitability, ecological carrying capacities at farm-level and system-scale, as well as siting. Results of the application of the methodology for a target aquaculture site in northwest Bali, Indonesia, are presented in this study. Analysis of these results identified traditional fish farms located outside suitable areas and large-scale commercial farm clusters operating beyond ecological carrying capacity. Nonetheless, it was found that production output of the site in Bali is far below ECC and that it could be increased considerably without harming the environment. Recommendations have been made for reallocating the mispositioned farms as well as for reducing fish production of the farm clusters while expanding overall fish production to the east. The ongoing operational early warning monitoring at the site in Bali is being supplemented with regular monitoring of sediment quality in the seafloor and water quality in the aquaculture area to promote sustainable development. The proposed methodology has wide applicability and can be easily adapted to other regions for investigating present conditions and planning new aquaculture sites in pristine regions. The methodology is currently being up scaled to several target sites selected by the Indonesian Government to expand the activity.
Introduction
Average global fish consumption has increased significantly in the last few decades. As a result, aquaculture has surpassed global capture fisheries in seafood production [1]. Asia currently accounts for nearly 90 percent of global aquaculture production [2]. China will remain the world’s leading producer for the next few decades, while India and several Southeast Asian countries are expected to intensify their production [2, 3].
Among the different forms of aquaculture in Asia, marine cage finfish farming is still in the early stages and is yet underdeveloped compared to other forms; however, expansion of the aquaculture industry is rapid and will require significant increases in the cultivated area both onshore and offshore. This may exert considerable strain on aquatic and terrestrial resources as well as on the environment. Farmers in Asia are increasingly replacing traditional technologies using relatively small-scale coastal finfish farms with few cages by highly intensive large-scale commercial farm clusters with large cage-depths, high stocking densities, and excessive use of antibiotics and other veterinary drugs and pesticides to compete with Western producers. While this greatly expands the production output, it also increases environmental impact [4]. Although the culture sites in Asia offer excellent conditions, many aquaculture operations are adjacent to ecologically sensitive coral reefs and flats, bordered by mangroves, and exposed to potential hazards. As a result, many sites have been operating far beyond their ecological carrying capacity and causing significant impacts to the environment.
Currently, many countries in Southeast Asia are intensifying their fish production to meet food security and job creation targets. The Government of Indonesia, for example, is drafting an ambitious new long-term development plan to meet production targets of 31.4 million tonnes by 2027 and 37.6 million tonnes by 2030 [5]. Several coastal sites have been selected by the Government for expansion of aquaculture activity to reach this target [6]. The implementation of this plan would substantially expand the aquaculture activity in the country. However, the spatial planning and siting strategies currently adopted are inadequate or non-existent, and data for decision- making is scarce. Therefore, there is a need for systematic spatial planning approaches that allow for the growth and development of the aquaculture industry and minimize the impacts to the marine ecosystems in sites with scarce data.
The Food and Agriculture Organization of the United Nations (FAO) has proposed the Ecosystem Approach to Aquaculture (EAA) to ensure proper planning and sustainable aquaculture operations [7, 8]. The adoption of environmentally sustainable practices and managerial schemes following the protocols of the EAA is essential for enhancing sustainable development and expansion of the aquaculture industry; moreover, it is a pre-requisite to ensure compliance with the existing regulatory framework. There has been increased awareness of the demand for comprehensive and participatory approaches since the implementation of EAA. However, the practical implementation of EAA has been slow [9] despite the positive developments and increasing consciousness of farm developers and policymakers towards its adoption. For example, limited data and lack of cost-effective tools and standardized methods for planning and management of aquaculture sites have been hindering EAA implementation in Southeast Asia. The FAO has published comprehensive guidelines on the framework of the approach for planning and management of aquaculture sites to facilitate the adoption of the EAA [10].The report summarizes the results of several case studies, providing insight into the aquaculture development stage in various countries. Emphasis is given to the spatial planning processes and identification of tools and models for selecting sites and estimating ecological carrying capacities [11]. Apart from the diversity of objectives in the case studies, there are major differences in the level of sophistication of the adopted techniques. Furthermore, the application of virtual technologies and models is restricted to research, particularly in most emerging countries, and only more recently have they been used for actual planning and management of cage aquaculture. A suite of best practices extracted from the EAA was outlined by Bone, et al. [5] to provide effective guidelines for policymakers. Recommendations for enhancing the management of marine finfish aquaculture sites in Indonesia have also been provided.
A simple and generally applicable methodology for selection of sustainable locations for installation of fish farms, estimating ecological carrying capacities at farm- level and system-scale, as well as for siting of fish farms has been developed at Kiel University to support planners and stakeholders in the assessment of currently operating aquaculture sites and in the planning of new sites in remote coastal areas. This study focuses on development of the method for estimating the ecological carrying capacity (ECC) and assimilative capacity at the system-scale. A target aquaculture site in northwest Bali, Indonesia was investigated. High-resolution surveys were carried out, and dynamic models were developed for predicting the particulate and dissolved emissions due to multiple fish farms. A detailed description of the ECC method and its integration within the general methodology for spatial planning is described in the present study. Results of the application of this methodology to the aquaculture site in Bali are presented to illustrate its effectiveness for sites in Southeast Asia.
Models for Estimating Ecological Carrying Capacity of Marine Finfish Aquaculture
Marine finfish aquaculture has the potential to negatively affect aquatic ecosystems, e.g., through increased dissolved nutrient and particulate waste emitted by fish farms. Both feed and feces emitted by fish farms are high in organic material that will add nutrients into the otherwise nutrient-poor environments. Dissolved nutrients from fish farms consist of nitrogen-based products, such as ammonia, nitrate, and nitrite, and phosphorus. The main components of such organic waste are the high levels of organic carbon that provide a substrate for bacteria in the sediment. Although dissolved quantities released by fish farms are barely noticeable in their near vicinity, the cumulative effect of multiple fish farms might lead to enrichment of nutrients in the water column, leading to eutrophication. Particulate organic waste from fish farms, on the other hand, usually settles in the near vicinity of fish farms and might affect the seafloor sediments. Since part of this solid waste might be transported over vast areas, it might cause impacts in the regions of settlement. Estimation of ECC must therefore account for the impacts of fish farms on both benthic and pelagic environments. The cumulative effects of fish farming of nutrient concentrations in the water column and the rates of deposition of organic matter on seafloor sediments must remain within acceptable limits throughout the entire system to ensure ecologically sustainable aquaculture operations.
A wide range of models have been developed for assessing the environmental impacts of marine finfish farming. Models for estimating the impacts of fish farms at the farm-level are generally more advanced than those for assessing conditions at the system-scale [10, 11]. DEPOMOD is currently the most frequently applied model for assessing ecological carrying capacity of singular fish farms at farm- level [12]. It was originally developed for Atlantic salmon but has been adapted to other species and environments including the tropics. The model has been successfully employed by regulators for licensing of aquaculture ventures. Moreover, it is used as a standard for assessing the impacts and associated changes in the benthic community arising from individual fish farms in a 1 km × 1 km area around the fish farm. Estimation of ecological carrying capacity relies primarily on the predictions of a waste dispersion model using current velocity profiles from on-site measurements or circulation models from the location of each fish farm [12]. Predictions are restricted to the near vicinity of fish farms and to scenarios where the impact of dissolved waste from the surrounding fish farms could be neglected. However, the spatial circulation patterns can be extremely complex in coastal areas, and it is not always correct to assume constant flow fields at a fish farming location based on nearby current velocities. In general, the model disregards interactions among fish farms despite the concerns that the wastes might reach the far-fields and produce negative impacts [13]. Despite these shortcomings, it is still a common practice to apply several individual models of fish farms based on DEPOMOD for estimating the maximum permissible fish biomass in the aquaculture site. Symonds (2011) carried out comparisons of the performance of several fish farm models based on DEPOMOD and a three-dimensional far- field model based on Delft3D to assess the implications associated with the adoption of near-field models. The study has demonstrated several benefits of adopting the far-field model. The results based on DEPOMOD were found unable to deliver robust answers to system-scale ecological carrying capacity since they ignore the cumulative impacts of nearby fish farms [13, 14].
Assessments of the impacts of aquaculture sites at the system-scale, which is the object of the present study, must account for the spatial variability of currents and allow the evaluation of the impacts of multiple fish farms over the entire aquaculture site. The impacts of dissolved nutrients depend mainly on the ability of the surrounding ecosystem to assimilate these wastes and the ability of current flows to dilute and dissipate the nutrient products. Hence, appraisals at the system-scale require the flow field from two- dimensional or three-dimensional models. These models are seldom available because of limited environmental data, particularly in the vicinity of the coast, and the difficulties in developing dynamic models for sites with variable bathymetries and small-scale flow interactions. As a result, assessments of ECC at the system-scale are still in their infancy, particularly near the coast. There are several reviews on the models used for estimating ECC of aquaculture sites at the system-scale [11, 13, 15, 16, 17]. Most of the assessments carried out so far have adopted site-specific dynamic models for simulation of circulation and water quality. Most of these models have covered off-the-coast aquaculture sites using relatively coarse grids with horizontal grid resolutions in the order of few hundred meters [18, 19, 20]. There are very few generally applicable modeling systems for assessing ECC at the system-scale. AquaModel, to our knowledge, is one of the few systems available for this purpose. The system accounts for particulate and dissolved waste at the farm- level and the system-scale, and it is equipped with interfaces to commonly-used three-dimensional oceanic models [21]. However, the majority of the AquaModel applications have covered offshore aquaculture sites based on results from oceanic circulation models [21, 22, 23]. Oceanic models can predict large-scale circulations on spatial scales of the order of 10 km or less reasonably well. However, they are unable to resolve smaller-scale interactions owing to the variable bathymetries and relatively small sizes of fish farms typical of coastal aquaculture sites.
Proposed Methodology for the Spatial Planning of Coastal Finfish Cage Aquaculture Sites
Models such as DEPOMOD and AquaModel are adequate for conducting assessments at aquaculture sites worldwide. However, they are complex and require a sizeable amount of input data, which is seldom available in remote areas typical of Southeast Asia. The development of models and tools for the spatial planning of coastal finfish aquaculture in sites with scarce data is one of the main challenges in the marine aquaculture field. Therefore, a simple and generally applicable methodology has been developed in the context of the EAA by the authors to holistically evaluate site suitability, estimate the appropriate sizes of fish farms, and define the optimal arrangement of aquaculture sites in Southeast Asia and potentially other island nations.
The proposed methodology under development at Kiel University essentially comprises four methods, viz., for determining physical carrying capacity or site selection (SS), estimating production carrying capacity or carrying capacity at the farm-level (PCC), determining ecological carrying capacity at the system-scale (ECC), and determining the optimum arrangement of fish farms or siting (SIT) [24, 25, 26, 27]. The adequacy of the methods for SS and PCC has already been demonstrated and applied to sites in Indonesia [28, 29, 30]. The ECC method, which is the prime focus of this study, extends the methodology with capabilities for estimating ECC and assessing assimilative capacity at the system-scale. The SIT method implements an optimization algorithm to determine the optimal arrangements of fish farms to maximize overall fish production while ensuring a balance between cumulative nutrient concentrations and the specified water quality standards. The latter is currently under development and will be the focus of a follow-up publication. A cost-effective monitoring strategy has been developed and is being applied in conjunction with the proposed methodology to ensure environmentally sustainable operations [31]. The suite of methods is based primarily on the results of dynamic models for simulation of flow, waves, and water quality, making it generally applicable and cost-effective for sites with limited data. Guidelines on the development of coastal models, especially when very little environmental data is available, are provided hereafter. The methodology has been designed for the present operating conditions and to support the spatial planning of new aquaculture sites in pristine regions when a coastal site is being investigated for its mariculture potential. The methodology has been embedded within a computer- based decision support system (DSS) to facilitate upscaling to other sites and support planners in the assessment of marine finfish cage clusters [32].
Applications essentially comprise the following steps. Firstly, areas within the aquaculture site that are suitable for installation of fish farms are selected with the SS method. This enables the location of existing fish farms to be verified, and areas for expansion of the activity can be defined. Permissible cage depths for given stocking densities for the cultivated species or vice-versa are then determined with the PCC method. The results enable identification of farms that are operating beyond ecological carrying capacity. Subsequently, the ECC method which is described here after, is applied to estimate the overall fish production output of the entire aquaculture site to guarantee environmentally sustainable operations. The method must ensure that the production of the operating sites remains below the ECC limits. Fish farming sizes and farming arrangements are initially defined by considering the acceptable cage depths for the cultivated species and proper farming distances for sites under planning. Modelled current velocities at farming locations and falling velocities of fish farming waste are adopted to estimate the required spacing among fish farms [33]. Finally, the effectiveness of different farming layouts in conjunction with fish farming sizes is analyzed. The fish farming arrangement leading to maximum fish production is selected using the SS method.
The proposed methodology has wide applicability and can be easily adapted to other coastal sites for investigating present conditions and planning new aquaculture sites in pristine regions in Southeast Asia. As the proposed suite of methods rely primarily on results from dynamic models, the development of site-specific models is essential. Despite of the limitation in on-site data, it is possible to develop ad-hoc coastal models using essentially data from available databases and global oceanic models. Guidelines for the development of dynamic models in data-poor sites in Southeast Asia are summarized in section 5. Model simulations for typical environmental conditions deliver the spatial information in terms of water levels, current velocities, waves and nutrient concentrations for the entire aquaculture site. Application of the suite of methods provides in turn straightforward assessments in the aquaculture site. Once the potential of the site is confirmed for aquaculture development, specially designed on-site measurements are carried out for validating of the dynamic models and improving the predictive capacity and robustness of the predictions.
Method for Estimating ECC and Assimilative Capacity of Coastal Finfish Cage Aquaculture Sites
The method proposed for estimating ECC and the assimilative capacity of coastal finfish aquaculture sites is based primarily on the results of dynamic models covering the entire aquaculture site. ECC at the system-scale is defined as the magnitude of aquaculture production at which there is a balance between the maximum nutrient concentrations due to multiple fish farms and the degree of environmental impact that is deemed to be acceptable according to the environmental quality standards. The framework for calculating ECC proposed by Tett, et al. [34] has been adopted in the development of the ECC method. Estimates are based on dose-response curves of modeled cumulative nutrient concentrations against increasing production level-scenarios of fish farms. Site-specific dynamic models for simulation of water quality are applied for predicting the concentrations of nutrients due to multiple fish farms. Locations within the site with the highest cumulative nutrient concentrations are monitored for conducting the estimations. The water quality standards established by the Association of Southeast Asian Nations are adopted for sites in Southeast Asia [35]. The parameters specified for assessing the impacts of fish farms on the environment are the concentrations of nitrate and ammonia in the water column. Threshold values of ammonia and nitrate are 70µg/l and 60 µg/l, respectively [35].
Since the adopted water quality standards specify constant threshold values in terms of nutrient concentrations, emphasis must be given to the selection of model scenarios leading to the highest cumulative values within the aquaculture site. Periods with low tides in combination with high background nutrient concentrations that are common to the rainy season should be particularly foreseen for conducting the assessments. Typically, locations with low water exchange where current flow is weak and flushing rates are limited in comparison to the amount of waste emitted from fish farms should be envisaged. Assessments should be conducted for conditions with the highest level of biomass in the aquaculture site prior to harvest. It is recommended to estimate ECC by considering all the fish farms operating simultaneously at full capacity. We recommend conducting simulations over full spring per neap tidal cycles to account for the spatiotemporal variability of tidal currents and nutrient concentrations within the aquaculture site.
The analysis of the assimilative capacity at the system- scale is done by assessing the risk of cumulative accumulation of solid waste due to multiple fish farms and the degree of its disturbance to the benthic community. The carbon content (C) in the sediments underneath fish farms is taken as the indicator of environmental disturbances in the present study. Predicted footprints of C accumulation provide evidence of the degree of the impacts on the benthos in the aquaculture site. Scenarios leading to maximum accumulation on seafloor are foreseen. Due to the complexity of the processes involved and bearing in mind the adopted model simplifications, on- site assessments of sediment quality beneath fish farms are used to optimize the dynamic model [31]. Fish farms experiencing initial signs of deterioration are selected for calibrating the model. Details of the optimization procedure are given by Mayerle, et al. [30].
General Guidelines for Developing Dynamic Models in Data-Poor Sites in Southeast Asia
Dynamic models for simulation of the organic wastes generated by multiple fish farms used within the method for estimating ECC at system-scale usually comprise sub-models for circulation and water quality. Their development requires the modeling software for representation of the physics of the site and the site-specific data. There are several open-source coastal engineering models currently available (see www. coastalhazards.org/software-links.html). Environmental data presents the main constraint for the set-up of site- specific models particularly in remote coastal sites. Since the cost of on-site measurements is high, developing ad-hoc models combining the available site-specific data with data from global databases and oceanic models in conjunction with information from remote sensing imagery is recommended. An overview of the most essential global oceanic models and the existing satellite information that has been used in the development of models for marine finfish aquaculture sites in Indonesia is summarized in Mayerle, et al. [6]. The setting-up of three-dimensional models with horizontal grid spacing in the order of few tenths of meters is recommended to deliver reliable and robust predictions in sites with complex bathymetries [6]. This is required to account for the highly variable coastal relief and the effect of the traditional floating net cages on the circulation. Particular attention must be given to the bathymetric data in the vicinity of the coast. Several layers over the vertical are needed to account for the effect of the three-dimensional structure of the floating net cages on the fate and transport of fish farming emissions. Assessment of model accuracy is essential for obtaining reliable predictions. The latter depends more on the quality of the input data, particularly bathymetry and open sea boundary conditions, than on the representation of the physics or the numerical solution approach [36]. The assessment of the circulation model is essential since the fate of organic loading from fish farms is strongly dependent on the flow conditions. The use of adjusted relative mean absolute error (ARMAE), which accounts for the influence of the observational errors, is recommended for validation of the circulation models [37].
Mariculture Site in Bali, Indonesia
Description of the site
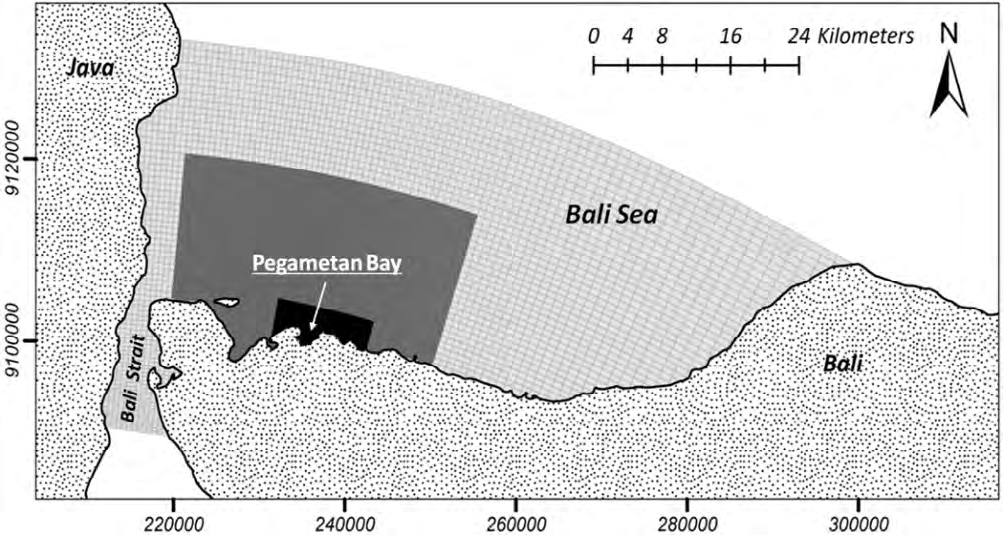
Northwest Bali is one of the leading production centers of high-value aquaculture commodities in Indonesia. There are two main operating coastal finfish aquaculture sites in the region at present, viz., Pegametan Bay and Patas, both located about 50 km west of Singaraja. Pegametan Bay (8.13 °S, 114.6 °E), the target site investigated in this study, was selected for developing and demonstrating the effectiveness of the methodology for evaluating site suitability and ecological carrying capacities at the farm-level and the system-scale. The site is located in the vicinity of the Gondol Research Institute for Mariculture of the Ministry of Marine Affairs and Fisheries in Indonesia (MMAF), making it easier to conduct the investigations.
The area of interest (coastal model area) covers about 35 km² along a coastal stretch of around 10 km. Figure 1 shows an overview of the study area with a satellite image from 2014. The prominent characteristics of the site are a coral reef system embedding two tidal channels that surround a central coral reef platform. The outer reef barrier largely shields the inner reef area from the waves. The central reef platform divides the inner bay into the two main channels. Water depths are less than 1 m in the coral reef flats and over 50 m at the reef slope facing the Bali Sea. The water depths along the channels range between about 5-25 m. Hydrodynamics and flushing of the channels is predominantly driven by mixed tides ranging from about 0.7-1.8 m. Current velocities are generally smaller than 0.02-0.03 m/s but can reach about 0.20 m/s during spring tides. The channel to the west is wider and shallower, and current velocities are extremely small since it ends on the coastline. Current velocities in the eastern channel are mostly higher than those in the western channel since the former is narrower and open to the Bali Sea at both ends. Winds in northwest Bali can reach speeds of about 12 m/s during monsoons [38]. Nutrient concentrations in the bay are generally very low, seawater temperatures are in the range of 28°C to 30°C, and salinity in the bay varies between 28 PSU and 30 PSU. Freshwater enters the bay mainly through diffuse surface runoffs and small streams, which only exist during the rainy season [6].
![Figure 1: Study area Pegametan Bay. Satellite image Sep 17, 2014 [39].](/fulltextimages/7994/fig_1.png)
The site is characterized by three main depositional environments. Medium to light grey mud prevails in the deeper parts of the channels. Lower mud layers observed in sample sediment cores often show plastic consistencies due to consolidation. Muddy to sandy carbonate sediments with coarser coral debris embedded in them are spread along the flanks of the channels, while fine to coarse carbonate sands are common in the shallow channel systems and adjacent reef flats.
Finfish Mariculture Site in Bali
Finfish Mari culture of high-value commodities using floating net cages has been practiced in Pegametan Bay since 2001 and has grown to a total of 30 farms in 2015. The installation of marine finfish farms in the site has occurred in an ad-hoc manner based essentially on the experience from fish farmers and planners. Total fish production in 2016, 2017, 2018, 2019 and 2020 amounted respectively to about 843, 1106, 855, 844 and 390 metric tonnes [40-
42]. The reduction of fish production in 2020 was due to the COVID-19 pandemic. Pegametan Bay has been assigned exclusively to mariculture to minimize possible conflicts among different coastal uses and stakeholders, while the adjacent coastal areas have been assigned mainly to tourism and natural conservation [29].
Finfish species cultured in the site include Asian sea bass (Lates calcarifer), tiger grouper (Epinephelus fuscoguttatus), humpback grouper (Cromileptes altivelis), and some species of ornamental fish. The bulk of the standing stock consists of tiger grouper and Asian seabass. The location of the fish farms in 2015 are shown in Figure 2. Operative fish farms have a wide range of sizes [29]. The floating net cages of most farms are of the type most common found in Indonesia: the fish farms are small-scale cage farms consisting of wooden rafts kept afloat by plastic drums. Each cage typically measures 3 m × 3 m × 3 m, and the cages are connected to form a floating raft to reduce the effect of waves and currents. The stocking density of these farms used at the site mainly for cultivation of grouper is about 10-20 kg/m3. There are 18 traditional farms with up to 380 cages each (see farms 1-18 in Figure 2) along the western channel, while there are two large-scale commercial farm clusters in addition to 10 traditional fish farms with up to 320 cages along the eastern channel (see farms 19 to 30 in Figure 2).
![Figure 2: Operative fish farms have a wide range of sizes [29]. The floating net cages of most farms are of the type most common found in Indonesia: the fish farms are small-scale cage farms consisting of wooden rafts kept afloat by plastic drums. Each cage typically measures 3 m × 3 m × 3 m, and the cages are connected to form a floating raft to reduce the effect of waves and currents. The stocking density of these farms used at the site mainly for cultivation of grouper is about 10-20 kg/m3. There are 18 traditional farms with up to 380 cages each (see farms 1-18 in Figure 2) along the western channel, while there are two large-scale commercial farm clusters in addition to 10 traditional fish farms with up to 320 cages along the eastern channel (see farms 19 to 30 in Figure 2).](/fulltextimages/7994/fig_2.png)
The commercial farm clusters (see farms 21 and 30 in Figure 2) comprised 7-8 circular floating units of high- density polyethylene (HDPE) cages for nursery and grow- out. The cages in operation were 20 m in diameter, with cage depths of about 6-7 m and were located relatively close to each other. The stocking densities of the circular cages for the cultivation of Asian seabass were about 25-30 kg/m3. Except for the farm clusters and the large-scale traditional farms, the remaining farms were relatively small, and their emissions were not significant. However, the cumulative effect of multiple farm emissions can lead to problems of eutrophication in the site. Furthermore, accumulation of solid waste from the fish farms on seafloor might cause impacts on the benthos and should be monitored as well.
Measurements and Monitoring at the Aquaculture Site in Bali
An array of high-resolution surveys and mapping technologies has been used to assess the interactions between the environmental conditions and the fish farms in Pegametan Bay. Measurements were carried out for developing and accessing the performance of the dynamic models and the methodology for spatial planning of coastal finfish cage aquaculture under development at Kiel University. On-site measurements were supplemented with data from existing databases and global oceanic models. Additionally, remote sensing information of farming locations and sources of diffusive run-off were analyzed [6]. Emphasis was given to chemical and sedimentological parameters for defining suitable locations for installation of fish farms and for selecting the simulation scenarios for estimating ecological carrying capacities at farm-level and system-scale.
The bathymetry in Pegametan Bay used for the set-up of the dynamic model was measured in 2008 with a vessel- mounted echosounder. A tidal gauge was installed in the eastern channel of the bay for measurement of water levels to assess the performance of the circulation model (see yellow arrow in Figure 2). Vessel-mounted CTDs were deployed in conjunction with Niskin bottles for profiling salinity and water temperature and delivering concentrations of nutrients. Surficial water samples were collected throughout the entire aquaculture site during different seasons to obtain information on the spatio-temporal variability of nutrients. The results of surveys carried out in January 2008 during the rainy season and in September 2012 towards the end of the dry season were selected for use in the present study. Background concentrations of nutrients were very low in both periods, indicating the excellent water quality conditions of the site for cultivation of marine finfish (see Table 1). Although increases in nutrient concentrations were observed locally near the coast, the assessments were unable to properly detect the cumulative effect of multiple fish farms in the aquaculture site [29].
On-site assessments for sediment quality were conducted underneath the largest fish farms accounting for 80 % of the site production and at pristine locations for reference. Runte, et al. [31] carried out appraisals of benthic impacts due to fish farming at the aquaculture site. The location of the sampled fish farms is shown in Figure 2 (see farms numbered in red). Sediment samples were analyzed for several sediment indicators. The results were used in the development of a generally applicable monitoring strategy for analyzing the environmental impacts of nearshore finfish aquaculture sites in Indonesia [31]. The results of the monitoring have also proved to be well suited for optimizing the relationship for estimating PCC [30].
The aquaculture site has been equipped with several operational monitoring systems. Multi-parameter sensors deployed at several locations (see Figure 2) for early warning of salinity, water temperature, turbidity, and dissolved oxygen are currently in operation in Pegametan Bay [6]. An acoustic non-intrusive device for measuring waves was installed to the east of the bay to obtain long-term wave data and for early warning purposes. Data was transferred in real time to a data center at the Gondol Research Institute of Mariculture (GRIM) of the MMAF and the Research and Technology Centre Westcoast of the University of Kiel in Germany. The aim was to alert fish farmers to the periods of sudden changes in environmental conditions during severe storms and other adverse conditions relevant to the operation of the aquaculture site.
Dynamic Model of The Aquaculture Site in Bali
A three-dimensional model for simulation of organic loading due to multiple fish farms was developed for the Pegametan Bay in Bali. The modeling software adopted is based on the open source Delft3D modeling suite developed by Deltares [43] in the Netherlands (https://www.deltares. nl/en/software/delft3d-4-suite-Deltares, 2014 a, b). A description of the site- specific model of the site in Bali is presented below.
Model Domain, Grids, and Bathymetry
The computation was performed on three curvilinear grids with increasing grid resolution towards the coast. Figure 3 shows the horizontal set-up of the model grids. Sub- domain decomposition was adopted to allow grid refinements from the coarse model which covers parts of the Bali Sea and the Bali Strait, to the higher-resolution model covering the Pegametan Bay. Horizontal grid resolution ranged from 800 m in the outer model to about 25 m within the bay. Bathymetry data embedded information from different sources. The bathymetry offshore of the bay was compiled using data from GEBCO [44]. Near-shore bathymetric data was collected from our own surveys conducted in 2008 in conjunction with data from Geospatial Information Agency, Indonesia (BIG).
Dynamic Model For Simulation of Farming Emissions
A dynamic model for predicting the transport due to the emissions from the 30 fish farms in operation in 2015 was set-up for the site in Bali. The model comprised sub-models for circulation and water quality. The circulation model is composed of the three grids as shown in Figure 3. The two outer models are resolved with a two-dimensional depth- integrated approximation. The grid of the inner most model, which covered the Pegametan Bay, uses a three-dimensional approximation with five equally spaced sigma layers over the vertical, each covering 20 percent of the water depth. Tides were specified at the open sea boundaries of the outer most model with the Bali Sea and the Bali Strait (Figure 3). Tidal data from TPXO Model was used for this purpose [44]. Wind and atmospheric forcing from the Global Forecast System (GFS) developed by the National Centers for Environmental Prediction (NCEP) National Oceanic and Atmospheric Administration were enforced at the model free surface.
The performance of the circulation model was assessed by computing the water level time series registered at a tidal gauge located on the eastern channel. The location of the tidal gauge is indicated in Figure 2 (see yellow arrow). Model validation covered a period of 31 days with tidal ranges varying between 0.7-1.8 m. Overall, the model could recreate high and low water levels and the accurate shape of the tidal curve despite the lack of complete bathymetric data, particularly on the coral reefs and the central coral reef platform [30, 46]. Model performance in predicting water levels was found to be excellent according to the quality standards proposed by Walstra, et al. [37].
The three-dimensional circulation model covering the Pegametan Bay was coupled with the water quality model to simulate the transport due to the fish farming emissions (see Figure 3). The model solves the advection-diffusion equation for the transport of dissolved and solid wastes from the fish farms. Site specific conditions were accounted for while selecting the processes to be included in the model. It was assumed in the present study that phase transformation processes such as mineralization and uptake of nutrients are balanced. Denitrification was neglected due to the well oxygenated waters in Pegametan Bay. Nitrification of ammonia was considered as the main transformation process. The water quality model was also used for predicting the rate of carbon deposition on the seafloor due to multiple fish farms.
The effect of fish farms on the flow is accounted for in the three-dimensional model through porous plates [47]. Drag coefficients in the present study were chosen according to the net solidity of cages and angle of attack of currents as proposed by Loland [48]. Drag coefficients equal to 0.6 and 0.17 were used for the traditional rectangular cages and the circular cages respectively of the two large-scale farm clusters. Values were aligned with the experimental studies of Lader and Enerhaug (2005) and Kristiansen and Faltinsen [49, 50]. Sensitivity studies were carried out for the spring per neap tidal cycles from January 6 to 20, 2008 and September 12 to 25, to assess the effect of fish farms in the aquaculture site, with tidal ranges varying between about 0.7-1.8 m (see Table 1). The layout of the 30 farms in operation in 2015 was considered in the investigation (see Figure 2). Stocking densities of the traditional farms for cultivation of grouper and the two large-scale commercial farm clusters used for cultivating Asian seabass were 20 kg/m3 and 30 kg/m3, respectively. Fish farming conditions were considered while assessing the farm emissions. Daily feeding rates, proportion of wasted feed and excreted feces, as well as the percentage of carbon in feed and feces were taken into consideration. Table 2 lists the main values used in the simulations. Owing to the relatively low flushing rates in the channels, differences in current velocities between the simulations with and without fish farms were less than 2 cm/s and only barely noticeable near the fish farms on the eastern tidal channel. As a result, the effect of fish farming emissions on the nutrient concentrations turned out to be negligible and detectable only in the near vicinity of the fish farms.
In view of the scarce data for validation of the water quality model, a series of sensitivity studies was carried out to verify the ability of the model in predicting nutrient concentrations. In particular, the lack of continuous and simultaneous measurements of nutrients concentrations over the entire site and reliable information concerning fish farming production during the measurements hindered a proper model validation. Sensitivity studies were conducted on the relevance of the production levels of fish farms and the influence of coastal runoffs. Background nutrient concentrations measured in January 2008 during the rainy season and September 2012 during the dry season were imposed at the open sea boundaries of the model covering the Pegametan Bay. The values adopted in the simulations are listed in Table 1. Simulations were done by gradually increasing the production of all fish farms in the aquaculture site in Bali.
Figure 4 depicts the modelled cumulative nutrient concentrations over the aquaculture site for 10, 50 and 100 percent of the capacity of the fish farms. Results are shown for a time step during the period in September 2012. The results showed that the fish farming emissions have a clear effect on the levels of nutrients within the bay. While for 10 percent production levels cumulative concentrations are up to about 5 µg/l for ammonia and 10 µg/l for nitrate, for 100 percent production levels concentration values are up to about 50 µg/l for ammonia and exceed 60 µg/l for nitrate. The model could predict the nutrient concentrations within the range of measured values in reasonable agreement with the observations.
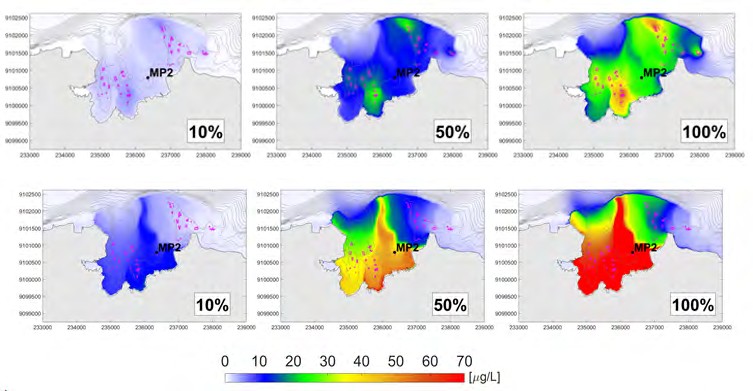
a) Ammonia
b) Nitrate Figure 4: Spatial variation of cumulative nutrient concentrations due to the emissions from increasing production level of fish farms for the conditions in September 2012 in Pegametan Bay.
In addition to the production level of fish farms, tidal conditions turned out to be the most determining factor controlling the levels of nutrients within the site. The results of model simulations showed that there are major variations in circulation patterns within a tidal cycle and more importantly for different tidal ranges. This can clearly be seen in Figures 8 & 9. The figures show the spatial variation of current velocities and cumulative concentrations of ammonia and nitrate due to the emissions from multiple fish farms over a tidal cycle for the conditions in January 2008 and September 2012. There are major differences in the magnitude of current velocities and on the circulation patterns within the aquaculture site over the simulated tidal cycles and between the simulated conditions in January 2008 and September 2012 which in turn affects the cumulative nutrient concentrations within the site.
To investigate the relevance of coastal runoffs on the nutrient concentrations within the bay, simulations were performed with and without point sources of discharges along the coast identified through satellite images to account for the effect of coastal runoffs. Landsat satellite imageries were used for locating the potential sources of runoff in Pegametan Bay [6]. Coastal runoffs were found to affect nutrient concentrations only in the near vicinity of the coast. However, attention should be placed during high-intensive rainfall/runoff events in which high levels of silt concentration are bound to enter coastal waters thus increasing the levels of nutrients in some parts of the bay.
Assessment of the Operating Conditions of the Aquaculture Site in Bali
Results of the application of the proposed methodology for assessing the operating conditions of the aquaculture site in Bali are presented hereafter. The location of the fish farms and the ecological carrying capacities at the farm-level and the system-scale were evaluated. Details of the aquaculture site, data from on-site appraisals, and a description of the dynamic model of the site in Bali used in the investigations are summarized in sections 6, 7, and 8, respectively.
Site Suitability
Assessment of the location of the fish farms in Pegametan Bay was performed with the SS method. Details of the method are summarized in Windupranata and Mayerle and Mayerle et al. [28, 29] A comprehensive description of the spatial data used in the site selection procedure is given by Mayerle, et al. [29]. In addition to the zoning scheme and maps of coastal uses for the northwest of Bali, on-site measurements and results of dynamic model simulations in terms of current velocities and waves covering the entire site were overlaid to define areas suitable for marine finfish farming. Water depths, current velocities, and wave heights as well as the regional navigation lane to the east of the bay turned out to be the main controlling factors for farm siting in the bay.
Figure 2 shows the areas found suitable for installation and operation of floating net cages in Pegametan Bay (green colors). The locations of the 30 operating fish farms in 2015 are also shown in the figure. Most farms are positioned within the green areas identified as suitable for marine finfish farming, reflecting the experience of fish farmers and planners. There are only six traditional farms along the western channel that are located outside suitable areas (see farms numbered 5, 6, 7, 10, 11, and 12 in Figure 2). Validation of the predictions was performed based on on-site fish health assessments at several fish farms in the bay. It was found that the mispositioned farms, in particular the larger traditional farms numbered 10, 11, and 12, were subjected to higher risks of diseases, and fish growth there was generally lower than in those farms positioned within suitable areas. Areas within the bay suitable for expansion of the activity were also identified with the SS method (see dashed green areas in Figure 2). Reallocation of the mispositioned farms to suitable areas was recommended to the local authorities [29]. Maps of water depths as well as current velocities and waves elucidating the typical conditions of the site in Bali were provided to the Indonesian authorities to help with the reallocation of the fish farms. Fish farmers were encouraged to set up farms in locations of higher flushing to ensure maximum dispersion of the effluents from the fish farms.
Ecological Carrying Capacity at Farm-Level
Estimation of the ecological carrying capacity of the 30 fish farms in operation in 2015 was carried out using the PCC method [30]. The method employs a simple non-dimensional relationship for estimating permissible cage depths for given stocking densities of fish farms or vice-versa. The relationship relates the ratio of deposited to emitted organic matter from individual fish farms, the hydrodynamic character of the fish farming location, and the characteristic settling velocity of the emitted particulates. A site-specific correction coefficient was introduced to account for the simplifications and assumptions made in the derivation of the empirical equation and the uncertainties in the selection of the input data used in the predictions. The latter was determined using the results of the on-site assessments of the sediment conditions underneath fish farms [31]. In this study the PCC method was applied to the site in Bali considering the same input parameters and correction coefficient adopted in former investigations [30]. The values listed in Table 2 were used in the predictions.
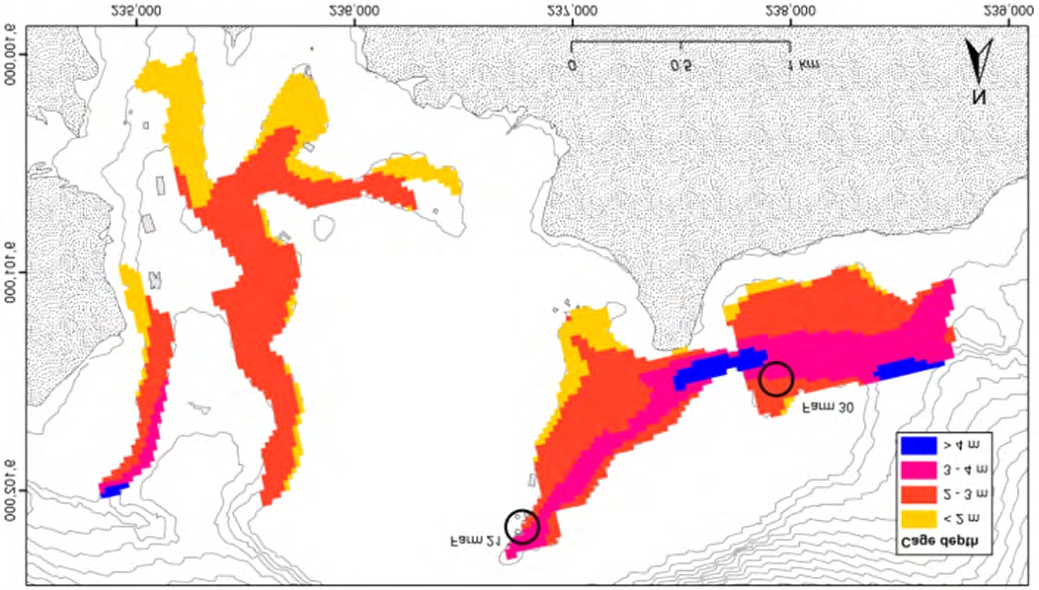
Figure 5 shows the predicted permissible cage depths of fish farms for cultivation of grouper in Pegametan Bay
for stocking densities equal to 20 kg/m3. Values are shown only for the areas in the bay identified as suitable for marine finfish cage aquaculture (Figure 2). Cage depths should not exceed about 3-4 m to ensure environmentally sustainable operations, as seen from the analysis of the results (Figure 5). This indicates that although most of the areas are well- suited for cultivation of grouper with traditional cage fish farms, they are unable to hold fish farms operating with stocking densities > ca. 20 kg/m3 in conjunction with cage depths > ca. 3-4 m. The results showed that attention should be paid to the large-scale commercial farm clusters 21 and 30 on the eastern channel of the bay (Figure 2). Since both farms deploy circular cages with cage depths of 6-7 m and stocking densities are up to ca. 30 kg/m3, they have been operating far beyond their ecological carrying capacity.
Confirmation of the PCC predictions was obtained through a detailed on-situ appraisal of sediment quality under the larger farms in the bay [31]. Results of the assessment turned out to be in good agreement with the predictions. It was found that sediment quality under most of the traditional fish farms with cage depths ≤ approximately 3 m and operating with stocking densities ≤ 20 kg/m3 was widely comparable to those measured at reference undisturbed locations. In contrast, surplus fish production in the two large-scale commercial farm clusters with cage depths of ca. 6-7 m and stocking densities of approximately 25-30 kg/m3 caused significant waste accumulation. It was recommended that the responsible authorities significantly reduce fish production in the farm clusters 21 and 30 according to the assessment results. Since fish production in these two farms is very high, reduction of cage depths and stocking densities is essential for keeping the total amount of fish within the carrying capacity of the environment. A regular monitoring program of sediment quality was established for the aquaculture site to safeguard it from adverse effects. The farms currently being monitored for sediment quality are shown in Figure 2 (see farms numbered in red). Further details on sediment monitoring are given by Runte, et al. [31].
Ecological Carrying Capacity and Assimilative Capacity at System-Scale
The method introduced in this study for estimating ECC and assimilative capacity at the system-scale was applied to the assessment of the maximum allowable fish production of the aquaculture site. Predictions were based primarily on the results of the three-dimensional model simulations of organic loading due to multiple fish farms. Emphasis was given to the selection of worst-case conditions to obtain conservative estimates of carrying capacities. Since the observed background nutrient concentrations of the site in Bali were very low, a lot of attention was paid to the hydrodynamic conditions leading to the maximum concentrations within the site, regardless of the season.
Two periods of about two weeks were selected for conducting the investigations, viz., a period in January 2008 in the rainy season, defined as Scenario A, and a second period in September 2012 towards the end of the dry season, defined as Scenario B. Table 1 lists the main environmental settings of the two scenarios. ECC was estimated considering all the 30 fish farms operating simultaneously at full capacity. Stocking densities of 20 kg/m3 and 30 kg/m3 were used respectively for the 28 traditional fish farms used primarily for cultivation of grouper and the two large-scale commercial farm clusters cultivating Asian seabass. Fish farming emissions were calculated considering fish farming sizes and stocking densities as well as typical operating conditions for the cultivated species. The parameter values adopted in the predictions are listed in Table 2.
| Scenario (season) | Period | Tidal range (m) | Background nutrient concentration (µg/l) | Water temperature (°C) | Dissolved oxygen (%) | |
|---|---|---|---|---|---|---|
| Ammonia | Nitrate | |||||
| A (wet) | Jan 6 to 20, 2008 | 0.7-1.8 | 8.4 | 9.2 | 28.6 | 5.8 |
| B (dry) | Sep 12 to 25, 2012 | 1.0-1.3 | 1 | 2.4 | 27.8 | 6.4 |
Table 1: Overview of the on-site data used in the ECC predictions.
| Parameter | Fish species | Source of data | ||
|---|---|---|---|---|
| Grouper | Seabass | |||
| Daily feeding rates pellets (%) | 0.8-1.0 | 0.8-1.0 | Sim, et al. [51] | |
| Proportion of wasted feed pellets (%) | 24 | 38 | Chu [52] Brigolin, et al. [53] | |
| Percentage of C in pellets (%) | 48 | 48 | Alongi, et al. [53] | |
| Proportion of C excreted as feces (%) | 21 | 10 | Lupatsch [55], Brigolin, et al. [55,53] | |
| Falling velocity (m/s) | Feces | 0.001-0.005 | 0.001-0.005 | Brigolin, et al. [53] |
| Pellets | 0.04-0.05 | 0.07-0.10 | Chu [52], Piedecausa, et al. [56] |
Table 2: Parameter values used for estimation of the fish farming emissions.
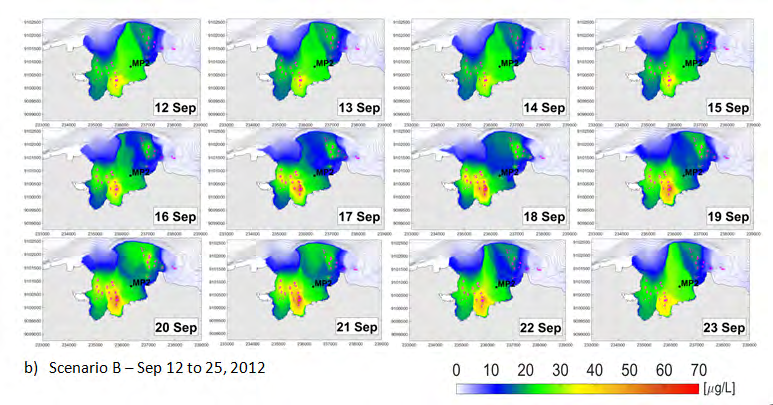
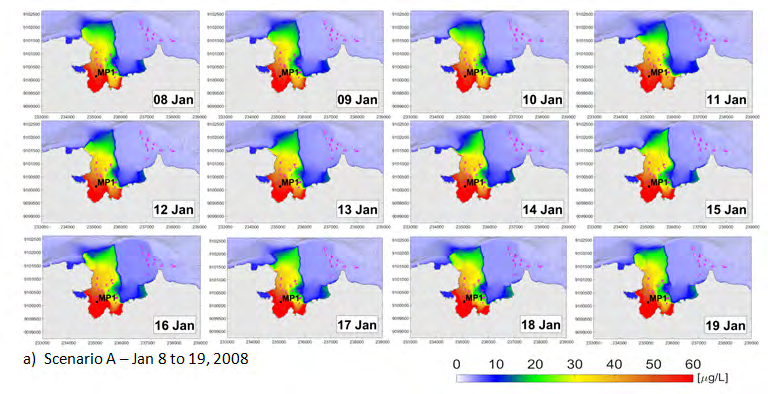
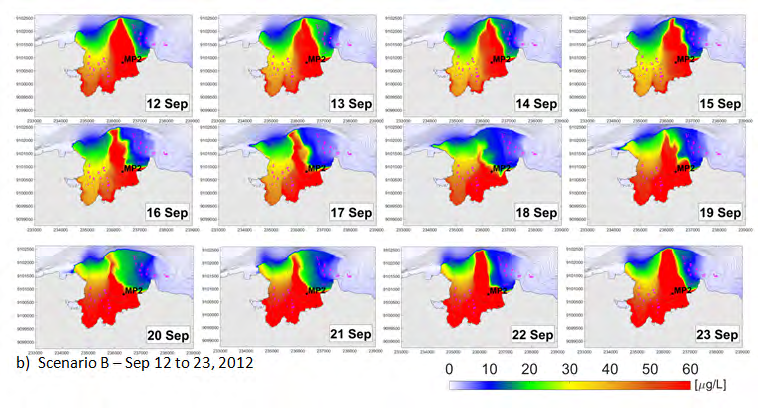
Figures 6 & 7 show the modeled spatial variation of the cumulative concentrations respectively of ammoniaad nitrate in Pegametan Bay for the two scenarios. Simulations covered the periods listed in Table 1 considering all the fish farms operating simultaneously at full capacity. In the interest of compactness only one snap shot of the results per day is shown in the Figures. Despite of the significant differences in tidal ranges between the two periods, the analysis of the results showed that the central coral reef platform naturally hinders the exchange of nutrients between the eastern and western channels. This is clearly the case for Scenario A with higher tidal ranges and thus more intensive flushing rates but it is also observed in Scenario B. Ammonia cumulative concentrations were up to about 30-40 µg/l, whereas nutrient cumulative concentrations exceeded 70 µg/l. In general, modelled nutrient concentrations were higher along the western parts of the bay. Since this channel ends at the coastline, it brings a reduction in the flushing rates leading to higher nutrient concentrations in the area. In particular, the regions at the end of the western channel near the coast and on the central coral reef platform were exposed to higher cumulative nutrient concentrations in both periods. On the other hand, nutrient concentrations in the eastern channel were much lower due to higher flushing rates. As the channel is open to the Bali Sea on both ends there is a continuous flushing in the channel. This is particularly true for Scenario A, but also observed for Scenario B (Figures 6 & 7). It is interesting to notice that although there is variation in the nutrient concentration values, the location of the hotspots, i.e. regions of higher cumulative nutrient concentrations within the site for ammonia and nitrate, remained roughly unchanged throughout the two simulated periods.
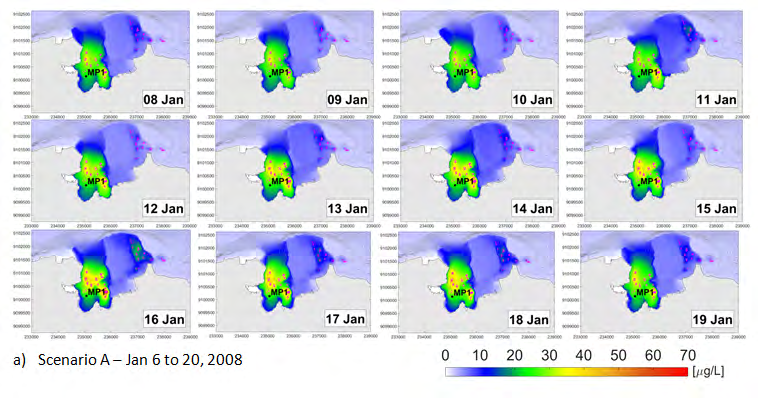
Figures 8 & 9 show respectively the spatial variation of current velocities and cumulative concentrations of ammonia and nitrate due to the emissions from multiple fish farms over a tidal cycle of the two simulated periods. There were considerable differences in the tidal ranges and thus in the current velocity magnitude and circulation patterns, which reflected in the variation of nutrient concentrations in the bay. On the other hand, the nutrient concentrations do not show much variation during the tidal cycle. It was found that despite the larger fish farms and thus higher emissions in the eastern channel, nutrient cumulative concentrations were almost entirely flushed out of the channel into the Bali Sea due to the higher tidal ranges in Scenario A (Figures 8a & 9a). As a result, higher nutrient concentrations were observed mainly in the western part of the bay. On the other hand, cumulative nutrient concentrations were spread over vast areas in Scenario B due to the moderate tidal ranges, covering at times the entire western channel, the central coral reef platform, and parts of the eastern channel during some stages of the tidal cycles (see Figures 8b & 9b).
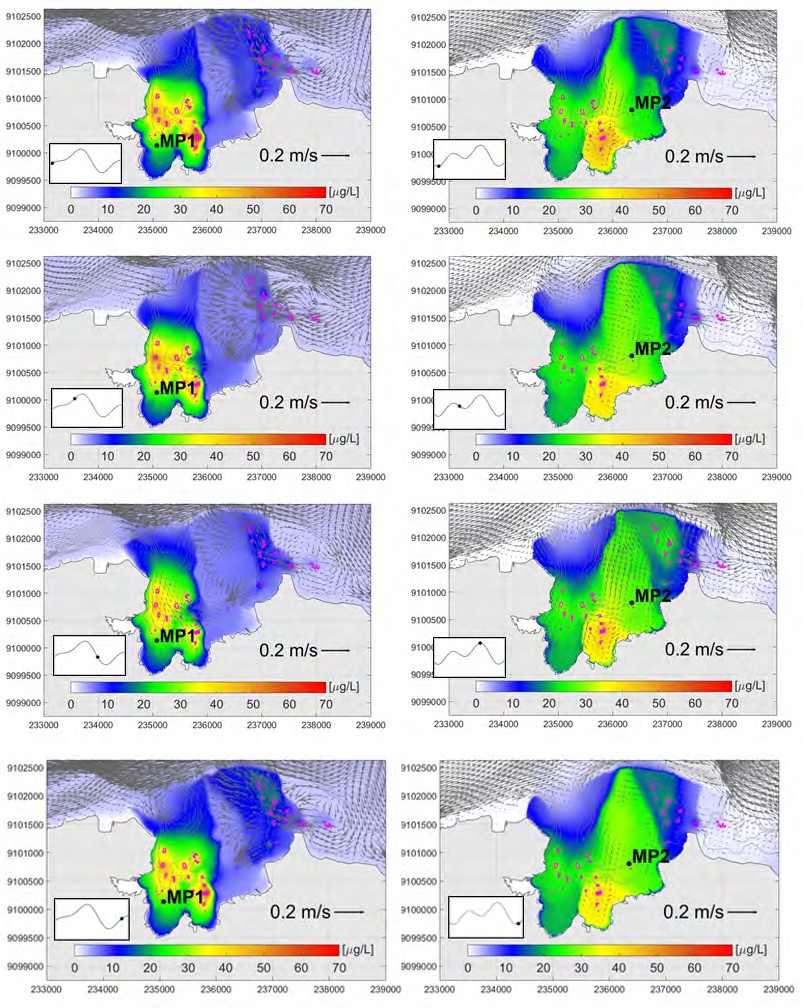
a) Scenario A b) Scenario B Figure 8: Spatial variation of current velocities and cumulative nutrient concentrations of ammonia due to the emissions from multiple fish farms over a simulated tidal cycle for Scenarios A and B in Pegametan Bay
![Figure 11: The results showed that C accumulation on the seafloor is generally restricted to the near vicinity of the fish farms, and accumulation rates are higher along the eastern channel. It is worth noticing that the footprint of organic enrichment was within the acceptable limits of about 5 gC/m2d under most traditional fish farms with cage depths of 3 m; however, the footprint was much more significant under the large-scale commercial farm clusters (see farms numbered 21 and 30 in Figure 11), and the rates of C accumulation exceeded the threshold value notably (Figure 11). The results obtained in the present study agree with the PCC predictions by Mayerle, et al. [29] and the on-site assessments conducted by Runte, et al. [30]. In general, C accumulation was more pronounced beneath the farm cluster 30 since current velocities there were slightly lower than those at the farm cluster 21. Due to the lower flushing rates in September 2012, the C accumulation rates during this period were slightly higher compared to the conditions in January 2008.](/fulltextimages/7994/fig_11.jpeg)
a) Scenario A b) Scenario B Figure 9: Spatial variation of current velocities and cumulative nutrient concentrations of nitrate due to the emissions from multiple fish farms over a simulated tidal cycle for Scenarios A and B in Pegametan Bay.
Altogether nine monitoring points (MPs) were placed over the aquaculture site according to the analysis of the modelled nutrient concentrations. The selection of the MPs was done by identifying from the model results locations with high cumulative nutrient concentrations. ECC was determined with dose-response curves of the modelled nutrient concentrations against increasing production level scenarios of the aquaculture site at the MPs. The analysis covered all the MPs. Only the results from MP1 and MP2 leading to the highest cumulative nutrient concentrations and thus ECC are presented in this paper in the interest of compactness. The location of MP1 and MP2 is shown in Figures 8&9. MP1 located at the end of the western channel at a water depth of ca. 17 m was selected for Scenario A, and MP2 placed on the central coral reef platform at a water depth of about 10.5 m was selected for Scenario B.
Figure 10 shows the dose-response curves for MP1 and MP2. The plots depict the modelled cumulative nutrient concentrations at the two MPs for 10, 25, 50, 75, and 100
percent of the capacity of the fish farms, corresponding to the total fish biomasses equal to 340, 850, 1,700, 2,560, and 3,400 metric tonnes, respectively. The modelled maximum and minimum cumulative nutrient concentrations over the simulated periods were plotted against the corresponding farming loads (see black dots in the Figures). Values were interpolated to provide continuous variation of the nutrient concentrations with the production levels. The threshold values for ammonia (70 µg/l) and nitrate (60 µg/l) to facilitate the estimation of ECC as specified by the ASEAN [35] are also shown in the diagrams (see dashed lines).
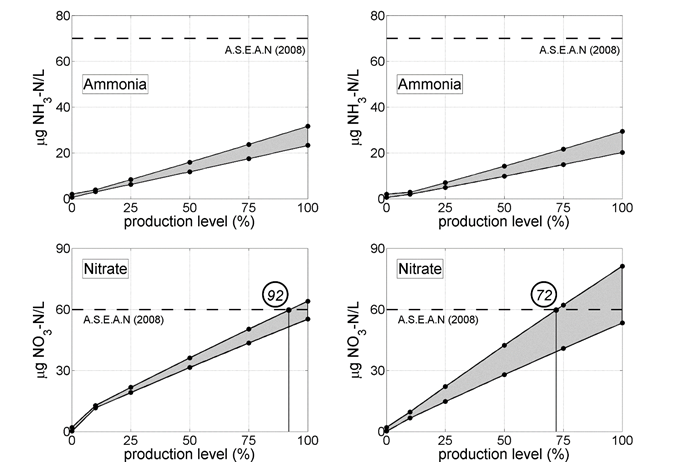
a) MP1 - Scenario A b) MP2 - Scenario B Figure 10: Dose-response curves of cumulative nutrient concentrations vs. production levels due to multiple fish farms at the selected monitoring points for Scenarios A and B in Pegametan Bay.
The results showed that the maximum concentrations of ammonia at the monitoring points were considerably lower than the threshold value established by ASEAN (2008) even with all the fish farms operating simultaneously at full capacity (see top plots in Figure 10). However, the maximum nitrate concentrations exceeded the threshold value for higher farming loads in both scenarios (see bottom plots in Figure 10). This indicates that the levels of nitrate concentrations are the limiting factor for the ECC at the site in Bali. Since nitrate concentrations for Scenario B were higher, they were considered for determining ECC at the site in Bali. According to the predictions, about 72 percent of the total fish farm load must not be exceeded in the site to guarantee that the cumulative nitrate concentrations remain below the stipulated threshold (see Figure 10b-bottom). This means that the standing stock at the aquaculture site in Bali must be lower than about 2,450 metric tonnes to ensure environmentally safe operations.
Since the production output in the site in Bali between 2016 and 2020 was up to about 1100 metric tonnes and harvest for the cultivated species usually takes place twice a year, according to the predictions the actual fish production could be increased considerably without harming the environment. This is supported by the fact that all the 30 fish farms would hardly operate simultaneously at full capacity as considered in the predictions. However, given the available areas for expansion, particularly in regions of higher flushing to the east of the bay (Figure 2), there is considerable room for increasing fish production in the site in Bali. Nevertheless, the authorities were recommended to ensure that monitoring of water quality is carried out at regular time intervals. The western parts of the bay need more attention and no further farm installations should be allowed there; in particular, the regions at the end of the western channel and on the central coral reef platform between the two tidal channels should be monitored regularly prior to harvest.
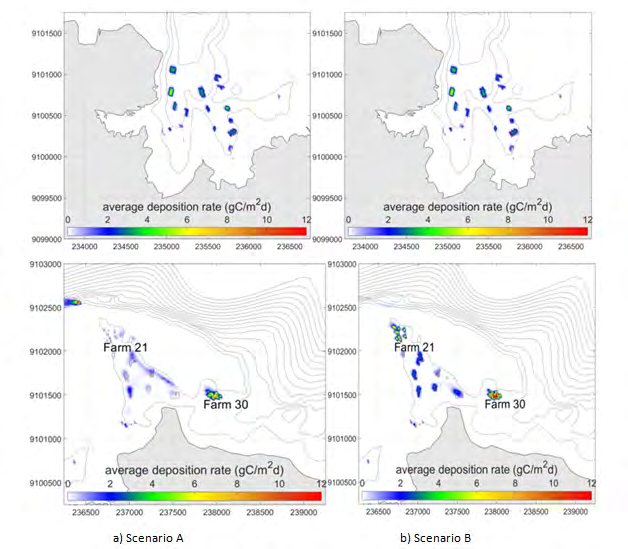
In addition to the ECC at the system-scale, the assimilative capacity of the site in Bali was investigated. The dynamic model for simulation of organic loading was applied to predict the risk of C accumulation on the seafloor due to multiple fish farms. Simulations were done for the same scenarios listed in Table 1. The sizes of the fish farms, the cultivated species, and the stocking densities were taken into consideration during estimation of the solid emissions from the fish farms. The parameter values used in the simulations are listed in Table 2. The dynamic model was optimized using the results of the on-site appraisals of sediment quality underneath fish farms to improve model predictions [30]. This was done by matching the predicted rate of C to the threshold value of C load on the seafloor at fish farms experiencing first signs of deterioration [29]. The predicted footprints due to multiple fish farms for the two scenarios are displayed in Figure 11.
The results showed that C accumulation on the seafloor is generally restricted to the near vicinity of the fish farms, and accumulation rates are higher along the eastern channel. It is worth noticing that the footprint of organic enrichment was within the acceptable limits of about 5 gC/m2d under most traditional fish farms with cage depths of 3 m; however, the footprint was much more significant under the large-scale commercial farm clusters (see farms numbered 21 and 30 in Figure 11), and the rates of C accumulation exceeded the threshold value notably (Figure 11). The results obtained in the present study agree with the PCC predictions by Mayerle, et al. [29] and the on-site assessments conducted by Runte, et al. [30]. In general, C accumulation was more pronounced beneath the farm cluster 30 since current velocities there were slightly lower than those at the farm cluster 21. Due to the lower flushing rates in September 2012, the C accumulation rates during this period were slightly higher compared to the conditions in January 2008.
Conclusion
A simple and generally applicable method was developed in the context of the EAA for estimating ecological carrying capacity and assimilative capacity of coastal finfish aquaculture sites in Southeast Asia and potentially other data-poor island nations at the system-scale. The ECC method relies primarily on results of dynamic models for simulation of organic loading due to multiple fish farms. The selection of environmental scenarios and locations leading to the highest cumulative nutrient concentrations is emphasized. Periods with low tides and low flushing rates in conjunction with high background nutrient concentrations typical to rainy seasons should be particularly foreseen for conducting the assessments. The ECC method was integrated within a methodology under development at Kiel University
to holistically define suitable locations, evaluate ecological carrying capacities, and siting of fish farms. Since predictions rely primarily on results from dynamic models developed essentially with data from available databases and global oceanic models, it can be easily upscaled to other aquaculture sites.
The effectiveness of the methodology was demonstrated for a target aquaculture site in the northwest of Bali in Indonesia in the present study. Results of the assessment have helped to identify farms located outside suitable areas and those operating beyond their ecological carrying capacity. It was found that there are six traditional farms on the western channel located outside suitable regions, and that the two large-scale commercial farm clusters on the eastern channel are operating far beyond their production carrying capacities, significantly impacting the seafloor sediments. The ecologically sustainable standing stock of the aquaculture site was also determined. Since the current production output of the site in Bali is much lower than the limits established by the applicable water quality standards, the overall fish production of the site in Bali could be increased considerably without harming the environment. Recommendations to ensure environmental sustainability include relocation of the mispositioned fish farms to suitable areas, reduction of fish production of the two large- scale commercial farm clusters and no additional farming installations on the western channel. The operational early warning monitoring currently in place is being supplemented with a cost-effective sediment monitoring strategy and monitoring of water quality in the aquaculture area to promote environmentally safe operations.
The results of this study show that the proposed methodology has wide applicability and can be easily adapted to other aquaculture sites. It can deliver reliable and straightforward assessments in the early stages of investigating a site for its aquaculture potential. The methodology is currently being upscaled to several target coastal sites selected by the Indonesian Government for expansion of aquaculture activity. We expect that it will facilitate the analysis and planning of potential sites in pristine regions and enable the assessment and optimization of currently operating aquaculture sites.
Acknowledgments
The authors wish to thank the German Ministry of Education and Research (BMBF) and the Indonesia Ministry of Marine Affairs and Fisheries for funding the SPICE project (Funding numbers 03F0393A and 03F0469A) from 2003 to 2011. The support and cooperation of the Gondol Research Institute for Mariculture of the Ministry of Marine Affairs and Fisheries (MMAF) in Bali, Indonesia, and the Research and Technology Centre Westcoast of the University of Kiel in Buesum, Germany, throughout the project is highly appreciated.
References
-
FAO (2016) The State of World Fisheries and Aquaculture 2016. Contributing to Food Security and Nutrition to All. Rome, pp: 1-204.
-
FAO (2018) The State of World Fisheries and Aquaculture 2018 - Meeting the sustainable development goals. Rome, pp: 1-227.
-
World Bank (2013) Fish to 2030: Prospects for fisheries and aquaculture. Washington, DC: World Bank Group, pp: 1-102.
-
FAIRR, 2019. Shallow Returns? ESG Risks and Opportunities in Aquaculture, pp: 1-75.
-
Bone J, Clavelle T, Ferreira JG, Grant J, Ladner I, et al. (2018) Best Practices for Aquaculture management, Guidance for implementingthe ecosystem approach in Indonesia and beyond. Conservation International and the Sustainable Fisheries Partnership.
-
Mayerle R, Sugama K, Hesse K, Lehner S, Pramono G, et al. (2018) Spatial technologies for early warning and preparedness of marine fish cage culture in Indonesia. In: Aguilar-Manjarrez J (Ed.), Guidance on spatial technologies for disaster risk management in aquaculture, pp: 227-297.
-
Soto D, Aguilar-Manjarrez J, Hishamunda N (2008) Building an ecosystem approach to aquaculture. FAO/ Universitat de les Illes Balears Expert Workshop. 7-11 May 2007, Palma de Mallorca, Spain. FAO Fisheries and Aquaculture Proceedings, pp: 221.
-
FAO (2010) Aquaculture development. 4. Ecosystem approach to aquaculture. FAO Technical Guidelines for Responsible Fisheries 5(4): 1-68.
-
Brugère C, Aguilar-Manjarrez J, Beveridge M, Soto D (2018) The Ecosystem Approach to Aquaculture 10 Years on - a Critical Review and Consideration of Its Future Role in Blue Growth. Reviews in Aquaculture 11(3): 493-514.
-
Aguilar Manjarrez J, Soto D, Brummett R (2017) Aquaculture zoning, site selection and area management under the ecosystem approach to aquaculture. FAO, pp: 1-408.
-
Corner RA, Aguilar-Manjarrez J (2017) Tools and Models for Aquaculture Zoning, Site Selection and Area Management. In: Aguilar-Manjarre J, et al. (Eds.), Aquaculture zoning, site selection and area management under the ecosystem approach to aquaculture, pp: 95- 145.
-
Cromey CJ, Nickell TD, Black KD (2002) DEPOMOD- Modeling the deposition and biological effects of waste solids from marine cage farms. Aquaculture 214(1-4): 211-239.
-
Ferreira JG, Grant J, Verner-Jeffreys DW, Taylor NGH (2013) Carrying capacity for aquaculture, modeling frameworks for determination of. In: Christou, P, et al. (Eds.), Sustainable food production: Selected entries from the Encyclopaedia of Sustainability Science and Technology, pp: 417-448.
-
Symonds AM (2011) A comparison between far-field and near field dispersion modeling of fish farm particulate wastes. Aquaculture Research 42(sup1): 73-85.
-
Grant J Filgueira R (2011) The application of dynamic modeling to prediction of production carrying capacity in shellfish farming. In: Shumway SE (Ed.), Aquaculture and the environment, pp: 135-154.
-
Byron CJ, Costa-Pierce BA (2013) Carrying capacity tools for use in the implementation of an ecosystems approach to aquaculture. In: Ross LG, et al. (Eds.), Site selection and carrying capacities for inland and coastal aquaculture, pp: 87-101.
-
Filgueira R, Comeau LA, Guyondet T, McKindsey CW, Byron CJ (2015) Modeling Carrying Capacity of Bivalve Aquaculture: A Review of Definitions and Methods. In: Meyers R (Eds.), Encyclopedia of Sustainability Science and Technology, pp: 10-17.
-
Tironi A, Marin VH, Campuzano J (2010) A management tool for assessing aquaculture environmental impacts in Chilean Patagonian fjords: integrating hydrodynamic and pellets dispersion models. Environmental Management 45(5): 953-962.
-
Peran AI, Campuzano FJ, Senabre T, Mateus M, Gutiérrez JM, et al. (2013) Modeling the environmental and productive carrying capacity of a great scale aquaculture park in the Mediterranean coast and its implications. In: Mateus M, et al. (Eds.), Ocean modeling for coastal management-case studies with MOHID, pp: 249-265.
-
Skogen MD, Eknes M, Asplin LC, Sandvik AD (2009) Modeling the environmental effects of fish farming in a Norwegian fjord. Aquaculture 298(1-2): 70-75.
-
Kiefer DA, Rensel JE, OBrien FJ, Fredriksson DW, Irish J (2011) An Ecosystem Design for Marine Aquaculture Site Selection and Operation NOAA Marine Aquaculture Initiative Program, Final Report. Award Number: NA08OAR4170859. System Science Applications, pp: 181.
-
Rensel JE, Kiefer DA, OBrien FJ (2013) Initial Study of Potential Fish Mariculture near the United Arab Emirates East Coast with AquaModel software. In: Donald A (Eds.), Woods Hole Oceanographic Institution and the United Arab Emirates, Ministry of Environment and Water, pp: 1-83.
-
Rensel JE, OBrien FJ, Siegrist Z, Kiefer DA (2015) Tropical-Open Ocean Aquaculture Modeling: AquaModel Tunning and Validation. In: Alan A (Eds.), National Marine Fisheries Service, pp: 1-75.
-
Inglis GJ, Hayden BJ, Ross AH (2000) An overview of factors affecting the carrying capacity of coastal embayments for mussel culture. NIWA Client Report, pp: 1-38.
-
McKindsey CW, Thetmeyer H, Landry T, Silvert W (2006) Review of recent carrying capacity models for bivalve culture and recommendations for research and management. Aquaculture 26 (2): 451-462.
-
Gacek S, Legović T (2010) Towards carrying capacity assessment for aquaculture in the Bolinao Bay, Philippines: a numerical study of tidal circulation. Ecological Modelling 221(10): 1394-1412.
-
Ross LG, Telfer TC, Falconer L, Soto D, Aguilar-Manjarrez J (2013) Site selection and carrying capacities for inland and coastal aquaculture. In: Ross LG, (Eds.), FAO, pp: 1-59.
-
Windupranata W, Mayerle R (2009) Decision support system for selection of suitable mariculture site in the Western Part of Java Sea, Indonesia. ITB J Eng Science 41(1): 77-96.
-
Mayerle R, Sugama K, Runte KH, Radiarta N, Vallejo SM (2017) Spatial planning of marine finfish aquaculture facilities in Indonesia. In Aguilar-Manjarrez J, et al. (Eds.), Aquaculture zoning, site selection and area management under the ecosystem approach to aquaculture, pp: 222- 252.
-
Mayerle R, Niederndorfer KR, Fernandez Jaramillo JM, Runte KH (2020) Hydrodynamic method for estimating production carrying capacity of coastal finfish cage aquaculture in Southeast Asia. Aquaculture Engineering 88: 102038.
-
Runte KH, Mayerle R, Sugama K (2021) Monitoring strategy for analyzing the impacts of coastal finfish aquaculture on seafloor sediments in Indonesia. Int J Oceanogr Aquac 5(1): 1-11.
-
Mayerle R, Sugama K, van der Wulp S, Poerbandono, Runte KH (2022) Decision tool for assessing marine finfish aquaculture sites in Southeast Asia. In: Jennerjahn, T, et al. (Eds.), Science for the Protection of Indonesian Coastal Ecosystems, pp: 371-387.
-
Gillibrand PA, Gubbins MJ, Greathead C, Davies IM (2002) Scottish Executive Locational Guidelines for fish farming: predicted levels of nutrient enhancement and benthic impact. Scottish Fisheries Research, pp: 63.
-
Tett P, Portilla E, Gillibrand PA, Inall M (2011) Carrying and assimilative capacities: the ACExR LESV model for sea-loch aquaculture. Aquac Res 42(1): 51-67.
-
Secretariat ASEAN (2008) ASEAN Marine Water Quality Management Guidelines and Monitoring Manual. Australia Marine Science and Technology Ltd, pp: 1-444.
-
Brown ME, Kraus NC (2007) Tips for Developing Bathymetry Grids for Coastal Modeling System Applications, ERDC/CHL, CHETN-IV-69, pp: 1-16.
-
Walstra DJR, van Rijn LC, Blogg H, van Ormondt M (2001) Evaluation of a hydrodynamic area model on the Coast3D Data at Teignmouth 1999. Paper D4 of COAST3D Final Volume of Summary Papers, pp: D 4.1-D 4.4.
-
Kalnay E, Kanamitsu M, Kistler R, Collins W, Deaven D, et al. (1996) The NCEP/NCAR 40-year reanalysis project, Bull. Amer. Meteor. Soc. 77(3): 437-470.
-
Google earth pro V 7.3.2.5776 (September 17, 2014). Pegametan Bay, Bali, Indonesia. 8.130237° S 114.599764° E. Eye alt. 7000 m. CNES/Airbus 2019, DigitalGlobe 2019.
-
(BPS) Badan Pusat Statistik - Statistics Indonesia (2019) Buleleng regency in figures 2019. BPS-Statistics of Buleleng Regency, Bali, pp: 782.
-
(BPS) Badan Pusat Statistik - Statistics Indonesia (2020) Buleleng regency in figures 2020. BPS-Statistics of Buleleng Regency, Bali, pp 244.
-
(BPS) Badan Pusat Statistik - Statistics Indonesia (2021) Buleleng regency in figures 2021. BPS-Statistics of Buleleng Regency, Bali, pp 266.
-
Deltares (2014b) Delft3D-Water Quality user manual, Delft, pp: 1-414.
-
IOC, IHO, BODC (2003) Centenary Edition of the GEBCO Digital Atlas, Brtish Oceanographic Data centre, pp: 1-2.
-
Egbert GD, Erofeeva SY (2002) Efficient Inverse modeling of barotropic ocean tides. J Atmo Ocean Technol 19(2): 183-204.
-
Niederndorfer KR (2017). Proposal of a practical method to estimate the ecological carrying capacity for finfish mariculture with respect to particulate carbon deposition to the sea floor. PhD Thesis. Christian Albrechts University Kiel.
-
Deltares (2014a) Delft3D. Delft, Netherlands, pp: 1-710.
-
Løland G (1993) Current forces on, and water flow through and around, floating fish farms. Aquac Int 1(1): 72-89.
-
Lader PF, Enerhaug B (2005) Experimental investigation of forces and geometry of a net cage in uniform flow. IEEE J Ocean Eng 30(1): 79-84.
-
Kristiansen T Faltinsen OM (2012) Modeling of current loads on aquaculture net cages. J Fluids Struct 34: 218- 235.
-
Sim SY, Rimmer MA, Toledo JD, Sugama K, Rumengan I, et al. (2005) Practical Guide to Feeds and Feed Management for Cultured Groupers. NACA, pp: 18.
-
Chu JCW (2002) Environmental management of mariculture: the effect of feed types on feed waste. In: APEC, et al. (Eds.), Report of the Regional Workshop on Sustainable Seafarming and Grouper Aquaculture, pp: 1-6.
-
Brigolin D, Meccia VL, Venier C, Tomassetti P, Porrello S, et al. (2014) Modeling biogeochemical fluxes across a Mediterranean fish cage farm. Aquac. Environ. Interact. 5 (1): 71-88.
-
Alongi DM, McKinnon AD, Brinkman R, Trott LA, Undu MC, et al. (2009) the fate of organic matter derived from small-scale fish cage aquaculture in coastal waters of Sulawesi and Sumatra, Indones. Aquaculture 2(1-2): 60- 75.
-
Lupatsch I (2009) Quantifying nutritional requirements in aquaculture - the factorial approach. In: Burnell G, et al. (Eds.), New Technologies in Aquaculture: Improving Production Efficiency, Quality and Environmental Management, pp: 417-439.
-
Piedecausa MA, Aguado-Giménez F, Garcia Garcia B, Telfer T (2009) Settling velocity and total ammonia nitrogen leaching from commercial feed and faecal pellets of gilthead seabream (Sparus aurata L. 1758) and seabass (Dicentrarchus labrax L. 1758). Aquac Res 40: 1703-1714.
- Genetic Improvement of Nile Tilapia (Oreochromis niloticus): Advances in Selective Breeding and Genomic Approaches for Sustainable Aquaculture
- Microplastics, Contaminants, and Waste Hotspots: Divergences and Faults in Prioritizing Control Efforts
- Creating a Healthier, More Vibrant Open and Closed Aquatic Environment. A Submersible, Centrifugal Magnetically Affixed Current Changing Aquarium Pump
- An Attempt to Assess Alpha Diversity and Sample Size: Using the Ostracod Assemblages off Kumamoto Port, Japan
- Assessment of the Efficiency of Common Fishing Gears and Crafts Used at Mohananda River of Chapai Nawabganj, Bangladesh
- Fish Productivity and Biodiversity Status of Sundarban Mangrove in Bangladesh