Background Contribution to Assess the Trophic Water Conditions and Organic Components in Sediments at Santos and Cananeia Estuarine Systems-Brazil
The dissolved inorganic compounds are normally used to identify the water quality of the coastal ecosystems. In the last decades, the dissolved organic compounds acquired a new dimension, in the water and in the sediments, due to its important role in the biogeochemical cycle of the organic matter. Concerning it, proteins, carbohydrates and lipids present on the sediments could be used in order to access the environmental trophic state. In this study, water properties and organic matter compounds in sediments were used in order to verify the trophic condition once it is a rare data from these regions. Although the PCA groupings are based on specific variables, such as water and sediment parameters, two specific groups were observed in both cases (a and b). Group a suggests stations with eutrophication tendency or, based on sediment variables, in hypertrophic condition, while Group b suggests areas in healthier conditions as meso-oligotrophic environments. Similarities on grouping based on water and sediment parameters were observed. The study of coupling water and sediment properties (pelagic and benthic coupling) and organic compounds constitute an important focus for improving the access to the trophic state avoiding the evaluation based only on sediment parameters that could cause more incertitude.
Introduction
Eutrophication is known as the accelerated production of organic matter in a water body linked to an increase in nutrients, in particular nitrogen and phosphorus, representing a serious threat to the ecology of freshwater, estuarine and coastal systems [1]. Nutrient enrichment generates two primary interrelated effects in aquatic ecosystems. First in the pelagic zone, the stimulation of phytoplankton growth and in some cases a change in phytoplankton species composition with blooms of opportunistic and even harmful species. Second in the benthic zone, shading and deposition of organic matter [2] as observed by Dell Anno A, et al. [3].
Phytopigment concentrations in the sediment are a tracer of the amount of organic matter produced by photosynthesis, so that chlorophyll-a content can be used as a descriptor of the trophic state and productivity of most estuarine and shallow coastal systems [4, 5, 6, 7] and most recently in Brazil in a polluted estuary by Da Costa BVM, et al. [8]. The most commonly used indicators of the trophic state of coastal and marine environments have been based on water column variables such as, turbidity, inorganic nutrients, phytoplankton abundance, biomass and primary production values [1]. However, in shallow coastal environments the intimate coupling between the pelagic and the benthic compartments promotes a relatively rapid deposition and accumulation in bottom sediments of the organic matter produced in the water column [9]. This organic enrichment is, in fact, the generating mechanism of trophic alterations of the system and their ecological consequences, such as oxygen reduction, hypoxia and biodiversity decrease [10, 11, 12], reflecting on the sediments what occurred in the water column. Nevertheless, as the direction and magnitude of ecological responses to inorganic nutrient enhancement are difficult to predict [7, 9], the analysis of the pelagic and benthic domains may provide a completely different trophic classification of the trophic state of an ecosystem [3, 13]. Therefore, both compartments should be taken into account to accurately evaluate the trophic state of a given aquatic environment.
The particulate organic detrital carbon in the sea is estimated in 300-500g/m2 and there is a transition in dissolved organic carbon, dissolved inorganic and also the life fraction [14]. This fraction, if in shallow water column presents a trend to reach the sediments before the total decomposition. Sedimentary organic matter quality and quantity are dependent on factors such as origin (allochtonous or autochthonous), sources and digenetic processes that act through the water column and in the sediments [15, 16, 17]. Eutrophic systems tend to accumulate large quantities of organic carbon] resulting in changes of organic matter biochemical composition [18, 19], and the self-purification and degradation capacity that altering the balance in aquatic system [20] being affected when the quantity and quality of the organic matter change. In addition, high amounts of low quality organic matter tend to be added to these systems, opposite to oligotrophic environments, where low quantities of high quality organic matter tend to accumulate [21, 22, 23]. Also, due to the conservative nature of organic carbon, qualitative characteristics of the sedimentary organic matter (e.g., proteins to carbohydrates ratio) could be more useful as trophic state indicators than organic matter/carbon concentrations alone [3]. Further, these authors verified that carbohydrates and proteins can be used to assess the environmental quality of aquatic ecosystems as these compounds are sensitive to distinct sources of anthropogenic impact.
High biochemical diversity in sedimentary organic matter composition can be found from place to place because organic constituents have distinct chemical and physical characteristics; so, different components accumulate or decompose in variable rates [24]. Simple sugars, proteins and lipids are the main constituents of the labile fraction of dissolved and particulate organic matter, which is rapidly degraded by bacterial activity, whereas, complex macromolecules such as humic and fulvic acids comprise the refractive fraction and are selectively preserved during diagenesis [25, 26]. Due to the multiple sources of organic matter and its uneven distribution in different sites, sometimes is difficult to discern if the loss of a specific compound is the result of its preferential degradation or its variable input [27, 28]. According to Cowie GL, et al. [29] this limitation can be solved using ubiquitous compounds such as proteins, carbohydrates and lipids, which are the major constituents of the organic material of marine and terrestrial organisms, and subsequently, of the particulate organic matter deposited on surface sediments.
Estuarine systems are zones of transition between the marine and the terrestrial environments that perform essential ecological functions including nutrient degradation and regeneration [30]. Also, they control the fluxes of nutrient, water, particles and organisms from and to the continental margins, rivers and oceans. Nowadays, the ecological and economic importance of estuaries and coastal zones in general, is recognized worldwide. They are high productive environments, which provide lot of benefits for society, and in consequence, are areas subjected to high anthropogenic pressure [31].
The two estuaries object of this study are located in the Sao Paulo State, southeastern Brazil. The Santos-Sao Vicente estuarine system is located in one of the most industrialized areas of Brazil, where petrochemical, metallurgical and fertilizer industrial activities are developed. It also holds the Santos Harbor, the largest commercial harbor of South America that needs to be periodically dredging [32]. Major contributors to the estuary degradation are probably the metallurgical plants of the Cubatao industrial complex, which is located in the inner estuary and the port movement. Previous works have demonstrated that the water and sediment close to this area present high concentrations of polycyclic aromatic hydrocarbons, PCBs and heavy metals [33, 34, 35, 36, 37]. In addition, through a submarine sewage outfall located in the Santos Bay important concentrations of linear alkylbenzenes, associated to domestic detergent contributions Medeiros, et al. [34] and petroleum hydrocarbons [38] are introduced promoting chemical and toxicological alterations. Even though, some control was established in the last years by the Brazilian government the environmental quality of the Santos-Sao Vicente estuary is still compromised [31, 35].
On the other hand, the Cananeia-Iguape estuarine- lagoon complex is an environmental protected area and was recognized as a Natural Patrimony of Humanity in 1999 by UNESCO and it is included in the Ramsar list [39] of the important wetlands. The estuary consists of channels connected with the ocean by two outlets, Cananeia (in northern estuary) and Iguape (in southern estuary) and is generally used as a reference environment due to the very low contribution of compounds derived from anthropogenic activities [32, 40]. In the past, the northern area of the estuary (Ribeira River Valley) was influenced by mining activities and nowadays the there is an influence of the phosphogypsum mining and domestic and waste waters that influence the river water reaching the northern part of the system by the Valo Grande channel, but the main economic activities of Iguape and Cananeia are tourism, fishing and oyster farm. This estuary is known as a place with high natural productivity and little human impact [16, 41, 42]. It is important to mention that the aim of this investigation is to assess the trophic state and environmental quality of the pelagic and benthic domains of these two estuarine systems subjected to contrasting anthropogenic stress using conventional water column parameters and the quality and quantity of the sedimentary organic matter. The data presented can contribute to a temporal evaluation of this aquatic system.
Material and Methods
Sampling
The sampling survey was carried out in August 2005 onboard the R/V “Albacora”. The sampling schedule included 16 stations in the Santos-Sao Vicente estuarine system (Santos from now to forward) and 13 stations in the Cananeia-Iguape estuarine-lagoon complex (Cananeia from now to forward) (Figure 1). At each station position was determine with a GPS and water depth with an ecosound. Temperature was measured with protected reversal mercury thermometers (± 0.01 ºC); while transparency was measured using a Secchi disk. Surface and bottom water samples for dissolved oxygen, pH, ammonium and salinity were collected with Hydrobios® bottles, while, samples for nutrients and photosynthetic pigments determination were collected with a Van Dorn bottle. Water samples from Hydrobios® bottles were analyzed as soon as possible and Van Dorn samples were immediately filtered. Filtration was carried out through pre-cleaned 0.45µm GF/F Whatmanâ membrane filters, which were stored in polyethylene bottles and deeply freeze in the dark until analysis. Sediment samples were collected using a steel van Veen grab. One sample was used for granulometry analysis. Other three samples were collected for photosynthetic pigments, total organic matter content and organic matter biochemical composition. Only the top layer (1st cm) of undisturbed samples were taken and kept frozen at -20 °C in pre-combusted (450-500 °C) aluminum containers (Figure1).
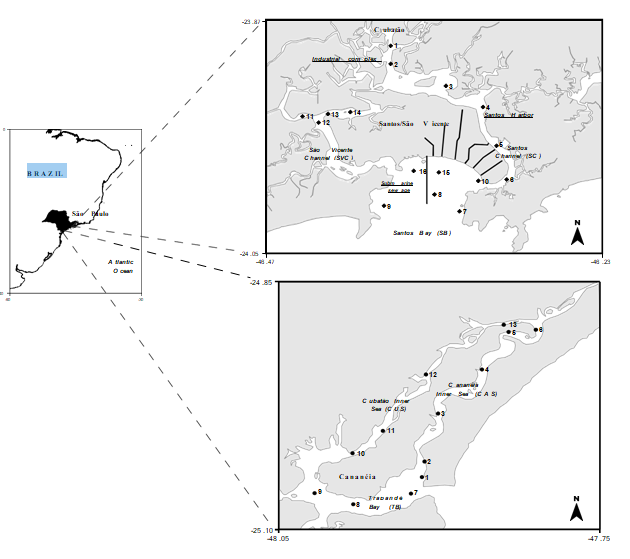
A: Santos; B: Cananeia Figure 1: Map of the two estuarine systems studied showing the sampling stations.
Analytical Methods
Dissolved oxygen (DO) was determined by the Winkler method Grasshoff, et al. [43] using a Hydrobios® kit and a Metrohm burette (± 0,02mL). pH was measured using a Orion 290A digital pHmeter (± 0,001) and salinity was determined in an Beckman RS-10® inductive salinometer. Chlorophyll-a (Chl-a) and phaeopigments (Phaeo) were extracted from frozen filters 90% acetone, vortex mixed and kept at 4 °C overnight. After incubation the samples were centrifuged at 1500 x g for 10 min and pigments determined according to Lorenzen CJ, et al. [44]. Nitrate (NO3-), nitrite (NO2-) were determined using the AutoAnalyzer II Bran- Luebbe according to Treguer P, et al. [45] and phosphate (PO4 3-) by colorimetric method as described in Grasshoff et al. [43]. Ammonium (NH4+NH3) was determined following the method describe by Le Corre P, et al. [45] and Solorzano L, et al. [46]. Total dissolved inorganic nitrogen (DIN) was also calculated as the sum of nitrate, nitrite and ammonium concentrations. Granulometric analyses of sediments were carried out by the dry sieve-pipette method as described in Suguio K [47]. Total organic matter (TOM) was determined by weight loss on ignition at 480-500 oC for 4 hours following 47 Byers C, et al. [48]. Carbonate content (CaCO3) was analysed gravimetrically as the difference between the weight of each sediment sample prior and after acid attack with 10 % HCl. Chlorophyll a (Chl-a) and phaeopigments (Phaeo) were analyzed following the method described by Lorenzen CJ, et al. [44] and modified by Sunback K, et al. [49] for marine sediments. Total proteins (PRT) were extracted in 0.5 NaOH during 4 hours and analysed following the method of Lowry OH, et al. [50] modified by Hartree EF, el al. [51] and concentrations were expressed as bovine serum albumin (BSA) equivalents. Total carbohydrates (CHO) were analysed according to the method of Gerchakov SM, et al. [52] for sediments, and concentrations expressed as glucose equivalents. For each analysis blank sediments were pre-combusted at 480-500 °C for 4 hours. Photosynthetic pigments and biochemical analysis were carried out in three replicates and data were normalized to sediment dry weight. It was used the classification proposed by Dell´Anno et al. [3] based on protein and carbohydrate concentrations and also on protein to carbohydrate ratios (PRT:CHO) to assign different trophic conditions to the sampling locations.
Statistical Analysis
Statistical analyses were carried out using Statistica 7.0 and PRIMER 6.0 packages. The Mann-Whitney non- parametric test (statistic U) was used to check for differences between surface and bottom water parameters of each estuarine system and also to check for differences between the two estuaries with respect to the variables considered. Significant level was set at α = 0.05. In order to ordinate the stations of both estuaries according to their level of eutrophication and identify the variables which act as driving forces a correlation- based Principal Component Analysis (PCA) was employed. PCAs considering the eutrophication related variables (previously normalized data) from the water column and the sediments were performed separately in order to compare the results. A one-way analysis of similarities (ANOSIM) was performed to test if the groups of stations obtained in the PCA were significant different. The Mann-Whitney test was also performed to check for differences in the eutrophication related variables between the groups formed in the PCA.
Results
Water Column Characterization
Depth of the Secchi disk in Santos varied from 1.0 m at station 1 to 2.5 m at stations 10 and 15 (Table 1).
| Santos | Cananeia | ||||||
|---|---|---|---|---|---|---|---|
| Stations | Position Lat. Long | Sampling depth (m) | Secchi depth (m) | Station | Position | Sampling depth m) | Secchi depth (m) |
| 1 | 23053.376’ | 5 | 1 | 1 | 25002.796’ | 3 | 0.7 |
| 46022.887’ | 47054.999’ | ||||||
| 2 | 23054.214 | 5 | 1.5 | 2 | 25001.854’ | 3 | 1 |
| 46022.887’ | 47054.854’ | ||||||
| 3 | 23055.228’ | 5 | 2 | 3 | 24058.950’ | 5 | 1 |
| 46020.514’ | 47054.091’ | ||||||
| 4 | 23056.210’ | 5 | 1.5 | 4 | 24056.292’ | 8 | 1.5 |
| 46018.923’ | 47051.634’ | ||||||
| 5 | 23058.005’ | 10 | 2 | 5 | 24054.030’ | 8 | 2 |
| 46018.344’ | 47050.140’ | ||||||
| 6 | 23059.566’ | 5 | 2 | 6 | 24053.886’ | 3 | 1.2 |
| 46017.912’ | 47048.610’ | ||||||
| 7 | 24001.041’ | 8 | 2 | 7 | 25003.792’ | 5 | 1 |
| 46019.935’ | 47055.614’ | ||||||
| 8 | 24000.260’ | 8 | 1.5 | 8 | 25004.434’ | 8 | 1 |
| 46021.006’ | 47058.848’ | ||||||
| 9 | 24000.781’ | 5 | 2 | 9 | 25003.762’ | 5 | 2 |
| 46023.175’ | 48001.015’ | ||||||
| 10 | 23059.624’ | 4 | 2.5 | 10 | 25001.356’ | 8 | 2 |
| 46019.125’ | 47058.888’ | ||||||
| 11 | 23056.645’ | 3 | 2 | 11 | 25000.000’ | 10 | 2 |
| 46026.675’ | 47057.190’ | ||||||
| 12 | 23056.933’ | 8 | 1.5 | 12 | 25056.592’ | 5 | 1.5 |
| 46025.980’ | 47054.769’ | ||||||
| 13 | 23056.528’ | 3 | 1.8 | 13 | 24053.586’ | 3 | 2 |
| 46025.577’ | 47050.413’ | ||||||
| 14 | 23056.441’ | 4 | 2 | ||||
| 46024.621’ | |||||||
| 15 | 23059.238’ | 5 | 2.5 | ||||
| 46020.820’ | |||||||
| 16 | 23059.166’ | 5 | 1.5 | ||||
| 46021.900’ |
Table 1: Station coordinates, sampling depth, Secchi disk depth.
Surface temperature ranged from 22.30 to 25.00 °C, whereas bottom temperature presented values between 21.21 and 24.50 °C (Table 2). Salinity in surface water varied between 23.41 and 36.41, while in bottom water varied between 27.69 and 36.95. pH showed a mean values of 7.90 and 7.94 in surface and bottom water, respectively (Table 2).
| Santos | ||||||||
|---|---|---|---|---|---|---|---|---|
| Surface | Bottom | |||||||
| Min | Max | Mean | SD | Min | Max | Mean | SD | |
| Temperature (ºC) | 22.3 | 25.00 | 23.14 | 0.81 | 21.21 | 24.50 | 22.24 | 0.83 |
| Salinity | 23.41 | 36.41 | 31.58 | 4.05 | 27.69 | 36.95 | 33.46 | 3.27 |
| pH | 7.39 | 8.34 | 7.90 | 0.29 | 7.53 | 8.25 | 7.94 | 0.28 |
| DO(mL L-1) | 3.09 | 4.57 | 4.00 | 0.65 | 3.01 | 5.23 | 3.78 | 0.64 |
| DO (% sat) | 64.72 | 126.46 | 84.70 | 15.19 | 65.68 | 111.63 | 79.58 | 14.29 |
| Ammonium (μM) | 1.73 | 23.98 | 12.83 | 6.94 | 1.62 | 24.86 | 11.18 | 8.56 |
| Nitrate (μM) | 0.03 | 2.83 | 0.59 | 0.86 | 0.08 | 1.97 | 0.47 | 0.64 |
| Nitrite (μM) | 0.05 | 9.40 | 2.28 | 3.05 | 0.03 | 8.85 | 1.97 | 2.81 |
| Phosphate (μM) | 0.57 | 16.30 | 4.88 | 4.11 | 0.55 | 7.01 | 3.67 | 2.65 |
| DIN (μM) | 1.85 | 26.13 | 15.69 | 8.50 | 1.68 | 26.70 | 13.75 | 9.85 |
| Chl-a (µg L-1) | 2.32 | 16.13 | 6.35 | 4.15 | 1.69 | 9.44 | 4.52 | 2.51 |
| Phaeo (µg L-1) | n.d. | 1.72 | 0.54 | 0.70 | n.d. | 38.31 | 4.77 | 10.06 |
| Cananéia | ||||||||
| Surface | Bottom | |||||||
| Min | Max | Mean | SD | Min | Max | Mean | SD | |
| Temperature (ºC) | 19.50 | 22.10 | 21.13 | 0.62 | 19.03 | 21.50 | 21.00 | 0.66 |
| Salinity | 13.78 | 32.65 | 25.78 | 5.11 | 14.36 | 32.98 | 26.22 | 5.08 |
| pH | 7.62 | 8.20 | 7.91 | 0.18 | 7.54 | 8.22 | 7.88 | 0.21 |
| DO(mL L-1) | 4.33 | 5.37 | 4.76 | 0.35 | 4.42 | 5.30 | 4.46 | 1.12 |
| DO (% sat) | 85.45 | 102.34 | 92.27 | 6.19 | 85.43 | 102.38 | 93.24 | 5.73 |
| Ammonium (μM) | 1.48 | 2.75 | 2.23 | 0.47 | 1.22 | 3.67 | 2.57 | 0.62 |
| Nitrate (μM) | 0.14 | 0.31 | 0.22 | 0.05 | 0.14 | 0.32 | 0.22 | 0.06 |
| Nitrite (μM) | 0.37 | 3.15 | 0.81 | 0.73 | 0.39 | 1.83 | 0.72 | 0.38 |
| Phosphate (μM) | 0.36 | 1.89 | 0.88 | 0.49 | 0.33 | 1.94 | 0.89 | 0.50 |
| DIN (μM) | 2.11 | 6.14 | 3.26 | 1.00 | 1.84 | 4.62 | 3.51 | 0.77 |
| Chl-a (µg L-1) | 1.16 | 6.24 | 3.24 | 1.44 | 1.07 | 34.48 | 6.84 | 8.60 |
| Phaeo (µg L-1) | n.d. | 6.83 | 1.82 | 1.76 | n.d. | 12.11 | 2.78 | 3.04 |
Table 2: Summary statistics for hydrological variables, nutrients and photosynthetic pigments of water samples from Santos and Ca
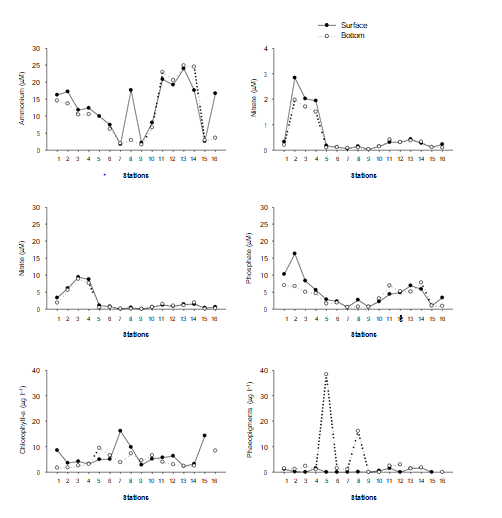
Mean dissolved oxygen concentration in surface water was 4.00 ml l-1 and in bottom water was 3.78 ml l-1. Dissolved oxygen saturation level (OD (% sat)) ranged from 64.72 to 126.46% in surface water and from 65.68 to 111.63 % in bottom water. In surface water ammonium presented mean concentration of 12.83 μM, ranging between 1.73 and 23.98 μM (Table 2). In bottom water ammonium concentrations ranged between 1.62 and 24.86 μM and presented a mean concentration of 11.18 μM. Nitrate with a mean value of 0.59 μM in surface water varied between 0.03 and 2.83 μM. In bottom water nitrate showed values between 0.08 and 1.97 μM, and a mean concentration of 0.47 μM (Table 2). Nitrite showed a mean concentration of 2.28 and 1.97 μM in surface and bottom water, respectively. Phosphate in surface water varied from 0.57 to 16.30 μM, while in bottom water ranged between 0.55 to 7.01 μM (Table 2). Total dissolved inorganic nitrogen (DIN) presented mean values of 15.69 and 13.75 in surface and bottom water, respectively. Chlorophyll-a concentrations were higher than the phaeopigments in surface water. Chlorophyll-a varied between 2.32 and 16.13 μg l-1. Phaeopigments ranged between non-detected (n.d.) and 1.72 μg l-1 (Table 2). Chlorophyll-a in bottom water ranged from 1.69 to 9.44 μg l-1, with a mean value of 4.52 μg l-1. Paheopigments ranged between n.d. and 38.31 μg l-1 with a mean concentration of 4.77 μg l-1. None significant differences were found between temperature, salinity and dissolved oxygen between surface and bottom water. In addition, no significant differences were detected for nutrients and chlorophyll-a concentration (Figure 2).
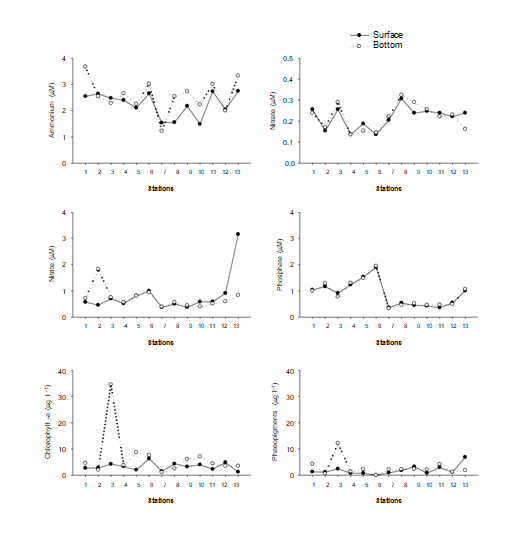
On the other hand, phaeopigments presented significant higher concentrations in bottom than in surface water (U = 72.5; p = 0.0365). Secchi depth in Cananeia varied from 0.7 m at station 1 to 2.0 m at stations 5, 9, 10, 11 and 13 (Table 1). Surface temperature ranged from 19.50 to 22.10 °C and surface salinity from 13.78 to 32.65. Bottom temperature presented values between 19.03 and 21.50 °C and bottom salinity between 14.36 and 32.98 (Table 2). The pH showed a mean value of 7.91 and 7.88 in surface and bottom water, respectively (Table 2). Mean dissolved oxygen concentration in surface water was 4.76 mg l-1, while in bottom water was 4.46 mg l-1. Dissolved oxygen saturation level (DO (% sat)) ranged from 85.45 to 102.34 % in surface water and from 85.43 to 102.38 % in bottom water. Ammonium presented a mean concentration of 2.23 μM, ranging between 1.48 and 2.75 μM in surface water (Table 2). In bottom water ammonium concentrations ranged between 1.22 and 3.67 μM and presented a mean value of 2.57 μM. Nitrate with a mean value of 0.22 μM in surface water varied between 0.14 and 0.31 μM. In bottom water nitrate showed a mean concentration of 0.22 μM (Table 2).
Nitrite showed a mean concentration of 0.81 and 0.72 μM in surface and bottom water, respectively. Phosphate in surface water varied from 0.36 to 1.89 μM, while in bottom water ranged between 0.33 to 1.94 μM (Table 2). DIN presented a mean value of 3.26 and 3.51 in surface and bottom water, respectively. Chlorophyll-a in surface water varied between 1.16 and 6.24 μg l-1 with a mean value of 3.24 μg l-1. Phaeopigments with a mean concentration of 1.82 μg l-1 ranged between non-detected (n.d.) and 6.83 μg l-1 (Table 2). Chlorophyll-a in bottom water ranged from 1.07 to 34.48 μg l-1 and showed a mean value of 6.84 μg l-1. Phaeopigments ranged between n.d. and 12.11 μg l-1 with a mean concentration of 2.78 (mg l-1). No significant differences were found among temperature, salinity and dissolved oxygen, nutrients and photosynthetic pigments concentrations among surface and bottom water (Figure 3).
In general, no statistical differences were found among surface and bottom water both in Santos and Cananeia, and when there was a difference (for phaeopigments) the higher values were found in bottom waters. Therefore, in this study it was used just bottom water parameters for comparison among the two estuarine systems and also in the principal component analysis. The Mann-Whitney non-parametric test results detected significant higher temperature and salinity values in Santos than in Cananeia (U = 17.0; p = 0.0011 and U = 27.0; p = 0.0003), respectively. On the other hand, oxygen saturation levels were significant higher in Cananeia (U = 34.0; p = 0.0021). In addition, ammonium and phosphate concentrations were significant higher in Santos than in Cananeia (U = 46.0; p = 0.0110 and U = 34.5; p = 0.0023), respectively.
Sediment Characterization
Sand was the predominant sediment fraction at most of the stations of Santos representing 63 – 99 % (Table 3). At stations 1, 2 and 4, silt was the most abundant sediment fraction with more than 55 %, while station 5 presented similar contributions of sand and silt. In contrast, station 14 showed similar contributions of silt and clay (Table 3). Total organic matter content (TOM) ranged between 0.82 (station 11) and 20.15 % (station 14) (Table 3).
| Santos | |||||
|---|---|---|---|---|---|
| Station | Sand (%) | Silt (%) | Clay (%) | TOM (%) | PRT:CHO |
| 1 | 10.35 | 65.03 | 24.62 | 18.29 | 0.77 |
| 2 | 17.62 | 66.36 | 16.02 | 15.14 | 0.83 |
| 3 | 69.25 | 22.88 | 7.69 | 6.12 | 0.28 |
| 4 | 21.17 | 56.31 | 22.52 | 11.62 | 0.48 |
| 5 | 34.46 | 46.51 | 19.03 | 10.91 | 0.39 |
| 6 | 79.85 | 14.65 | 5.50 | 4.58 | 0.25 |
| 7 | 98.70 | 1.30 | 0.00 | 1.49 | 0.11 |
| 8 | 82.00 | 16.00 | 2.00 | 4.98 | 0.69 |
| 9 | 99.71 | 0.29 | 0.00 | 1.04 | 2.06 |
| 10 | 97.94 | 2.06 | 0.00 | 1.47 | 1.02 |
| 11 | 99.86 | 0.14 | 0.00 | 0.82 | 0.31 |
| 12 | 99.55 | 0.45 | 0.00 | 4.91 | 1.05 |
| 13 | 99.40 | 0.60 | 0.00 | 1.94 | 2.72 |
| 14 | 3.09 | 53.07 | 43.84 | 20.15 | 1.97 |
| 15 | 63.65 | 30.29 | 6.06 | 10.71 | 0.67 |
| 16 | 99.05 | 0.95 | 0.00 | 1.48 | 3.28 |
| Cananéia | |||||
| Station | Sand (%) | Silt (%) | Clay (%) | TOM (%) | PRT:CHO |
| 1 | 99.57 | 0.43 | 0.00 | 3.06 | 0.53 |
| 2 | 92.30 | 1.70 | 0.00 | 2.98 | 0.84 |
| 3 | 96.92 | 3.08 | 0.00 | 2.22 | 2.80 |
| 4 | 13.34 | 57.40 | 29.26 | 11.84 | 1.26 |
| 5 | 82.76 | 10.16 | 7.08 | 3.54 | 0.95 |
| 6 | 99.97 | 0.03 | 0.00 | 0.49 | 1.19 |
| 7 | 99.97 | 0.03 | 0.00 | 0.67 | 1.19 |
| 8 | 91.65 | 8.35 | 0.00 | 3.18 | 1.02 |
| 9 | 36.12 | 39.65 | 24.23 | 11.71 | 0.78 |
| 10 | 99.89 | 0.11 | 0.00 | 2.11 | 1.47 |
| 11 | 60.38 | 19.81 | 19.81 | 11.25 | 1.69 |
| 12 | 98.74 | 1.26 | 0.00 | 3.14 | 0.93 |
| 13 | 99.86 | 0.14 | 0.00 | 0.69 | 1.60 |
Table 3: Relative percentage of the different sediment fractions, total organic matter content, chlorophyll-a to phaeopigments ra
| Mediana | 0.73 | 7.00 | 96.92 | 1.70 | 0.00 | 3.06 | 1.19 |
|---|---|---|---|---|---|---|---|
| Min | 0.11 | 1.00 | 13.34 | 0.03 | 0.00 | 0.49 | 0.53 |
| Max | 3.28 | 13.00 | 99.97 | 57.40 | 29.26 | 11.84 | 2.80 |
| Sd | 0.94572 | 3.89444 | 28.2555 | 18.0095 | 10.758 | 4.24547 | 0.57313 |
Table 4: Relative percentage of the different sediment fractions, total organic matter content, chlorophyll-a to phaeopigments ra
Sedimentary chlorophyll-a concentrations varied between 0.62 and 77.77 μg g-1, while phaeopigments ranged between 1.88 and 119.29 μg g-1. The lowest and the highest concentrations corresponded to stations 16 and 14, respectively (Figure 4). Proteins in sediments ranged from
0.29 mg g-1 at station 16 to 21.04 mg g-1 at station 1 (Figure 4). Carbohydrates presented values between 0.37 and 14.32 mg g-1. The lowest value corresponded to station 16 and the highest to station 1 (Figure 4).
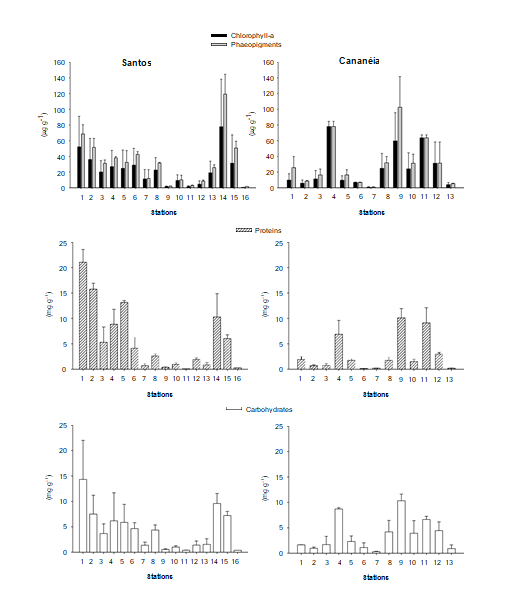
In Cananeia, sediments were constituted mainly by sand with more than 90 % at most of the stations (Table 3). The exceptions were stations 4 that showed a predominance of silt and station 9, in which sand, silt and clay presented similar percentages (Table 3). TOM varied between 0.49 % (station 6) and 11.71 % (station 9) (Table 3). Chlorophyll-a concentration in sediments ranged between 0.68 μg g-1 at station 7 to 78.00 μg g-1 at station 4. Phaeopigments presented the lowest value (1 μg g-1) also at station 7, while the highest value (102.55 μg g-1) was detected at station 9 (Figure 4). Sedimentary proteins ranged between 0.13 and 10.0 mg g-1. The lowest concentration was detected at station 6 and the highest at station 9 (Figure 4). Carbohydrates varied from 0.30 to 10.32 mg g-1. The lowest value corresponded to station 7 and the highest to station 9 (Figure 4).
Principal Component Analyses
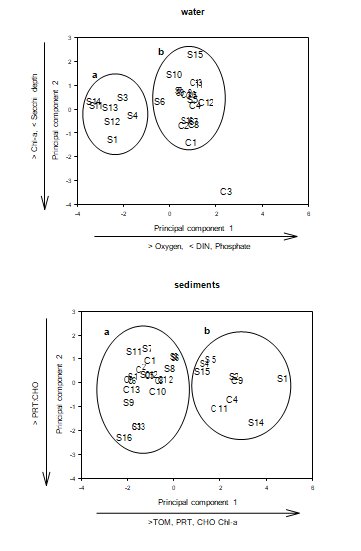
The PCA ordination performed with the eutrophication related variables for water samples resulted in the formation of two groups of stations (Figure 5).
| Water | Sediments | ||||||
|---|---|---|---|---|---|---|---|
| Eigenvalues | %Variation | Cum. % Variation | Eigenvalues | %Variation | Cum. % Variation | ||
| PC1 | 2.78 | 55.6 | 55.6 | PC1 | 3.61 | 72.2 | 72.2 |
| PC2 | 1.1 | 21.9 | 77.5 | PC2 | 0.989 | 19.8 | 92 |
| Eigenvectors | Eigenvectors | ||||||
| Variable | PC1 | PC2 | Variable | PC1 | PC2 | ||
| Secchi depth | -0.064 | 0.814 | TOM | 0.51 | -0.072 | ||
| DO | 0.53 | 0.166 | PRT | 0.491 | 0.059 | ||
| DIN | -0.574 | -0.079 | CHO | 0.514 | -0.023 | ||
| Phosphate | -0.572 | -0.088 | PRT:CHO | -0.127 | -0.97 | ||
| Chl-a | 0.242 | -0.543 | Chl-a | 0.467 | -0.222 |
Table 5: Results of the Principal Component Analysis (PCA) performed with the eutrophication related variables for water and sedi
Table 4: Results of the Principal Component Analysis (PCA) performed with the eutrophication related variables for water and sediment samples of Santos and Cananeia, São Paulo- Brazil. The first component (PC1) explained 55.6 % of the variance, while the second component (PC2) explained 21.9%. The first component showed positive correlation with dissolved oxygen concentration and negative correlation with DIN and phosphate concentrations. The second component was positively correlated with Secchi depth and negatively correlated with chlorophyll-a concentration (Table 4). ANOSIM results (Global R = 0.953; significance level = 0.1 %) showed that Group a, which included stations 1, 2, 3, 4, 11, 12, 13 and 14 from Santos was significantly different from Group b, which included the rest of the stations from Santos and all the stations from Cananeia. Group a presented significant lower dissolved oxygen (U = 4.00; p < 0.0001) and chlorophyll-a concentrations (U = 22.50; p = 0.0035) than Group b (Table 5). Also, Group a showed significant higher DIN (U = 1.00; p < 0.0001) and phosphate (U = 2.00; p < 0.0001) levels than Group b (Table 5). Secchi depth between these two groups was not significantly different (U = 88.50; p = 0.7860) (Table 4).
The PCA ordination performed with the eutrophication related variables for the sediments also resulted in the formation of two groups of stations (Figure 5). The first component (PC1) explained 72.2 % of the total variance and the second component (PC2) 19.8 % (Table 4). The PC1 was positively correlated with total organic matter, proteins, carbohydrates and chlorophyll-concentrations, while the PC2 showed negative correlation with the proteins to carbohydrates ratio (Table 4). ANOSIM results (Global R = 0.771; significance level = 0.1 %) showed that Group a was significantly different from Group b. Group b, which included stations 4, 9 and 11 from Cananeia and stations 1, 2, 4, 5, 14 and 15 from Santos presented significant lower TOM content (U = 1.00: p < 0.0001), proteins (U = 1.00: p < 0.0001), carbohydrates (U = 2.00; p < 0.0001) and chlorophyll-a (U = 1.00: p <0.0001) concentrations than Group a (Table 5). Group a, which included the rest of the stations from both estuaries showed the opposite. PRT: CHO ratios presented no significant difference among the estuaries (U = 81.00; p = 0.6714) (Table 5).
| Water | ||||||
|---|---|---|---|---|---|---|
| Secchi depth (m) | DO(mg l-1) | DIN (μM) | Dissolved Phosphate (μM) | Chl-a (μg l-1) | ||
| Group a | Mean | 1.66 | 3.33 | 22.27 | 6.05 | 2.64 |
| SD | 0.35 | 0.29 | 3.46 | 1.18 | 0.75 | |
| Group b | Mean | 1.7 | 4.58 | 3.71 | 1.06 | 5.32 |
| SD | 0.51 | 0.5 | 1.45 | 0.69 | 2.4 | |
| Sediments | ||||||
| TOM (%) | PRT (mg.g-1) | CHO (mg.g-1) | PRT:CHO | Chl-a (μg g-1) | ||
| Group a | Mean | 13.51 | 11.24 | 8.48 | 0.98 | 50.07 |
| SD | 3.52 | 4.73 | 2.67 | 0.54 | 21.03 | |
| Group b | Mean | 2.55 | 1.43 | 2.04 | 1.22 | 12.45 |
| SD | 1.64 | 1.4 | 1.54 | 0.89 | 9.93 |
Table 6: Mean and standard deviation of the eutrophication related variables in the two groups of stations obtained in the PCA.
Discussion
Trophic Condition Based on Water Parameters
To achieve the trophic condition of Santos and Cananeia estuaries on these study different water parameters were applied in order to identify the different quality environment groups. Considering that no significant statistical difference between surface and bottom water, both in Santos and Cananeia, were observed, just bottom water parameters were applied in order to identify the estuaries trophic condition. PCA ordination based on bottom water parameters (dissolved oxygen, DIN, phosphate, chlorophyll-a and Secchi disk depth) resulted in two groups (Figure 5). The first, group a is composed by seven Santos estuary stations, while the second, group b compile the lasting Santos stations and all Cananeia stations, except one station. The station 3 of Cananeia estuary was not grouped according to the PCA ordination.
The group a Santos stations are located close to the Industrial complex (sts. 1, 2, 4 and 4) and in the inner western estuary area (St. 11, 12, 13 and 14), this last one characterized by the presence of houses raised up on stilts and a retired site for dumping household waste. The principal component 1 (PC1) from PCA ordination represents the main contributors for the grouping and have as main variables the dissolved oxygen concentration, DIN and phosphate (Table 4). Principal component 2 (PC2) parameters was chlorophyll- and Secchi disk depth and not counted significantly on the grouping. Mean dissolved oxygen concentration of group a is at least 1 ml l-1 lower than the mean value observed in group b (Table 5). On this case both groups represent an environment biologically stressful according to Bricker SB, et al. [1, 53]. However, despite the fact that the oxygen levels of both groups are close, the group b contains stations with oxygen concentration higher than 5 ml l-1 indicating healthier environments when comparing to group a. The low dissolved oxygen values on the inner areas of the estuary (group a area) suggest a major organic matter contribution to this part of the system, leading to higher decomposing processes associated to a decrease in the oxygen levels [54], as observed in a eutrophic estuary in China most influenced by organic matter from terrestrial source [55, 56].
The others main parameters of PC1 (DIN and phosphate) indicate that group a is characterized by a more enriched nutrients area than group b. DIN and phosphate mean values of group a are in general almost six times greater than that observed in group b. In general the aquatic system under eutrophication process present increase of nutrients from anthropogenic input [57, 58], but the contribution from organic matter decomposition with Dissolved Oxygen consumption and from autochthonous origin as organic matter produced in surface water that sinking to the bottom water and sediments [56, 59] can contribute to the nutrient pool, evidenced in nitrogen and phosphorus inorganic concentrations. The inner estuary area where group a stations are located presented the lowest salinity values on Santos estuary, therefore the phosphate contribution to this areas could be associated with the fresh water input to the system. Higher values of DIN observed in group a are associated specially to the ammonium contribution to the system. However, while on the inner area close to the Industrial complex the major contribution to the DIN values came from the ammonium concentration; in the inner western area of the system the higher ammonium values are associated to high amounts of nitrate and nitrite as observed by Braga ES, et al. [32] in the same region (Santos estuary). The low dissolved oxygen concentration associated to the high amounts of nitrogen compounds observed on group a suggest that the area comprised by this group is characterized by predominant denitrification process and ammonification, resulting in accumulate high amounts of organic matter and nutrients.
The PCA treatment indicates groups of particular trophic conditions as observed by the values of the PC1 parameters.
The group a indicates an environment with high amounts on dissolved nutrients and low dissolved oxygen concentration, what could lead to a propitious eutrophication panel. Accordingly to Bricker SB, et al. [1, 53], the low oxygen levels could be understood as an initial symptom of eutrophication with the high nutrients inputs as influencing factors. Recently, the empirical models using dissolved oxygen could be associated to the eutrophication process and nutrients loads [60].The major contributions to this scenario are probably the specifically inputs that occur in the inner area of the Santos estuary [32]. The industrial complex in the inner area of Santos is known as an area of industrial discharge that has been working out to diminish the hazard discharge on the system.
However, the values observed on this study indicate unbalanced among the N forms on this inner part of the estuary that could be related to an industrial losses, especially those from fertilizer industries located there. In the other hand, the results of the western area of the inner estuary, that can be associated to organic loads from precarious residential nucleous raised up on stilts, suggested that denitrification process on OM domaining the area. This denitrification process could be related to a high organic matter input on the system especially on this area that not presents a proper sanitary system for waste discharge [61, 62]. The group b indicated by PCA suggest healthier environments when compared with that one’s grouped as group a. Cananeia estuary stations, that represents a healthier environment compared to most of the Santos stations, were grouped as group b with few Santos stations (from Santos Bay and Santos channel). The group b stations suggest more equilibrated environment. It is reinforced by some authors [63, 64] in relation to the water and sediment inorganic properties in the estuary around Cananeia city.
Trophic Condition Based on Sediment Parameters
In order to access the environment trophic state some sediment parameters (TOM, proteins, carbohydrates, PRT: CHO, Chl-a) were used on a PCA ordination. Protein and carbohydrates values found in the organic matter present in the sediments are applied as indicatives of the environment health as the relation between these compounds can reflect the organic matter quality [3, 65, 74, 76]. Two groups were formed by the PCA ordination based on sediment parameters (Figure 5). The first group a is composed by nine stations, six of them from Santos estuary and three stations from Cananeia estuary. The second group (group b) comprehends the other stations from both estuaries (Santos and Cananeia). Santos stations from group a are located very close to the Industrial complex (sts. 1 and 2), in the area of the Santos Harbor (Sts. 4 and 5), in the western inner area of the estuary (St. 14) and in the Santos Bay on the east side of the submarine sewage outfall (St. 15). The group a is also formed by Cananeia stations located in the inner channels (St. 4 at the Cananeia channel and St. 11 at the Cubatao channel) an in the Trapande Bay (St. 9). PCA principal component 1 (PC1) represents the main contributors for the grouping based on TOM, protein, carbohydrate and Chl-a (Table 4). PRT:CHO ratios from principal component 2 (PC2) parameters not counted significantly on the grouping. Variables of the PC1 are all related to the grain size as on the presence of fine grains as silt and clay is common the higher accumulation of different compounds and the presence of a more pronounced amount of organic matter. All the stations found in the group a presents an accentuated contribution of silt and clay in comparison to the others station of each estuary (Table 3). Mean values of TOM, protein, carbohydrate and Chl-a are higher in group a, with mean protein concentration in group a seven times greater than mean value of group b.
Protein and carbohydrates mean values observed in group a are considered extremely high as they are higher than 4 mg g-1 and 7 mg g-1, protein and carbohydrate respectively [3]. In Group a protein and carbohydrates values are considered representative from environments in hypertrophic conditions [3], where the high nutrients input lead to a severe decrease of the oxygen content. Mean values of protein and carbohydrates in Group b suggest a meso- oligotrophic environment according to the classification presented by Dell’Anno et al. [3]. The PRT:CHO ratio can be associated to recent deposited material when the ratio values are higher than 1 [75].
The association of the PRT:CHO ratio to the fresh material is based on the protein content of the organic matter as these molecules tend to be mineralized faster than carbohydrates [66, 67, 75]. High productive areas as estuaries tend to present high PRT: CHO ratios [24, 9, 67], however, the PRT:CHO values observed in both groups on this study are very similar and much lower than that observed in Arno [26] and Mundaka and Bilbao [67] estuaries with values ranging between 0.3 and 14.4, indicating that the material was longer deposited on Santos and Cananeia. Venturini N, et al. [69] observed PRT: CHO >1 in the inner station of the Montivideo Bay suggesting intense detritus mineralization and [66, 67, 69] increment in protein due to bacterial activity. In the present study, the values varied from 0.11 to 3.28 (median 0.73, n=16)) in Santos and 0.53 to 2.80 (1.16, n=13) in Cananeia. Joseph MM, et al. [70] observed higher PRT:CHO ratio in estuarine sediments than in mangrove sediments attributed to the hydrodynamic condition and freshwater discharge in estuary opposite to low water change in mangrove sediments favoring dead organic matter accumulation. On the other hand, high lipid: carbohydrate (LPD:CHO) ratios observed in the Rufiji mangrove systems pointed towards the high quality of labile organic matter which supports benthic fauna [76]. However, Cheriyan AS, et al. 2022 [77] showed high PRT:CHO (>1) associated to biopolymeric carbon (BPC) and degradation index (DI) indicated eutrophication related with the increase in algal organic matter.
Chl-a mean value in group a is four times greater than that observed on group b. However, the Chl-a values from both groups are not considered high and are similar to that observed on the Palmones estuary with a maximum value of 15.19 µg g-1 by Moreno S, et al. [71] either by Garcia- Rodriguez F, et al. [68] with a maximum of 23 μg g-1. On the other hand, mean values of phaeopigments of group a (66.41 μg g-1) are almost four times greater than that observed in group b (17.28 μg g-1) and suggest the presence of high human activities [64] as in harbors areas [3], since it is possible to considering the Group b as a more healthy and protect environment also based on mean protein and carbohydrates values. Nonetheless, not all station of group a are necessarily associated to a human activity impact as phaeopigments values are negatively correlated to the hydrodynamics and positively correlated to the silt and clay sediment fraction. The two groups formed by PCA indicate different environment conditions based on the TOM, protein and carbohydrates concentrations found in the sediment. Group a indicates the presence of stations in hypertrophic conditions and affected by human activities accordingly to the sediment parameters, while Group b suggest a more healthy environment. In general, all Santos stations found in Group a could be associated to human impact as the sites are influenced by industrial and harbor activities, non-treated sewage discharge and submarine sewage outfall. In the other hand, Cananeia stations from Group a not correspond to places known as impacted by human activities as this estuary in considered a relatively well preserved area [42, 16, 63, 64]. It is possible to consider that the high values of sediments parameters observed in Cananeia stations from Group a are mainly influenced by the hydrodynamics and grain size distribution on this sites due the fact that this estuary is considered very productive and could store high amounts of protein, carbohydrate and phaeopigments on the fine fraction of the sediment. This possibility is corroborated by the results of Amorim EP, et al. [40] that found the same Group a station of Cananeia acting as retention points due to its silt and clay composition. However, Santos stations from Group represent areas where anthropogenic activities could largely influence the environment.
Stations that come along the central inner area of Santos estuary through the Santos channel (Sts. 1, 2, 4 and 5) are influenced on the north by the industrial complex and on the south by the Santos Harbor, except by station 3 that is located in a more enclosure area and not present high amounts of silt and clay that works as a holding fraction. On the west side of the estuary, station 14 could suffer influence from the industrial activity and/or non-treated waste discharge recording high values of organic material on its fine fraction. The station 15 could be responding due to its fine fraction composition as a retention point of the submarine sewage outfall discharge that could affect this area on the Santos Bay. The grain size distribution on the Santos Bay could be divided on two groups: one rich in silt sediment on the east side and another with sand grains on the west [72, 73]. The east side of the sewage outfall is characterized as rich on organic matter and nutrients [37]. Based on the present study observations is possible to define the groups as hypertrophic and meso- oligotrophic environments accordingly to Dell’Anno et al. [3], respectively for Group a and Group b also verified by Sutti BO, et al. [62]. However, it is clear that not necessarily the Group a represents only stations from a non-healthy environment due to human activities influence on the system.
Comparison Between Groupings and Between Estuaries
Based on the PCA ordination applied in water parameters and in the sediment parameters, it was identified two distinctly groups: Group a and Group b. Group a comprehends in general stations in a non-healthy condition with eutrophication tendency or, based on sediment variables, in hypertrophic condition. On the other group (Group b), stations with healthier characteristics as meso-ologitophic environments were grouped. Although the fact, the groupings are based on specifically water and sediment parameters, respectively, the groups formed by PCA ordination presented some areas on Santos estuary with similarities accordingly to the groups formed. The stations 1, 2, 4 and 14 were identified as part of Group a on both cases (pelagic and benthic grouping), strongly suggesting that these areas on Santos estuary are under eutrophication process and, on this case, probably due to human activity impact.
These stations from Santos are all located on areas close to the industrial complex and/or non-treated waste discharge. The other stations grouped as a in both cases (water and sediment parameters) differs from each other on location. However, is interesting observe that all the station from Santos grouped as a by the sediment parameters are located very close to stations characterizes as under pressure on both groupings. This could indicate that the areas close to the industrial complex, on the central inner area of the estuary in direction to the Santos channel (Sts. 1, 2, 3 and 4), and on the western area of the estuary (Sts. 11, 12, 13 and 14) are all suffering from the effects from non-treated effluent coming from the different human activities of the surroundings areas. Otherwise, just stations rich in silt and clay material works as retention points on these areas (Sts. 1, 2, 4 and 14) as observed from the sediment variables. The association of the state on both compartments on this case is useful in order to verify the extension of the anthropogenic influence on the estuary close to the industrial complex and on the western area.
The results from the benthic compartment are strongly affected by the amount of the silt and clay fraction on the sediments as this fine fraction acts a holding area on the estuaries as observed by Amorim EP, et al. [40] on Cananeia. On this case we suggest that the others areas characterized as hypertrophic on Santos estuary (Sts. 5 and 15) could really be seen as problematic areas due to the high amount of human activity on these sites. These stations could be acting as holding sites to compounds from the harbor and the submarine sewage outfall. However, Cananeia stations grouped as hypertrophic environments are probably characterized by the accumulation of the organic material on the fine fraction of the sediment and not by anthropogenic influence on this estuary. It is also possible, based on the water parameters results, verify that Cananeia is not as unhealthy as Santos due to the higher oxygen saturation levels while Santos showed waters more enriched in nutrients, suggesting that Cananeia has a better nutrients cycling due to its oxygen and nutrient levels. Based on these observations is important conclude that the verification of the benthic compartment state based solely on the sediment parameters as protein and carbohydrates could lead to misunderstanding results if no clear background knowledge on the study area is available or more data are accessible.
Conclusion
Based on the groups formed by PCA ordination using water and sediment parameters it was possible to identify areas of the Santos estuary that are probably under high anthropogenic influence due to its proximity to the industrial complex located at Cubatao region on the inner estuary (Sts. 1, 2, 3 and 4) and on the western area of the system (Sao Vicente city), close to the habitacional nucleous raised up on stilts that are under not enough sanitary conditions with non-treated sewage (Sts. 10, 11, 12 and 14). However, the major retention is only seen on the stations rich in silt and clay minerals (fine fraction of the sediments) (Sts. 1, 2, 4 and 14). On this case the associated use of water and sediment variables to access the environment state was very useful to achieve the real extent of the human activity influence. The PCA grouping based on sediment parameters also suggest more two areas of Santos that could be characterized as non- quality environments. Station 5 (close to the Santos Harbor) and station 15 (on the east side of the submarine sewage outfall) that could be acting as holding sites to the material flux from the anthropogenic activities on the surrounding areas. However, the three stations indicated as non-healthy environments by the sediment variables on Cananeia are not understood as areas influenced by human activities. These Cananeia stations rich on organic material work as retention sites due to his high amount of fine sediment fraction. Santos and Cananeia presents different anthropogenic influences and it can be seen by using the water and sediment variables grouping, nevertheless the individual use of the sediment variables could lead to misunderstanding results as the fine grains (silt and clay) found on the sediments highly influence the results.
Acknowledgment
The authors would like to thanks the analytical support of Vitor C. Chiozzini, the crew of the R/V “Albacora” from the Oceanographic Institute of Sao Paulo for their help during the sampling survey.
Funding
This work has been supported by Fundaçao de Amparo à Pesquisa do Estado de Sao Paulo – FAPESP (Process 2005/50769-2) and also by the Coordenaçao de Aperfeiçoamento de Pessoal de Nível Superior – CAPES, which provided grants forthe master degree of A.R. Perretti.
References
-
Bricker SB, Ferreira JG, Simas T (2003) An integrated methodology for assessment of estuarine trophic status. Ecological Modelling 169(1): 39-60.
-
Hao YY, Zhu ZY, Fang FT, Novak T, Cankovi M, et al. (2021) Tracing Nutrients and Organic Matter Changes in Eutrophic Wenchang (China) and Oligotrophic Krka (Croatia) Estuaries: A Comparative Study. Frontiers in Marine Science 8: 663601.
-
Dell Anno A, Mei ML, Pusceddu A, Danovaro R (2002) Assessing the trophic state and eutrophication of coastal marine systems: a new approach based on the biochemical composition of sediment organic matter. Marine Pollution Bulletin 44(7): 611-622.
-
Cahoon LB, Cooke JE (1992) Benthic microalgal production in Onslow Bay, North Carolina, USA. Marine Ecology Progress Series 84: 185-196.
-
de Jong DJ, de Jonge VN (1995) Dynamics of microphytobenthos chlorophyll-a in the Scheldt estuary (SW Netherlands). Hydrobiology 311: 21-30.
-
Lucas CH, Widdows J, Brinsley MD, Salkeld PN, Herman PMJ (2000) Benthic-pelagic exchange of microalgae at a tidal flat. 1. Pigment analysis. Marine Ecology Progress Series 196: 59-73.
-
Szymczak Zyla M, Krajewska M, Winogradow A, Zaborska A, Breedveld GD, et al. (2017) Tracking trends in eutrophication based on pigments in recent coastal sediments. Oceanologia 59(1): 1-17.
-
Da Costa BVM, Moreira MZ, Bastos RF, Yogui GT (2021) Distribution and origin of sedimentary organic matter in an eutrophic estuary: Pina Sound–NE Brazil. Anais da Academia Brasileira de Ciencias 93(1).
-
Pusceddu A, Dell Anno A, Danovaro R, Manini E, Sara G, et al. (2003) Enzymatically hydrolyzable protein and carbohydrate sedimentary pools as indicators of the trophic state of detritus sink systems: A case study in a Mediterranean coastal lagoon. Estuaries 26: 641-650.
-
Díaz RJ, Rosenberg R (1995) Marine benthic hypoxia: A review of its ecological effects and the behavioural responses of benthic macrofauna. Oceanography Marine Biology Ann Rev 33: 245-303
-
Cloern JE (2001) Our evolving conceptual model of the coastal eutrophication problem. Marine Ecology Progress Series 210: 223-253.
-
Rabalais NN, Diaz RJ, Levin LA, Turner RE, Gilbert D, et al. (2010) Dynamics and distribution of natural and human- caused coastal hypoxia. Biogeosciences 7(2): 585-619.
-
Bigot L, Conand C, Amouroux JP, Frouin P, Bruggemann H, et al. (2006) Effects of industrial outfalls on tropical macrobenthic sediment communities in Reunion Island (Southwest Indian Ocean). Marine Pollution Bulletin 52(8): 865-880.
-
Braga ES (2002) Marine Biochemistry-effects of pollution on biochemical processes. Funderspa, pp: 108.
-
Braga ES, Bonetti CVDH, Burone L, Bonetti FJ (2000) Eutrophication and bacterial pollution caused by industrial and domestic wastes at the Baixada Santista Estuarine System-Brazil. Marine Pollution Bulletin 40(2): 165-173.
-
Perretti AR, Venturini N, Braga ES (2006) Evaluation of sedimentary organic matter in the Estuarine System of Santos-SP. Brazilian Symposium on Oceanography III.
-
Barrera AJJ, Gianesella SMF, Moser GAO, Saldanha CFM (2009) Influence of allochthonous organic matter on bacterioplankton biomass and activity in a eutrophic, sub-tropical estuary. Estuarine Coastal and Shelf Science 82(1): 84-94.
-
Canuell EA, Hardison AK (2015) Sources, Ages, and Alteration of Organic Matter in Estuaries. The Annual Review of Marine Science 8: 409-434
-
Danovaro R, Fabiano M, Dellacroce N (1993) Labile Organic-Matter and Microbial Biomasses in Deep-Sea Sediments (Eastern Mediterranean-Sea). Deep-Sea Research Part I-Oceanographic Research Papers 40(5): 953-965.
-
Barcellos RL, Berbel GBB, Braga ES, Furtado VV (2005) Distribution and characteristics of sedimentary phosphorus in the estuarine lagoon system of Cananeia- Iguape, State of Sao Paulo, Brazil. Geochimica Brasiliensis (Rio de Janeiro) 19(1): 22-36.
-
Su L, Wang S, Ji R, Zhuo G, Liu C (2022) New Insight into the Role of FDOM in Heavy Metal Leaching Behavior from MSWI Bottom Ash during Accelerated Weathering Using Fluorescence EEM-PARAFAC, Waste Manag 144: 153-162.
-
Fabiano M, Danovaro R, Fraschetti S (1995) A 3-Year Time-Series of Elemental and Biochemical-Composition of Organic-Matter in Subtidal Sandy Sediments of the Ligurian Sea (Northwestern Mediterranean). Continental Shelf Research 15: 1453-1469.
-
Fabiano M, Danovaro R (1998) Enzymatic activity, bacterial distribution, and organic matter composition in sediments of the Ross Sea (Antarctica), Applied and Environmental Microbiology 64(10): 3838-3845.
-
Galois R, Blanchard G, Seguignes M, Huet V, Joassard L (2000) Spatial distribution of sediment particulate organic matter on two estuarine intertidal mudflats: a comparison between Marennes-Oleron Bay (France) and the Humber Estuary (UK), Continental Shelf Research 20: 1199-1217.
-
Baldock JA, Masiello CA, Gelinas Y, Hedges JI (2004) Cycling and composition of organic matter in terrestrial and marine ecosystems, Marine Chemistry 92: 39-64.
-
Fabiano M, Danovaro R (1994) Composition of Organic- Matter in Sediments Facing a River Estuary (Tyrrhenian Sea) - Relationships with Bacteria and Microphytobenthic Biomass, Hydrobiologia 277: 71-84.
-
Millo C, Bravo C, Covelli S, Pavoni E, Petranich E (2021) Metal binding and sources of humic substances in recent sediments from Cananeia-Iguape Estuarine-Lagoon Complex (South-Eastern Brazil). Applied Sciences 11(18): 1-20.
-
Dauwe B, Middelburg JJ (1998) Amino acids and hexosamines as indicators of organic matter degradation state in North Sea sediments, Limnology and Oceanography 43(5): 782- 798.
-
Cowie GL, Hedges JI (1994) Biochemical Indicators of Diagenetic Alteration in Natural Organic-Matter Mixtures, Nature 369: 304-307.
-
Fairweather PG (1999) Determining the ‘health’ of estuaries: Priorities for ecological research. Australian Journal of Ecology 24(4): 441-451.
-
Miranda LB, Castro, BM, Kjerfve B (2002) Princípios de oceanografia física de estuários. EDUSP, Sao Paulo, pp: 432
-
Braga ES, Bonetti CVDH, Burone L, Bonetti FJ (2000) Eutrophication and bacterial pollution caused by industrial and domestic wastes at the Baixada Santista Estuarine System-Brazil, Marine Pollution Bulletin 40(2): 165-173.
-
Nishigima FN, Weber RR, Bicego MC (2001) Aliphatic and aromatic hydrocarbons in sediments of Santos and Cananeia, SP, Brazil. Marine Pollution Bulletin 42(11): 1064-1072.
-
Medeiros PM, Bicego MC (2004). Investigation of natural and anthropogenic hydrocarbon inputs in sediments using geochemical markers. I. Santos, SP-Brazil, Marine Pollution Bulletin 49: 761-769.
-
Bícego M, Taniguchi S, Yogui GT, Montone RCS, Silva DAM (2006) Assessment of contamination by polychlorinated biphenyls and aliphatic and aromatic hydrocarbons in sediments of the Santos and Sao Vicente Estuary System, Sao Paulo, Brazil, Marine Pollution Bulletin 52(12): 1804-1816.
-
Umbuzeiro GD, Kummrow F, Roubicek DA, Tominaga MY (2006) Evaluation of the water genotoxicity from Santos Estuary (Brazil) in relation to the sediment contamination and effluent discharges. Environment International 32(3): 359-364.
-
Siqueia GW, Aprile FM, Mahiques MM, Braga E S (2006) Determinaçao da materia orgânica e razões C/N e C/S em sedimentos de fundo do Estuário de Santos - SP/ Brasil. Arquivos de Ciências do Mar 39: 18-27.
-
Cesar A, Choueri RB, Riba I, Morales-Caselles C, Pereira CDS, et al. (2007) Comparative sediment quality assessment in different littoral ecosystems from Spain (Gulf of Cadiz) and Brazil (Santos and Sao Vicente estuarine system). Environment International 33(4): 429-435.
-
Ramsar ListST, Brazil.
-
Amorim EP, Favaro, DIT, Berbel GBB, Braga ES (2008) Assessment of metal and trace element concentrations in the Cananeia estuary, Brazil, by neutron activation and atomic absorption techniques Journal of Radioanalytical and Nuclear Chemistry 278(2): 485-489.
-
Aguiar VMC, Baptista NJA, Braga ES (2013) Nutrient Dynamics in A Pristine Subtropical Lagoon-Estuarine System. In: 1st (Edn.), London: LAP Lambert Academic Publishing AG & Co. KG 1: 60.
-
Azevedo JS, Serafim A, Company R, Braga ES, Favaro DIT, et al. (2009) Biomarkers of Exposure to Metal Contamination and Lipid Peroxidation in the Benthic Fish Cathorops Spixii from Two Estuaries in South America, Brazil. Ecotoxicology 18(8): 1001-1010.
-
Grasshoff K, Ehrhardt M, Kremling K (1983) Methods of Seawater Analysis. In: 2nd (Edn.), Verlag Chimie, Weinhein, pp: 419.
-
Lorenzen CJ (1967) Determination of Chlorophyll and Phaeo-Pigments: Spectrophotometric Equations. Limnology and Oceanography 12(2): 343-346.
-
Treguer P, Le Corre P (1975) Manuel d’analysis des sels Nutritifs Dans l’eau de mer. Universite de Bretagne Occidentale Brest, pp: 130.
-
Solorzano L (1969) Determination of Ammonia in Natural Waters by Phenol Hypochloride Method. Limnology and Oceanography 14(5): 799-801.
-
Suguio K (1973) Introduçao a sedimentologia. . Sao Paulo: Edgard Blücher, pp: 317.
-
Byers C, Mills EL, Stewart PL (1978) A Comparison of Methods of Determining Organic Carbon in Marine Sediments, with Suggestions for A Standard Methods. Hydrobiology 58(21): 43-47.
-
Sunback K (1983) Microphytobenthos on Sand in Shallow Brackish Water, Oresund, Sweeden. Primary Production, Chlorophyll A Content and Species Composition (Diatoms) in Relation to Some Ecological Factors. Department of Systematic Botany. University of Lund, pp: 209.
-
Lowry OH, Josebrough NJ, Farr AL, Randall RJ (1951) Protein Measurement with the Folin Phenol Reagent. J Biol Chem 193(1): 265-275.
-
Hartree EF (1972) Determination of Protein: A Modification of the Lowry Method that Gives A Linear Photometric Response. Anal Biochem 48(2): 422-427.
-
Gerchakov SM, Hatcher PG (1972) Improved Technique for Analysis of Carbohydrates in Sediments. Limnology and Oceanography 17(6): 938-943.
-
Bricker SB, Longstaff B, Dennison W, Jones A, Boicourt K, et al. (2008) Effects of Nutrient Enrichment in the Nation’s Estuaries: A Decade of Change. Harmful Algae 8(1): 21-32.
-
Zhang J, Gilbert D, Gooday AJ, Levin L, Naqvi SWA, et al. (2010) Natural and Human-Induced Hypoxia and Consequences for Coastal Areas: Synthesis and Future Development. Biogeosciences 7(5): 1443-1467.
-
Su J, Dai M, He B, Wang L, Gan J, et al. (2017) Tracing the Origin of the Oxygen-Consuming Organic Matter in the Hypoxic Zone in A Large Eutrophic Estuary: The Lower Reach of the Pearl River Estuary, China. Biogeosciences 14(18): 4085-4099.
-
Liuqian Y, Jianping G, Minhan D, Chiwing RH, Zhongming L, et al. (2021) Modeling the Role of Riverine Organic Matter in Hypoxia Formationwithin the Coastal Transition Zone Off the Pearl River Estuary. Limnology and Oceanogr 66(2): 452-468.
-
Conley DJHW, Paerl RW, Howarth DF, Boesch SP, Seitzinger KE, et al. (2009) Controlling Eutrophication: Nitrogen and Phosphorus. Science 323(5917): 1014- 1015.
-
Rabalais NN, Cai WJ, Carstensen J, Conley DJ, Rabalais NN, et al. (2014) Eutrophication-Driven Deoxygenation in the Coastal Ocean. Oceanography 27(1): 172-183.
-
Melo XF, Martin J, Kerdel L, Bourrin F, Colloca CB, et al. (2020) Particle Dynamics in Ushuaia Bay (Tierra del Fuego)-Potential Effect on Dissolved Oxygen Depletion. Water 12(2): 324.
-
Coffin MRS, Courtenay SC, Pater CC, van den Heuvel MR (2018) An Empirical Model Using Dissolved Oxygen as an Indicator for Eutrophication at A Regional Scale. Mar Pollut Bull 133: 261-270.
-
Berbel GBB, Favaro DIT, Braga ES (2015) Impact of Harbour, Industry and Sewage on the Phosphorus Geochemistry of a Subtropical Estuary in Brazil. Mar Pollut Bull 93(1-2): 44-52.
-
Sutti BO, Guimaraes LL, Borges RP, Braga ES (2022) River Flows Influence on Nutrients (Si, N and P) and Fecal Coliforms (E. coli) in Two Tributaries of the Estuarine Channel of Bertioga (Santos Estuary, Sao Paulo, Brazil). Journal of Geoscience and Environment Protection 10(6): 26-46.
-
Azevedo JS, Braga ES, Ribeiro CAO (2012) Nuclear Abnormalities in Erythrocytes and Morphometric Indexes in the Catfish Cathorops Spixii (Ariidae) from Different Sites on the Southeastern Brazilian Coast. Brazilian Journal of Oceanography 60(3): 323-330.
-
Azevedo JS, Braga ES, Silva de AHC, Oliveira RCA (2013) Biochemical Changes in the Liver and Gill of Cathorops Spixii Collected Seasonally in Two Brazilian Estuaries Under Varying Influences of Anthropogenic Activities. Ecotoxicol Environ Saf 96: 220-230.
-
Vezzulli L, Fabiano M (2006) Sediment Biochemical and Microbial Variables for the Evaluation of Trophic Status along the Italian and Albanian Continental Shelves. J Marine Bio Association of the United Kingdom 86(1): 27-37.
-
Danovaro R, Fabiano M, Dellacroce N (1993) Labile Organic-Matter and Microbial Biomasses in Deep-Sea Sediments (Eastern Mediterranean-Sea). Deep-Sea Research Part I: Oceanographic Research Papers 40(5): 953-965.
-
Cotano U, Villate F (2006) Anthropogenic Influence on the Organic Fraction of Sediments in Two Contrasting Estuaries: A Biochemical Approach. Mar Pollut Bull 52(4): 404-414.
-
Garcia RF, del Puerto L, Venturini N, Pita AL, Brugnoli E, et al. (2011) Diatoms, Protein And Carbohydrate Sediment Content As Proxies For Coastal Eutrophication In Montevideo, Rio De La Plata Estuary, Uruguay. Brazilian Journal of Oceanography 59(4): 293-298.
-
Venturini N, Pita AL, Brugnole E, Gracia RF, Butorn L, et al. (2012) Benthic Trophic Status of Sediments in a Metropolitan Area (Rio de la Plata Estuary): Linkages with Natural and Human Pressures. Estuarine Coastal and Shelf Sciences 112: 139-152.
-
Joseph MM, Ratheesh Kummar CS, Gireesh Kumar TR, Renjith KR, Chandramohanakumar N (2002) Biogeochemsitry of Surficial Sediments in the Intertidal Systens of a Tropical Environment. Chmemistry and Ecology 24(4): 247-258.
-
Moreno S, Niell FX (2004) Scales of Variability in the Sediment Chlorophyll Content of the Shallow Palmones River Estuary, Spain. Estuarine Coastal and Shelf Science 60(1): 49-57.
-
Fulfaro VJ, Ponçano WL (1976) Current sedimentation of the Estuary and Bay of Santos. A geological model applied to port area expansion projects. In: Proceedings of the 1st Brazilian Congress of Geology and Engineering, pp: 67-90.
-
Fulfaro VJ, Requejo CS, Landim PMB, Fulfaro R (1983) Distribuiçao de Elementos Metálicos nos Sedimentos da Baía de Santos, SP. In: Proceedings of the 4th Simpósio Regional de Geologia, pp: 275-289.
-
Fernández C, Lara RJ, Parodi ER (2021) Influence of Microphytobenthos on the Sedimentary Organic Matter Composition in Two Contrasting Estuarine Microhabitats. Environment Monitoring and Assessment 193: 201.
-
Kumar CSR, Gayathry OS, Rakesh VB, Sudha A, Roshni MPM, et al. (2022) Lipid Biomarkers as Organic Matter Source Indicators of Estuarine Mangrove Ecosystems. Chemistry and Ecology 38(6): 564-585.
-
Shilla DA (2021) Assessment of the Quality and Quantity of Organic Matter in the Rufiji Mangrove Surface Sediments Using Biogeochemical Composition. Tanzania Journal of Science 47(2).
-
Cheryan AS, Moushmi KS, Libinbaby, Chandramohanakuma N (2022) Sources and Degradation of Organic Matter and Its Relation to Trophic Status in the Core Sediments of a Tropical Mangrove Ecosystem along the Southwest Coast of India. Marine Chemistry 244(20): 104137.
- Genetic Improvement of Nile Tilapia (Oreochromis niloticus): Advances in Selective Breeding and Genomic Approaches for Sustainable Aquaculture
- Microplastics, Contaminants, and Waste Hotspots: Divergences and Faults in Prioritizing Control Efforts
- Creating a Healthier, More Vibrant Open and Closed Aquatic Environment. A Submersible, Centrifugal Magnetically Affixed Current Changing Aquarium Pump
- An Attempt to Assess Alpha Diversity and Sample Size: Using the Ostracod Assemblages off Kumamoto Port, Japan
- Assessment of the Efficiency of Common Fishing Gears and Crafts Used at Mohananda River of Chapai Nawabganj, Bangladesh
- Fish Productivity and Biodiversity Status of Sundarban Mangrove in Bangladesh