Life Cycle Environmental Impact Assessment of Aquaculture Products in the Gaza Strip, Palestine
This study used the life cycle assessment (LCA) approach to evaluate the environmental impacts resulting from aquaculture ponds and associated activities. The assessment focused on eutrophication, acidification, global warming, energy use, and local nutrient emissions. Two farms, Fish Fresh and Al-Bahar, were analyzed to determine the contribution of different components in fish farming systems to various impact categories. Data on fish feed, onsite electricity, feed milling electricity, fuel intensity, water input, and fish production were meticulously collected through a comprehensive questionnaire and insightful interviews conducted over a one-year period in 2020. Furthermore, valuable information was diligently gathered regarding the nitrogen and phosphorus emissions in aquaculture ponds, with a focus on feed inputs. Environmental indicators were evaluated using a functional unit of 1 ton and 1 kg of live fish weight. Results reveled that global warming impacts varied between the two farms, with feed production being the primary contributor, accounting for 74.73% and 76.30% of total emissions, respectively. Acidifying emissions were mainly generated through fish production, accounting for 74.8% and 76.3% of the total for Fish Fresh and Al-Bahar farms, respectively. Eutrophication was primarily driven by fish production, while feed production and transportation operations also made noticeable contributions. The average emissions per kilogram of fresh fish were higher for the Fish Fresh farm compared to Al-Bahar in terms of global warming, acidification, and eutrophication. Energy consumption and water dependence also varied between the farms. These findings emphasize the importance of considering environmental impacts throughout the life cycle of fish farming in the Gaza Strip.
Introduction
The aquaculture industry has become the leading driver of growth in the seafood sector [1, 2, 3]. However, aquaculture production faces sustainability challenges, including limited resources such as space, disease management, freshwater scarcity, and the sustainability of wild fish used as feed [4]. Due to the challenging political and economic circumstances in the Gaza Strip, the local population has resorted to the establishment of fish farms, commonly referred to as “fishponds,” as a means to accomplish their fish requirements. Although these fish farming initiatives play a vital role in supporting the local fisheries sector, their potential for growth is impeded by the substantial costs involved and the ongoing political and economic challenges prevailing in the region. According to the Ministry of Agriculture’s statistics from 2015 to 2020, the production volume of Seabream in the Gaza Strip has shown an increasing trend. In 2011, the recorded production was 159 tons, while in subsequent years, the production reached 220 tons in 2015, 250 tons in 2016, 435 tons in 2017, and further increased to 650 tons in 2019 and 750 tons in 2020 [5].
Feed is a significant contributor to macro-scale environmental impacts in fish farming, especially in intensive systems producing high-trophic-level species like salmon, trout, and sea bass. Studies have shown that feed accounts for a substantial portion of the climate change impact of fish farming, ranging from 73% to 93% in different farming systems and countries [6, 7]. Concerns arise regarding the composition of aquafeeds, as the use of organic compounds in salmon feeds has been found to be ineffective in reducing environmental impacts [8]. Animal by-products, such as fish and poultry, are identified as primary sources of these impacts. To alleviate pressure on biotic resources, replacing fish meal and oil with plant proteins and oils has been suggested, although it may lead to a decrease in net primary production and a slight increase in land use and earthly ecotoxicity impacts [9]. Feed efficiency, represented by the food conversion ratio (FCR), and nutrient efficiency are emphasized in farming systems, particularly in those integrating multiple species. In recirculating aquaculture systems, energy-related impacts predominantly arise from farm operations, resulting in the transfer of impacts from local to global scales [10, 11, 12]. However, studies have shown that the use of energy-efficient technologies for water treatment in recirculating trout farms can help limit the increase in global environmental impacts associated with energy use [13, 14]. The impacts of fish farming are primarily attributed to feed-ingredient production and farm effluents, resulting in the release of pharmaceuticals, disease spread, non-native species introduction, genetic stock reduction, and habitat devastation, leading to biodiversity loss [10]. Fish farming is closely linked to fisheries, being the largest consumer of fish meal and fish oil predominantly sourced from industrial pelagic fleets in South America and Norway [4, 15]. Some fish farming operations still rely on wild stocks for juveniles or brood stock [16]. Additionally, fishery activities have indirect impacts, including energy use, infrastructure construction, and feed component production [10, 17]. To address the escalating environmental impacts, methods are needed to improve fishery systems and inform decision-making, considering a multi-goal approach beyond the carbon footprint [18]. Life Cycle Assessment (LCA) is a tool used to analyze the environmental burdens of a product throughout its entire life cycle and has various applications in identifying sources of environmental impacts, comparing and designing products, and making selections. LCA quantifies environmental impacts based on functional components and encompasses different impact categories related to emissions and resource use. The baseline method for abiotic resource depletion uses problem-oriented and end-point categories as indicators [19].
Aquatic supply chains, including fish, molluscs, crustaceans, and algae, are facing increasing global demand [3]. However, concerns about the environmental implications have arisen due to the decline of wild-capture fisheries that supply the food and feed industries [20, 21]. Life cycle assessment has been used to study seafood production systems, with systematic reviews conducted on capture fisheries and aquaculture [22, 23, 24]. The unique characteristics of seafood production, such as extraction of fish stocks, impacts on unmapped ecosystems, and complex trophic webs, require novel impact categories in aquaculture LCAs, including biotic resource use and benthic ecosystem impacts. Feed resources from capture fisheries, agriculture, and livestock are crucial in aquaculture systems, necessitating comprehensive life cycle inventory (LCI) models [25]. LCA studies have analyzed various fisheries, such as coastal driftnet fisheries [26], gill net and trawl fisheries focusing on Swedish codfish [27], Danish seine trawl fisheries [17], Spain’s purse seine fishery of Tuna [28], and the canned Tuna industry [29]. Other studies have examined Mackerel canning [30], and Peruvian Hake fishery caught by mid-water trawls [25]. While there have been numerous LCA studies in Europe and North America, research in other regions is relatively scarce. It is crucial to analyze fisheries in different regions due to variations in fish species, fishing methods, and resource management, which can impact the results of environmental impact assessments [31].
Aquaculture operations serve a crucial role in meeting the global seafood demand, but they also come with environmental consequences, notably their contribution to climate change. The intensification and expansion of aquaculture give rise to various factors that significantly contribute to greenhouse gas emissions and climate change. These factors encompass the utilization of energy-intensive technologies, dependence on fossil fuels for transportation and power generation, the release of greenhouse gases from aquaculture ponds, and the environmental impact of feed production. It is of paramount importance to comprehend and address the climate change impacts on aquaculture operations to ensure sustainable and responsible seafood production [32]. Aquaculture has emerged as a lucrative sub-sector of fisheries in Gaza, presenting promising opportunities for private investors. In the Gaza Strip, tilapia culture in inland areas has a long-established history and has shown potential with successful harvests in small ponds and irrigation systems. Recently, an innovative marine cage aquaculture project, specifically designed to meet the needs of the Gaza fishing community, was implemented as a pilot project in the Mediterranean. With support from the Food and Agriculture Organization of the United Nations (FAO) and the Italian Government, the Gaza Strip’s first-ever marine cage farm for sea bream aquaculture was established approximately four nautical miles off the shores of Deir Al- Balah. This initiative demonstrates the potential for growth in the aquaculture sector, paving the way for more successful ventures. To foster the development of the fish farming sub-sector and create improved employment and income opportunities for the communities, Gaza needs to continue expanding its aquaculture infrastructure both at sea and on land. The goal is to establish a modern aquaculture framework that aligns with 21st-century practices. As part of this study, two representative aquaculture farms, Al- Bahar and Fish Fresh, were selected to provide insights into the aquaculture sector in the Gaza Strip. These farms were visited multiple times during the sampling process. Both farms primarily relied on saline water from onshore wells as their main water source and discharged wastewater directly into the sea during water exchange and harvest, without undergoing any treatment. However, despite the significant nutrient release from aquaculture ponds, a comprehensive assessment of the nutrient release has not been conducted. Hence, the environmental impacts of two selected farms (Fish Fresh and Al-Bahar) located along the coastline of the Gaza Strip were investigated. Using life cycle assessment, the study aimed to estimate the amount of nitrogen and phosphorus released from aquaculture ponds into the sea off Gaza. Detailed interviews with aquaculture managers were conducted to calculate the fractions of released nitrogen and phosphorus based on the total nitrogen and phosphorus added through feed input in a pond per year. The study also determined potential emissions of CO2, NOx, and SO2 from aquaculture ponds and other activities.
Materials and Methods
Study Area
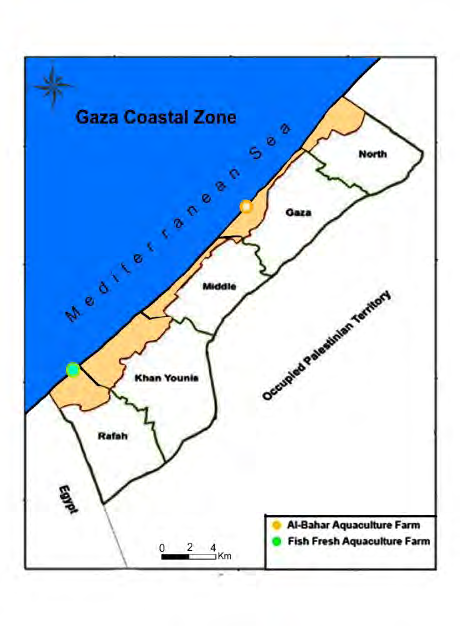
Fish farming plays an important role in the Gaza Strip, presenting significant economic opportunities if expanded [5]. Currently, two main aquaculture farms are operational in Gaza, namely Al Bahar farm and Fish Fresh farm (Figure 1).
Al-Bahar farm, established in 2014 in the Gaza Governorate, covers an area of approximately 16,000 square meters. Situated near the beach of Gaza (coordinates: 31° 29’ 22.02” N, 34° 24’ 6.8394” E), the farm utilizes around 13,440 cubic meters of marine saline water from onshore wells. The farm operates in a semi-intensive manner and comprises 30 cylindrical ponds used for overfeeding and hatchery purposes. The wastewater is directly discharged into the sea through manholes without undergoing any treatment. Farm workers monitor the ammonia levels and salinity in the pipes to ensure suitable conditions for fish farming. Additionally, copper sulphate is employed to combat fish diseases in the ponds. Fish Fresh farm, established in 2009 in the Rafah Governorate located in the southern part of the Gaza Strip, occupies an area of approximately 32,000 square meters. The farm is situated near the beach of Rafah (coordinates: 31° 20’ 37.6074” N, 34° 14’ 44.1954” E) and relies on 28,800 cubic meters of marine saline water from onshore wells as its water supply. Similar to Al Bahar farm, Fish Fresh operates in a semi-intensive manner and comprises 25 cylindrical ponds primarily used for overfeeding. The water is sourced from beach wells. Trained workers are responsible for monitoring ammonia, dissolved oxygen, temperature, and salinity levels in the pipes. However, no sterilization methods are implemented within the farm to control fish diseases.
Data Sources of LCA and Process
By following these steps and using the LCA approach along with appropriate software and methodologies, the study obtained numerical results for the global warming impact on the atmosphere resulting from the assessed aquaculture farms in the Gaza Strip. • Data Collection: The study collected data through questionnaires and interviews conducted with managers, workers, and experts from two farms, Fish Fresh and Al-Bahar, over a period of one year. The questionnaires were designed based on those used for fish farms in Lebanon by the General Fisheries Commission for the Mediterranean (GFCM) of the Food and Agriculture Organization.
• Environmental Parameters: The assessment focused on multiple environmental parameters, including eutrophication, acidification, global warming, energy use, and local nutrient emissions. The questionnaires and interviews were specifically aimed at gathering information related to these parameters.
• Calculation of Emissions: The collected data was analyzed to calculate the potential emissions of CO2, NOx, and SO2. Additionally, the percentages of nitrogen and phosphorus emitted relative to the annual feed inputs were determined. These calculations provided insights into nutrient emissions in aquaculture ponds, including their contribution to global warming.
• Life Cycle Assessment Process: The study employed the LCA approach, which involved several steps. These steps included defining production objectives and scope, conducting a Life Cycle Inventory (LCI), performing impact analysis and evaluation, and interpreting the results for recommendations.
• LCI using Sphera GaBi Software: The Life Cycle Inventory was conducted using the Sphera GaBi software (version 9.5.1) with a professional database. This software platform enabled the assessment and comparison of energy demand and environmental impacts throughout the life cycle of farmed fish products, including production, collection, transportation, and processing.
• Eutrophication Index: To evaluate the potential effects of high nutrient levels on eutrophication, a eutrophication index was calculated. This index primarily focused on nitrogen (N) and phosphorus (P) levels in the environment, providing insights into the environmental implications associated with aquaculture practices.
Results and Discussion
Main Characteristics of the Aquaculture Production System in Gaza
The two studied systems can be distinguished based on various factors, including feed efficiency, electricity usage, fuel intensity, water consumption, fish production, facilities, technologies employed, and management practices. The descriptions provided below are based on the operational data from two real seabream farms over a year of production, with the reference year being 2020 for both farms. These farms, named Al-Bahar and Fish Fresh, are situated along the coastal areas of Gaza City and Rafah City in the Gaza Strip. They are specifically dedicated to the cultivation of seabream, starting from 1 gram and reaching an average weight of 450 grams in approximately 15 months. The farms consist of circular ponds, with Al-Bahar having 25 ponds and Fish Fresh having 32 ponds, each with a different volume capacity. These ponds are supplied with recirculated water. The water used in the farms is drawn from drilling wells near the seashore and undergoes a recycling process. Mechanical filters are employed to remove solids from the rearing tanks, while biological filters convert ammonia into nitrate. The sludge obtained from the filtration process is disposed of in the surrounding environment near the Gaza coast. Approximately 50% of the water in the ponds is replaced daily, resulting in a daily water input of 28,800 cubic meters for Al-Bahar and 13,440 cubic meters for Fish Fresh. The water depth in each pond is 2.5 meters, and the average water flow rate is 1200 cubic meters per hour for Al-Bahar and 560 cubic meters per hour for Fish Fresh. Both farms are equipped with on-land facilities for stocking feeds and materials, as well as for net cleaning. The annual biomass gain is approximately 450 tons for Al-Bahar and 300 tons for Fish Fresh. The feeds used in these farms have an average composition declared by the manufacturer, which includes 45% protein, 12% lipids, and 1.3% phosphorus. Table 1 provides a summary of the fundamental inventory data for both aquaculture farm systems.
| Farm/Material | Al-Bahar | Fish Fresh |
|---|---|---|
| Fish Feed (ton) | 366.5 | 660 |
| On-site electricity (kwh) | 12,00,000 | 14,40,000 |
| Feed milling electricity (kwh) | 132600 | 198900 |
| Fuel intensity (litre) | 48000 | 57600 |
| Water input (m3) | 4905600 | 10512000 |
| Fish production (ton) | 300 | 450 |
Table 1: Summary of the inventory data for aquaculture system (2020).
Impact Categories
The study considered several impact categories, including global warming, acidification, and eutrophication (emissions to the atmosphere), energy use, water dependency, and eutrophication in water (nitrogen and phosphorus). Global warming was calculated based on the global warming potential 100 factors used by the Intergovernmental Panel on Climate Change (IPCC), expressed in kg CO2-equivalents. Acidification was assessed using average European acidification potential factors and expressed in kg SO2- equivalents. Eutrophication released to the atmosphere was calculated using specific factors and expressed in kg PO4-equivalents. Eutrophication in water, referring to the impacts of nutrient levels, particularly nitrogen and phosphorus, was calculated using established factors [19]. Energy use accounted for fossil fuel and hydropower electricity consumption, expressed in MJ. A new impact category, water dependence, was introduced, measuring the water input relative to fish biomass production at the farm level. Water dependence considered the water input pumped from drilling wells divided by the fish growth, expressed in cubic meters. All environmental indicators were calculated based on a functional unit of 1 ton or 1 kg of live fish weight at harvest. To understand the contribution of system parts to the impact categories, the following system components were identified: (1) fish production, i.e., the emissions induced by the biological transformation of feeds at the farm level and energy carriers used on the farm as electricity, including their production and transportation.; (2) feeds, including production of feed, processing, and transportation; (3) equipment, including its transport and use; and (4) energy carriers used on the farm (Diesel), including their transportation.
Environmental Analysis Using LCA Impact Categories
The assessment of environmental impacts in aquaculture systems can be challenging due to the diverse characteristics of production systems, such as species, water conditions, infrastructure, and location. However, this study aims to provide a preliminary estimate of potential environmental impacts using the life cycle assessment method. Previous literature suggests that three key factors have the greatest influence on environmental impacts: feeds and their management, energy consumption and sources, and water characteristics and requirements. These factors have been identified and discussed in various LCA studies, including those by [8, 24, 33, 34]. Although comparing the environmental impacts of different production systems may seem complex at first glance, this study attempts to provide insights into these impacts based on the analysis of three specific farms. The agreement regarding the significance of these factors in identifying environmental impacts is summarized in Table 2 and discussed in the following sections.
| Fish Production | Feed Production | Transportation | Total | |
|---|---|---|---|---|
| Global warming (kg CO -eq) 2 | ||||
| Fish Fresh Farm | 950.4 | 131.27 | 190.1 | 1271.77 |
| Al-Bahar Farm | 792 | 87.52 | 158.4 | 1037.92 |
| Acidification (kg SO -eq) 2 | ||||
| Fish Fresh Farm | 9.216 | 1.27 | 1.843 | 12.329 |
| Al-Bahar Farm | 7.68 | 0.848 | 1.536 | 10.064 |
| Eutrophication (kg PO -eq) 4 | ||||
| Fish Fresh Farm | 17.28 | 2.386 | 3.456 | 23.122 |
| Al-Bahar Farm | 14.4 | 1.591 | 2.88 | 18.871 |
| Energy use (MJ) | ||||
| Fish Fresh Farm | 11520 | 1591.2 | 2304 | 15415.2 |
| Al-Bahar Farm | 14400 | 1591.2 | 2880 | 18871.2 |
| Water dependency (m3) | ||||
| Fish Fresh Farm | 29200 | - | - | 29200 |
| Al-Bahar Farm | 20440 | - | - | 20440 |
| Total N | ||||
| Fish Fresh Farm | 58.4 | - | - | 58.4 |
| Al-Bahar Farm | 40.9 | - | - | 40.9 |
| Total P | ||||
| Fish Fresh Farm | 9.13 | - | - | 9.13 |
| Al-Bahar Farm | 6.39 | - | - | 6.39 |
Table 2: Environmental impacts per 1000 kg of live fish by system components.
In this study, the life cycle assessment approach, a widely accepted standardized method [33, 35, 36], was employed to evaluate the environmental impacts of fish and aquaculture products. The functional unit chosen was the delivery of 1 tonne or 1 kg of aquaculture product to the first buyer. Relevant environmental impact categories were selected based on previous research [8, 34]. These categories included eutrophication (kg PO4 eq.), which assesses NOx impacts on the atmosphere; acidification (kg SO2 eq.), which evaluates potential acidification from emitted acidifying molecules; global warming (kg CO2 eq.), which measures greenhouse gas production; energy use (MJ), encompassing all energy resources utilized; and local nutrient emissions (nitrogen and phosphorus enrichment) associated with fish growth, estimated through nutrient-balance modeling [37]. This modeling approach has been adapted and validated for various fish species [38, 39], and previously utilized to establish emissions inventories of fish-production systems [13, 40]. Building on previous studies [7, 41], the LCA work undertaken in this study drew from the experience of similar approaches in aquaculture.
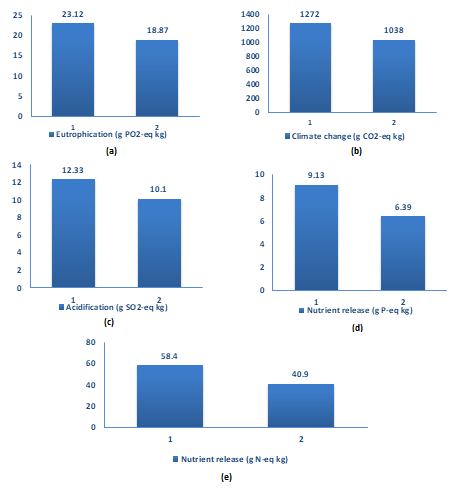
The study assessed the contribution of different components in the fish farming systems to various impact categories for two farms (Table 2). Global warming impacts varied between the Fish Fresh and Al-Bahar farms. The primary contributor to global warming was feed production, accounting for 74.73% and 76.30% of the total emissions, respectively. This is primarily due to the energy carriers involved in the agricultural, fishery, and processing phases. Consequently, the absolute level of global warming emissions was higher for the Fish Fresh farm (1271.77 kg CO2-eq) compared to Al-Bahar (1037.92 kg CO2-eq), representing 15.26% of their respective totals. Feed production at the farm level contributed less to global warming, with percentages of 10.32% and 8.43% for the Fish Fresh and Al-Bahar farms, respectively. According to calculations based on 2020 data, the average emissions per kilogram of fresh fish were higher for the Fish Fresh farm (1272 g CO2-eq/kg) compared to Al- Bahar (1038 g CO2-eq/kg) (Figure 2).
- Fish Fresh Farm
- Al-Bahar Farm Both farms primarily generated acidifying emissions through fish production, accounting for 74.8% and 76.3% of the total, respectively. This acidification is linked to the energy used in fish processing. Transportation operations also made noticeable contributions to acidification, representing
14.95% for the Fish Fresh farm and 15.26% for the Al-Bahar fish farm. Acidifying emissions were considerably higher for the Fish Fresh farm (12.329 kg SO2-eq/ton) than the Al- Bahar fish farm (10.064 kg SO2-eq/ton). Contributions to feed production slightly differed between the two systems, with average emissions per kilogram of fresh fish being higher for the Fish Fresh farm (12.33 g SO2-eq/kg) compared to Al-Bahar (10.1 g SO2-eq/kg) (Figure 2). Eutrophication is primarily driven by fish production at the farm level, accounting for 74.73%–76.30% of the total impact due to the direct release of nutrients into the aquatic environment. Feed production contributes only 10.31%–8.43% to the overall potential impact. Transportation operations also make noticeable contributions to eutrophication emissions, with Al-Bahar farm production systems having higher contributions of 15.26% and 14.95%, respectively.
The average emissions produced per kilogram of fresh fish were higher for the Fish Fresh farm (23.12 g SO2-eq/ kg) compared to Al-Bahar (18.87 g SO2-eq/kg) (Figure 2). Among the three gas emissions, CO2 accounts for the largest proportion compared to SO2 and NOx. The Al-Bahar farm consumes more energy than the Fish Fresh farm, with energy consumption levels of 18871.2 MJ and 15415.2 MJ per live ton of fish produced, respectively. Water dependence differs significantly between the two farms, with the Fish Fresh farm requiring 29200 m3 of water per ton of fish produced, while Al-Bahar requires 20440 m3.
Eutrophication is directly related to nutrient loading at the farm scale. The calculated nutrient loading in this study (Table 2) differs from data obtained by other authors. The values obtained (58.4 g N kg1-40.9 g N kg1 of fish) (9.13 g P kg1-6.39 g P kg1 of fish) are slightly higher than those reported by Mallekh R, et al. [42] (51 g N kg1 of fish and 8.7 g P kg1 of fish), possibly due to their study being conducted in tanks, which induced a low feed conversion ratio (FCR) of 0.96. Boujard T, et al. [43] observed a wider range of values for Seabass farming, with 91 g N kg1 of fish and 18.7 g P kg1 of fish. Considering the relative homogeneity in the diets of these carnivorous species and the high digestibility of the components, the feed conversion ratio appears to be the major factor contributing to the observed variation, as shown by Papatryphon E, et al. [40] in Trout farms in France.
Conclusion
Based on the life cycle assessment results, global warming emerges as the most significant environmental impact throughout the life cycle of a fresh fish product. It can be concluded that in both the Fish Fresh and Al-Bahar farm systems, feed production makes the largest contribution, accounting for 74.73% and 76.30% respectively. This contribution is due to the inclusion of energy sources in various phases such as farming, fishing, and processing. Consequently, this characteristic leads to higher absolute levels of global warming-related emissions, amounting to 1271.77 kg CO2-eq per ton in the Fish Fresh Farm and 1037.92 kg CO2-eq per ton in Al-Bahar, representing a difference of 15.26%. In comparison, feed production for the farms contributes less to global warming, accounting for
10.32% and 8.43% respectively, when compared to other components in the system.
When examining the average emissions per kilogram of fresh fish, it is observed that the Fish Fresh farm has higher emissions compared to Al-Bahar, with values of 23.12 g SO2- eq/kg and 18.87 g SO2-eq/kg, respectively. Among the three gas emissions considered, CO2 is known to be responsible for the largest share of emissions in comparison to SO2 and NOx. In terms of energy consumption, the Al-Bahar farm consumes more energy than the Fish Fresh farm, with levels of 18871.2 MJ and 15415.2 MJ per ton of live fish produced, respectively. Eutrophication is linked to nutrient loading at farms. Our study’s nutrient loading differs from other findings. In Fish Fresh and Al-Bahar farms, values obtained (58.4-40.9 g N1 kg of fish, 9.13-6.39 g P kg1 of fish) are slightly higher than Mallekh R, et al. [42] (51 g N kg1, 8.7 g P kg1). Water dependence also exhibits a significant difference between the production systems of the two farms, with the Fish Fresh farm requiring 29200 m3 of water per ton of fish produced, while Al-Bahar requires 20440 m3.
References
-
Godfray HCJ, Beddington JR, Crute IR, Haddad L, Lawrence D, et al. (2010) Food Security: The Challenge of Feeding 9 Billion People. Science 327(5967): 812-818.
-
Allison E (2011) Aquaculture, Fisheries, Poverty and Food Security. Working Paper 2011-65. The World Fish Center, pp: 62.
-
Food and Agricultural Organization of the United Nations (FAO) (2016) The state of world fisheries and aquaculture 2016. Contributing to food security and nutrition for all, pp: 204.
-
Naylor RL, Goldburg RJ, Primavera JH, Kautsky N, Beveridge MCM, et al. (2000) Effect of aquaculture on world fish supplies. Nature 405(6790): 1017-1024.
-
Hussein DMA, Lucchetti M, Zaqoot HA, Penca, J, Hussein M (2022) Status of Fisheries in Gaza Strip: Past Trends and Challenges. International Journal of European and Mediterranean Studies 15(2): 179-216.
-
Pelletier N, Tyedmers P, Sonesson U, Scholz A, Ziegler F, et al. (2009) Not all salmon are created equal: Life cycle assessment (LCA) of global salmon farming systems. Environmental Science and Technology 43(23): 8730- 8736.
-
Aubin J, Papatryphon E, van der Werf HMG, Chatzifotis S (2009) Assessment of the environmental impact of carnivorous finfish production systems using life cycle assessment. Journal of Cleaner Production 17(3): 354- 361.
-
Pelletier NL, Ayer NW, Tyedmers PH, Kruse SA, Flysjo A, et al. (2007) Impact categories for life cycle assessment research of seafood production systems: Review and prospectus. International Journal of Life Cycle Assessment 12(6): 414-421.
-
Boissy J, Aubin J, Drissi A, van der Werf HMG, Bell GJ, et al. (2011) Environmental impacts of plant-based salmonid diets at feed and farm scales. Aquaculture 321(1-2): 61- 70.
-
Pelletier N, Tyedmers P (2008) Life Cycle Considerations for Improving Sustainability Assessments in Seafood Awareness Campaigns. Environmental Management 42(5): 918-931.
-
Efole Ewoukem T, Aubin J, Mikolasek O, Corson MS, Tomedi Eyango M, et al. (2012) Environmental impacts of farms integrating aquaculture and agriculture in Cameroon. Journal of Cleaner Production 28: 208-214.
-
Jerbi MA, Aubin J, Garnaoui K, Achour L, Kacem A (2012) Life cycle assessment (LCA) of two rearing techniques of sea bass (Dicentrarchus labrax). Aquacultural Engineering 46(1): 1-9.
-
Aubin J, Papatryphon E, Van der Werf HMG, Petit J, Morvan YM (2006) Characterisation of the environmental impact of a turbot (Scophthalmus maximus) re-circulating production system using life cycle assessment. Aquaculture 261(4): 1259-1268.
-
Ayer N, Côté RP, Tyedmers PH, Martin Willison JH (2009) Sustainability of seafood production and consumption: an introduction to the special issue. Journal of Cleaner Production 17(3): 321-324.
-
Tacon AGJ, Metian M (2008) Global overview on the use of fish meal and fish oil in industrially compounded aquafeeds: Trends and future prospects. Aquaculture 285(1-4): 146-158.
-
Mungkung RT, de Haes HAU, Clift R (2006) Potentials and limitations of life cycle assessment in setting ecolabelling criteria: A case study of Thai shrimp aquaculture product. International Journal of Life Cycle Assessment 11: 55-59.
-
Thrane M (2004). Energy Consumption in the Danish Fishery: Identification of Key Factors. Journal of Industrial Ecology 8(1-2): 223-239.
-
Samuel Fitwi B, Wuertz S, Schroeder JP, Schulz C (2012) Sustainability assessment tools to support aquaculture development. Journal of Cleaner Production 32: 183-
-
Guinée JB (2002) Handbook on life cycle assessment operational guide to the ISO standards. The International Journal of Life Cycle Assessment 7: 311-313.
-
Pauly D, Zeller D (2016) Catch reconstructions reveal that global marine fisheries catches are higher than reported and declining. Nature Communications 7(1): 10244.
-
Ziegler F, Hornborg S, Green BS, Eigaard OR, Farmery AK, et al. (2016) Expanding the concept of sustainable seafood using Life Cycle Assessment. Fish and Fisheries 17(4): 1073-1093.
-
Vázquez Rowe I, Hospido A, Moreira MT, Feijoo G (2012) Best practices in life cycle assessment implementation in fisheries. Improving and broadening environmental assessment for seafood production systems. Trends in Food Science & Technology 28(2): 116-131.
-
Avadí A, Fréon P (2013) Life cycle assessment of fisheries: A review for fisheries scientists and managers. Fisheries Research 143: 21-38.
-
Henriksson PJG, Guinée JB, Kleijn R, De Snoo GR (2012) Life cycle assessment of aquaculture systems-A review of methodologies. International Journal of Life Cycle Assessment 17(3): 304-313.
-
Avadí A, Henriksson PJG, Vázquez Rowe I, Ziegler F (2018) Towards improved practices in Life Cycle Assessment of seafood and other aquatic products. The International Journal of Life Cycle Assessment 23(5): 979-981.
-
Villanueva Rey P, Vázquez Rowe I, Arias A, Moreira MT, Feijoo G (2018) The importance of using life cycle assessment in policy support to determine the sustainability of fishing fleets: a case study for the small- scale xeito fishery in Galicia, Spain. International Journal of Life Cycle Assessment 23(5): 1091-1106.
-
Ziegler F, Hansson PA (2003) Emissions from fuel combustion in Swedish cod fishery. Journal of Cleaner Production 11(3): 303-314.
-
Hospido A, Tyedmers P (2005) Life cycle environmental impacts of Spanish tuna fisheries. Fisheries Research 76(2): 174-186.
-
Hospido A, Vazquez ME, Cuevas A, Feijoo G, Moreira MT (2006) Environmental assessment of canned tuna manufacture with a life-cycle perspective. Resources Conservation and Recycling 47(1): 56-72.
-
Ando T, Hasegawa K (2011) Estimating the Life Cycle CO2 (LC-CO2) of Canned Mackerel (Scomber spp.) and its Potential as an Environmental Education Tool. A Case Study (2008) at Choshi City, Chiba Prefecture. J Fish Technol 3(2): 99-105.
-
Parker R (2018) Implications of high animal by-product feed inputs in life cycle assessments of farmed Atlantic salmon. International Journal of Life Cycle Assessment 23(5): 982-994.
-
Food and Agricultural Organization of the United Nations (FAO) (2018) Impacts of climate change on fisheries and aquaculture Synthesis of current knowledge, adaptation and mitigation options. FAO fisheries and aquaculture, pp: 627.
-
Jolliet O, Saadé M, Crettaz P (2005) Analyse du cycle de vie, comprendre et réaliser un écobilan. Life Cycle Assessment: understand and perform an Eco-balance. Lausanne: Presses polytechniques et universitaires romandes.
-
Aubin J (2013) Life Cycle Assessment as applied to environmental choices regarding farmed or wild- caught fish. CAB Reviews: Perspectives in Agriculture, Veterinary Science, Nutrition and Natural Resources.
-
ISO (2006) ISO 14040: environmental management— life cycle assessment—principles and framework. International Organization for Standardization, pp: 1-46.
-
ISO (2006) ISO 14044: environmental management— life cycle assessment—requirements and guidelines. International Organization for Standardization, pp: 1-20.
-
Cho CY, Kaushik SJ (1990) Nutritional Energetics in Fish: Energy and Protein Utilization in Rainbow Trout (Salmo gairdneri). World Review of Nutrition and Dietetics 61: 132-172.
-
Kaushik SJ (1998) Whole body amino acid composition of European seabass (Dicentrarchus labrax), gilthead seabream (Sparus aurata) and turbot (Psetta maxima) with an estimation of their IAA requirement profiles. Aquatic Living Resources 11(5): 355-358.
-
Bureau DP, Kaushik SJ, Cho CY (2002) Bioenergetics. In: Halver JE, Hardy RW, et al. (Eds.), Fish Nutrition. Academic Press, San Diego, California, pp: 1-53.
-
Papatryphon E, Petit J, Kaushik SJ, Van Der Werf HMG (2004) Environmental Impact Assessment of Salmonid Feeds Using Life Cycle Assessment (LCA). Ambio 33(6): 316-323.
-
Aubin J, Van der Werf H M (2009) Fish farming and the environment: A life cycle assessment approach. Cahiers Agricultures 18(2): 220-226.
-
Mallekh R, Boujard T, Lagardère JP (1999) Evaluation of Retention and Environmental Discharge of Nitrogen and Phosphorus by Farmed Turbot (Scophthalmus maximus).
-
Boujard T, Gélineau A, Covès D, Corraze G, Dutto G, et al. (2004) Regulation of feed intake, growth, nutrient and energy utilisation in European sea bass (Dicentrarchus labrax) fed high fat diets. Aquaculture 231(1-4): 529- 545.
- Genetic Improvement of Nile Tilapia (Oreochromis niloticus): Advances in Selective Breeding and Genomic Approaches for Sustainable Aquaculture
- Microplastics, Contaminants, and Waste Hotspots: Divergences and Faults in Prioritizing Control Efforts
- Creating a Healthier, More Vibrant Open and Closed Aquatic Environment. A Submersible, Centrifugal Magnetically Affixed Current Changing Aquarium Pump
- An Attempt to Assess Alpha Diversity and Sample Size: Using the Ostracod Assemblages off Kumamoto Port, Japan
- Assessment of the Efficiency of Common Fishing Gears and Crafts Used at Mohananda River of Chapai Nawabganj, Bangladesh
- Fish Productivity and Biodiversity Status of Sundarban Mangrove in Bangladesh