Growth Performance and Nutrient Utilization of Nile Tilapia (Oreochromis niloticus) Fed Processed Duckweed (Lemna paucicostata) Meal as Protein Source
Growth performance and nutrient utilization of Nile tilapia (Oreochromis niloticus) fed processed duckweed (Lemna paucicostata) meal were evaluated. Blanching and sun-drying were employed as the processing methods. The blanched and sun-dried duckweed meals were used to replace toasted soybean meal in the diets of Nile tilapia at 25%, 50%, 75%, and 100% each. Nine iso-proteinous diets were formulated using the least cost feed formulation software. The feeding trials were conducted in 27 Hapa nets measuring 1m2 each for 24 weeks. Ten fingerlings of Nile tilapia were stocked per Hapa and fed three times daily at 5% biomass. The fish fed 75% blanched duckweed meal had the best mean weight gain (460.59g), feed conversion ratio (1.82) and protein efficiency ratio (12.67) while the fish fed 100% inclusion level of sun-dried duckweed meal and 100% of blanched duckweed meal diet had the poor mean weight gain, feed conversion ratio and protein efficiency ratio of 401.69g and 394.03g, 2.06 and 2.10, 11.05 and 10.37, respectively. This study revealed that blanched duckweed meal can replace toasted soybean meal in the diet of Nile tilapia at 75% without any unpropitious effect on the growth performance and nutrient utilization.
Introduction
Aquaculture production retained its growth trend in 2020 amidst the worldwide escalation of the COVID-19 pandemic, even though with differences among regions and among producing countries within each region [1]. African aquaculture (excluding algae) suffered from a superficial contraction in its annual production with about 1.2 percent decreased in 2020 when compared to 2019, mainly the result of the drop in production in Egypt, Africa’s major producer. In Nigeria, the largest producer in sub-Saharan Africa, the declining trend since 2016 worsened in 2020 with a sharp decrease of 9.6 percent [1].
The high cost of quality fish feed is one of the problems militating against the development of aquaculture [2]. This might not be unconnected to the scarcity and high cost of some conventional protein feedstuffs like soybean meal due to an ever-increasing demand as a staple food for man, raw material in industries and feed ingredients in farm animals [3]. However, the major problems confronting the fish farming industry are the increasing cost of feed ingredients in the local market [4].
The use of plant protein sources such as soybeans in the fish diet may not be profitable because it is very expensive being that it serves as a good source of protein for humans. FAO [5] reported that the shortage of soybeans in Nigeria caused a hike in its price by up to 193%. Expensive fish feed ingredients will significantly increase the cost of production and in return reduce profitability. Thus, there is an urgent need to identify other protein-rich plant sources that could substitute soybean meal in the fish diet.
Duckweed (Lemna paucicostata) is a small, free-floating aquatic plant that grows well in static and nutrient-rich freshwater or a brackish aquatic medium [6]. It biomass of doubles in 2 to 3 days under ideal conditions of nutrient availability, sunlight, pH (6.5-7.5), and temperature (20°C to 30°C) [7]. There are about 40 duckweed plant species worldwide the major ones are of the four genera; Spirodela, Lemna, Wolffiella and Wolfilla [8]. This plant is very rich in nutrients. Different authors reported varying amounts of nutrients in duckweed [9]. The plant is rich in both macro and micro minerals such as calcium and chlorine. Generally, duckweed contains 6.8 to 45% crude protein, 1.8 to 9.2% crude lipid, 5.7 to 16.2% crude fibre, 12 to 27.6% ash, and the carbohydrate content is in the range of 14.1- 43.6% on a dry matter basis [7]. The nutrient composition in each duckweed species varies depending on the condition of the water environment [10]. Duckweed is suitable for animal consumption and is rich in invaluable nutrients [11]. Fresh duckweed has been successfully used as feedstuffs for common carp, silver carp and tilapia [8]. Other non- conventional plant-based proteins such as duckweed can be cultured easily and has the nutritional potential of replacing soybean meal in the diets but possess a variety of antinutritional factors which are known to decrease the availability of nutrients and become increasingly toxic with increasing amounts ingested, although processing, such as sun-drying and blanching can reduce the anti-nutritional content in the feed ingredients [6]. Therefore, these processing methods were employed to reduce the levels of antinutrients. The use of duckweed meal as a fish feed ingredient in the diets of Oreochromis niloticus has not been fully explored. Thus, this study aimed to evaluate the effects of blanched and sun-dried duckweed (Lemna paucicostata) meal as protein sources in complete replacement for soybean meal on growth performance and nutrient utilization of Nile tilapia.
Materials and Methods
Experimental Site
The experiment was conducted outdoors, in concrete ponds of the Department of Fisheries and Aquaculture, Faculty of Agriculture, Ahmadu Bello University, Zaria which falls within latitude 11° 17’North and longitude 7° 63’East in the northern guinea savannah zone of Nigeria [12].
Procurement of Experimental Fish
Three hundred fingerlings of Oreochromis niloticus with an initial mean weight of 7.46g were procured from Kuka Farm, Gabasawa, Kano State and transported in an oxygenated polythene bag placed in 50 litres “Jerry-can”.
Collection and Culture Duckweed (Lemna paucicostata)
Fresh duckweed was collected during raining season from a burrow pit at Hanwa Low-cost, Kwangila, Zaria, Kaduna State, with a hand net and transported in nylon bags. The fresh Lemna paucicostata was cultured for two months in concrete ponds at the Department of Fisheries and Aquaculture, Faculty of Agriculture, Ahmadu Bello University, Zaria. The cultured Lemna paucicostata was used for the experiment.
Processing of Duckweed Meal and Soybean Meal
Blanching and sun-drying methods were used to process the cultured duckweed samples while toasting was used to process the soybean meal. Blanching was done by boiling duckweed in water for 5 minutes at 100°C as described by Abdullahi AI, et al. [10]. The blanched L. paucicostata were milled into a fine powder and sieved through a 0.5 mm mesh screen and their samples were analyzed for their proximate composition, amino acids profile, and mineral and antinutrients contents. The second treatment involved sun drying duckweed under hygienic conditions for three (3) days [10]. After which the sun-dried L. paucicostata were then milled into a fine powder and sieved through a 0.5 mm mesh screen and their samples were analyzed for proximate composition, amino acid profile, and mineral and antinutrients contents.
Proximate Composition of the Experimental Diet
The proximate composition (moisture, crude protein, lipid crude fibre, ash and nitrogen-free extracts) of the experimental diets was determined using the methods of the Association of Official Analytical Chemists [13].
Gross Energy Values
The gross energy values in kilo-calories of the leaf samples and feed were calculated as described by Pauzenga [14].
GE = (Crude protein x 37) + (ether extract x 81.8) + (nitrogen- free extract x 35) Kcal.
Experimental Diets
Nine iso-nitrogenous diets (D1-D9) were formulated using least cost feed formulation software (Feed Solution Software version 2022) which took into consideration the cost and the nutritive value of the ingredients. The soybean meal which serves as the control in the diets was replaced by blanched duckweed meal and sun-dried duckweed meal at 25%, 50%, 75% and 100% each. All the feed ingredients were integrated into computing, at the required quantities to make up a 100-unit quantity of the feed. Ingredient compositions of the experimental diets are resented in Table 1.
| Ingredients | D 1 | D 2 | D 3 | D 4 | D 5 | D 6 | D 7 | D 8 | D 9 |
|---|---|---|---|---|---|---|---|---|---|
| Soybean meal | 23.74 | 17.81 | 11.87 | 5.93 | 0 | 17.81 | 11.87 | 5.93 | 0 |
| Blanched L. paucicostata | 0 | 5.93 | 11.87 | 17.81 | 23.74 | - | - | - | - |
| Sun-dried L. paucicostata | - | - | - | - | - | 5.93 | 11.87 | 17.81 | 23.74 |
| Fish meal | 11.87 | 11.87 | 11.87 | 11.87 | 11.87 | 11.87 | 11.87 | 11.87 | 11.87 |
| Groundnut cake | 35.61 | 35.61 | 35.61 | 35.61 | 35.61 | 35.61 | 35.61 | 35.61 | 35.61 |
| Maize | 9.39 | 9.39 | 9.39 | 9.39 | 9.39 | 9.39 | 9.39 | 9.39 | 9.39 |
| Wheat bran | 9.39 | 9.39 | 9.39 | 9.39 | 9.39 | 9.39 | 9.39 | 9.39 | 9.39 |
| Palm oil | 2.5 | 2.5 | 2.5 | 2.5 | 2.5 | 2.5 | 2.5 | 2.5 | 2.5 |
| Salt | 0.5 | 0.5 | 0.5 | 0.5 | 0.5 | 0.5 | 0.5 | 0.5 | 0.5 |
| Pre-mix | 2.5 | 2.5 | 2.5 | 2.5 | 2.5 | 2.5 | 2.5 | 2.5 | 2.5 |
| DL-Methionine | 1.5 | 1.5 | 1.5 | 1.5 | 1.5 | 1.5 | 1.5 | 1.5 | 1.5 |
| L-Lysine | 2 | 2 | 2 | 2 | 2 | 2 | 2 | 2 | 2 |
| Klinofeed | 1 | 1 | 1 | 1 | 1 | 1 | 1 | 1 | 1 |
| Proximate composition of diets (% DM basis) | |||||||||
| Moisture | 11.45 | 10.12 | 10.5 | 10.46 | 11.52 | 10.54 | 9.36 | 10.03 | 9.21 |
| Crude protein | 38.02 | 35.54 | 35.49 | 36.33 | 37.98 | 35.56 | 37.55 | 38 | 36.35 |
| Ether extract | 12.59 | 10.06 | 11.54 | 10.83 | 10.49 | 10.11 | 11.55 | 10.53 | 10.02 |
| Ash | 14.95 | 15.81 | 16.32 | 15.92 | 16.81 | 15.34 | 15.95 | 16.4 | 16.86 |
| Crude fibre | 6.98 | 7.01 | 7.04 | 6.96 | 6.85 | 7.05 | 6.94 | 6.88 | 6.89 |
| NFE | 16.01 | 21.46 | 19.11 | 19.5 | 16.35 | 21.4 | 18.65 | 18.16 | 20.67 |
| Gross energy (Kcal) | 2996 | 2861.3 | 2926 | 2912.6 | 2836 | 2891.7 | 2986.9 | 2903 | 2888 |
Table 1: Feed formulation of the different experimental diets.
D1 – 100% SBM (Control diet) D2 - 75% SBM, 25% BDM D3 - 50% SBM, and BDM D4 - 25% SBM, 75% BDM D5 - 100% BDM D9 - 100% SLP D6 - 75% SBM, 25% SDM D7 - 50% SBM, and SDM D8 - 25% SBM, 75% SDM Table 1: Feed formulation of the different experimental diets.
Experimental Set-Up
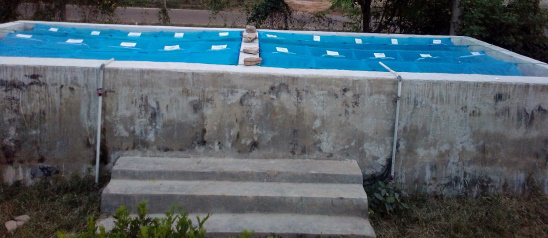
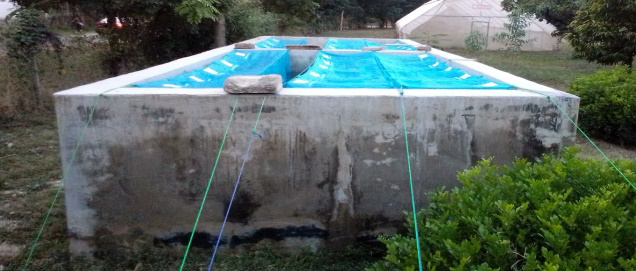
A completely Randomized Design (CRD) was employed in this research. The experiment consisted of eight treatments (D2, D3, D4, D5, D6, D7, D8, D9) and one control (D1) with three replications each. A semi flow through system was used. A group of 270 fingerlings of Oreochromis niloticus was acclimatized for 14 days. After the period of acclimatization, 10 fish were randomly assigned to a 1m2 Hapa net. A total of 27 Hapa nets were used in outdoor concrete ponds of 5m × 3.5m (l × b) and depth of 1.5m each (Plate I and II) and nine formulated diets were fed to the experimental fish at 5% biomass three times daily.
Monitoring of Water Quality Parameters of Experimental Ponds
Water quality parameters were determined weekly, before feeding the fish. The dissolved oxygen level of the water was measured using a digital water dissolved oxygen meter (Smart Sensor AR8210 model) while pH and temperature were measured using a digital pH/Temperature meter (HI-98127 model).
Determination of Growth Performance and Nutrient Utilization Parameters
The data obtained on the growth performance and nutrient utilization of O. niloticus fed on the formulated diets were determined as following the methods of Abdullahi et al. [12]:
- Mean Weight Gain (MWG) (g) Mean Weight Gain (MWG) = 2 1 – W W Where W1 = Initial mean weight (g) W2 = Final mean weight (g)
- Daily Weight Gain (g/day) ( ) – FMW IMW Daily Weight Gain DWG T = Where FMW = Final mean weight (g) IMW = Initial mean weight (g) T = Feeding trial period in days
- Percentage Weight Gain (%) ( ) – % 100 FMW IMW Percentage weight gain PWG FW = × Where FMW = Final mean weight (g) IMW = Initial mean weight (g)
- Specific Growth Rate (SGR %/day)
2 1 % 100 2 – 1 log of W log of W SGR T T − = ×
Where W1 = Initial mean weight (g) W2 = Final mean weight (g) T1 = Initial time (g) T2 = Final time (g) • Condition Factor (CF) ( )( ) ( ) ( )
100 3 Weight gain g CF Final Length cm =
• Survival Rate (%)
100 Number of fish that remain at the end of the experiment SR The initial number of fish stocked = × Daily Feed Intake (g) ( ) ( ) Quantity of feed fed g Daily Feed intake DFI Number of days =
- Protein Efficiency Ratio (PER) ( ) ( ) Total weight gain g Crude prot PE ein fed g R =
- Feed Conversion Ratio (FCR) ( ) ( ) Total weight of diet fed g Total weight of fish g FCR =
- Apparent Net Protein Utilization (ANPU) ( ) ( ) – 00 ( ) 1 Final carcass protein g Initial carcass protein g ANPU Protein fed g = ×
- Net Nitrogen Retention (NNR) ( ) ( )
100 Initial body protein g NNR Final body protein g = ×
• Mortality
100 Number of fish dead at the end of experiment M The initial number of fish stocked = ×
Somatic Indices
Somatic indices were used to know the condition of the experimental fish by determining the Viscerosomatic index (VSI) and Hepatosomatic index (HSI) according to Kubiriza et al. [15] as follows:
( ) 100 FVM Viscerosomatic Index VSI FBM = ×
Where FVM = Fish visceral mass (g) FBM = fish body mass (g) ( ) 100 LM Hepatosomatic Index HSI BM = × Where LM = liver mass (g) BM = body mass (g).
Data Analysis
All data collected from the experiment were subjected to one-way analysis of variance to test for significant differences among treatment means using XLSTAT version 2022, followed by Duncan pairwise comparisons which was used to separate significantly different means at a confidence interval of 95%. The level of significance set for treatments was P≤ 0.05. The growth and nutrient utilization parameters were subjected to trend analysis to determine their patterns at different inclusion levels.
Results
Water Quality Parameters of the Experimental Ponds
The mean dissolved oxygen, mean hydrogen ion concentration and mean temperature in the experimental ponds are presented in Table 2. There was no significant difference in the water quality parameters among all the treatments and the control (P>0.05). All the parameters recorded were within the recommended range. The DO ranged from 5.20 to 5.23, the pH ranged from 6.50 to 6.52 and the temperature ranged from 28.00°C to 28.40°C.
Growth Performance of Oreochromis niloticus Fed Experimental Diets
The growth performance and survival of Oreochromis niloticus fed experimental diets are presented in Table 3. There was no significant difference (P>0.05) in the initial weight and initial length among all the treatments and the control. The fish-fed diet containing 75% blanched duckweed meal (D4) recorded significantly highest (P≤0.05) mean final weight of 468.01g followed by the fish fed with 50% blanched L. paucicostata (D3) with 453.68g then the fish fed diet containing 25% sun-dried duckweed meal (D6) with a value of 443.77g. The fish-fed diet containing 100% blanched duckweed meal (D5) recorded significantly lowest (P≤0.05) value of 401.54g. There was significant difference in the mean final weight among all the treatments and the control (P≤0.05) diet. The monthly increase in weight of Oreochromis niloticus fed experimental diets is presented in Figure 1. There was no significant difference (P>0.05) in the condition factor among all the treatments and the control. The survival rate of the experimental fish showed significant difference (P≤0.05). The fish fed diet containing 50% blanched duckweed meal (D3), 25% sun-dried duckweed meal (D6), 50% sun-dried duckweed meal (D7) and 100% sun-dried duckweed meal (D9) recorded 100% survival rate while the fish fed with 100% soybean meal (D1), 25% blanched duckweed meal (D2), 75% blanched duckweed meal (D4), 100% blanched duckweed meal (D5) and 75% sun-dried duckweed meal (D8) recorded 96.66% survival rate.
The result of the trend analysis for the growth parameters is presented in Figures 1-4. The trend line for mean weight gain, daily weight gain and specific growth rate of Oreochromis niloticus fed experimental diets displayed an increasing trend as the inclusion levels of blanched duckweed meal increased upto 75% while decreasing as inclusion levels of sun-dried duckweed meal increased upto 100% inclusion.
Nutrient Utilization and Somatic Indices
The results of nutrient utilization and somatic indices in terms of protein efficiency ratio (PER), feed conversion ratio (FCR), apparent net protein utilization (ANPU), net nitrogen retention (NNR), protein productive value (PPV), viscerosomatic index (VSI) and Hepatosomatic index (HSI) Oreochromis niloticus fed experimental diets are presented in Table 4. There was significant difference (P≤0.05) in the feed intake, protein efficiency ratio, feed conversion ratio, protein productive value, viscerosomatic index and Hepatosomatic index among all the treatments and the control.
The result of the trend analysis for the nutrient utilization parameters is presented in Figures 5 and 6. The trend line for protein efficiency ratio of Oreochromis niloticus fed experimental diets displayed an increasing trend as the inclusion levels of blanched duckweed meal increased upto 75% while decreasing as inclusion levels of sun-dried duckweed meal increased upto 100% inclusion. While the trend line for the feed conversion ratio displayed a decreasing trend as the inclusion levels of blanched duckweed meal increased upto 75% while increasing as inclusion levels of sun-dried duckweed meal increased upto 100% inclusion (Tables 2-4) and (Figures 7 & 8).
| Treatments | DO (mg/l) | pH | T (℃) |
|---|---|---|---|
| D 1 | 5.20±0.01a | 6.52±0.02a | 28.04±0.93a |
| D 2 | 5.20±0.01a | 6.51±0.02a | 28.10±0.93a |
| D 3 | 5.22±0.01a | 6.52±0.02a | 28.00±0.93a |
| D 4 | 5.21±0.01a | 6.51±0.02a | 28.16±0.93a |
| D 5 | 5.20±0.01a | 6.51±0.02a | 28.30±0.93a |
| D 6 | 5.22±0.01a | 6.51±0.02a | 28.12±0.93a |
| D 7 | 5.21±0.01a | 6.51±0.02a | 28.05±0.93a |
| D 8 | 5.21±0.01a | 6.50±0.02a | 28.40±0.93a |
| D 9 | 5.23±0.01a | 6.52±0.02a | 28.30±0.93a |
| P values | 0.24 | 0.95 | 1 |
Table 2: Mean weekly water quality parameters of the experimental ponds.
Means with the same superscript along the same column are not significantly different (P>0.05) D1 – 100% SBM (Control diet) D2 - 75% SBM, 25% BDM D6 - 75% SBM, 25% SDM D3 - 50% SBM, and BDM D7 - 50% SBM, and SDM D4 - 25% SBM, 75% BDM D8 - 25% SBM, 75% SDM D5 - 100% BDM D9 - 100% SLP Table 2: Mean weekly water quality parameters of the experimental ponds.
| Para meters | Treatments | ||||||||
|---|---|---|---|---|---|---|---|---|---|
| D 1 | D 2 | D 3 | D 4 | D 5 | D 6 | D 7 | D 8 | D 9 | |
| IW (g) | 7.48±0.06a | 7.43±0.06a | 7.50±0.06a | 7.42±0.06a | 7.51±0.06a | 7.47±0.06a | 7.45±0.06a | 7.41±0.06a | 7.51±0.06a |
| IL (cm) | 7.79±0.07a | 7.75±0.07a | 7.87±0.07a | 7.78±0.07a | 7.86±0.07a | 7.75±0.07a | 7.77±0.07a | 7.75±0.07a | 7.85±0.07a |
| FW (g) | 416.88±56.90c | 425.57±56.90b | 453.68±56.90ab | 468.01±56.90a | 401.54±56.90d | 443.77±56.90ab | 432.54±56.90b | 426.33±56.90b | 409.20±56.90c |
| FL (cm) | 27.07±0.43a | 27.19±0.43a | 27.68±0.43a | 27.72±0.43a | 26.72±0.43b | 27.41±0.43a | 27.21±0.43a | 27.50±0.43a | 26.75±0.43b |
| MWG (g) | 409.40±56.92c | 418.14±56.92b | 446.18±56.92ab | 460.59±56.92a | 394.03±56.92d | 436.30±56.92ab | 425.09±56.92b | 418.92±56.92b | 401.69±56.92c |
| DWG (g) | 2.27±0.31c | 2.32±0.31b | 2.48±0.31ab | 2.55±0.31a | 2.19±0.31d | 2.42±0.31ab | 2.36±0.31b | 2.32±0.31b | 2.23±0.31c |
| PWG (%) | 98.17±0.27b | 98.25±0.27ab | 98.31±0.27a | 98.33±0.27a | 98.12±0.27b | 98.20±0.27ab | 97.98±0.27b | 98.26±0.27ab | 98.09±0.27b |
| SGR (%) | 0.97±0.03ab | 0.97±0.03ab | 0.98±0.03a | 0.99±0.03a | 0.96±0.03b | 0.98±0.03a | 0.96±0.03b | 0.97±0.03ab | 0.96±0.03b |
| CF | 2.10±0.24a | 2.12±0.24a | 2.13±0.24a | 2.18±0.24a | 2.10±0.24a | 2.12±0.24a | 2.10±0.24a | 2.06±0.24a | 2.11±0.24a |
| SR | 96.66±2.48b | 96.66±0.24b | 100.00±0.24a | 96.66±0.24b | 96.66±0.24b | 100.00±0.24a | 100.00±0.24a | 96.66±0.24b | 100.00±0.24a |
Table 3: Growth performance and survival of _Oreochromis niloticus_ fed experimental diets.
Means with the same superscript across the same row were not significantly different (P>0.05) D1 - 100% SBM (Control diet) D4 - 25% SBM, 75% BDM D7 - 50% SBM, and SDM D2 - 75% SBM, 25% BDM D5 - 100% BDM D8 - 25% SBM, 75% SDM D3 - 50% SBM, and BDM D6 - 75% SBM, 25% SDM D9 - 100% SDM Table 3: Growth performance and survival of Oreochromis niloticus fed experimental diets.
| Parameters | Treatments | ||||||||
|---|---|---|---|---|---|---|---|---|---|
| D 1 | D 2 | D 3 | D 4 | D 5 | D 6 | D 7 | D 8 | D 9 | |
| DFI (g) | 42.11±4.12ab | 42.61±4.12ab | 44.17±4.12a | 44.44±4.12a | 41.67±4.12b | 43.33±4.12a | 43.06±4.12a | 42.52±4.12ab | 41.83±4.12b |
| PER | 10.77±1.55b | 11.76±1.55b | 12.57±1.55a | 12.67±1.55a | 10.37±1.55b | 12.26±1.55a | 11.31±1.55b | 11.08±1.55b | 11.05±1.55b |
| FCR | 1.99±0.19a | 1.91±0.19ab | 1.82±0.19b | 1.82±0.19b | 2.10±0.19a | 1.84±0.19b | 1.88±0.19b | 1.91±0.19ab | 2.06±0.19a |
| ANPU | 34.96±1.27c | 39.08±1.27b | 43.14±1.27a | 44.23±1.27a | 33.65±1.27c | 43.14±1.27a | 39.25±1.27b | 35.68±1.27ab | 33.98±1.27c |
| NNR | 77.09±1.10b | 76.31±1.10b | 74.50±1.10bc | 73.57±1.10c | 77.78±1.10ab | 74.46±1.10bc | 75.21±1.10b | 76.24±1.10b | 78.36±1.10a |
| PPV | 1.53±0.43c | 1.65±0.43b | 1.69±0.43b | 1.66±0.43b | 1.51±0.43c | 1.68±0.43b | 1.58±0.43c | 1.80±0.43a | 1.57±0.43c |
| VSI | 7.21±1.12b | 7.48±1.12b | 9.77±1.12a | 9.90±1.12a | 6.99±1.12b | 9.35±1.12a | 8.91±1.12ab | 7.62±1.12b | 7.14±1.12b |
| HIS | 0.65±0.11b | 0.68±0.11b | 0.88±0.11a | 0.95±0.11a | 0.63±0.11b | 0.85±0.11a | 0.81±0.11ab | 0.68±0.11b | 0.65±0.11b |
Table 4: Nutrients utilization and somatic indices of _Oreochromis niloticus_ fed experimental diets.
Means with the same superscript within the same row were not significantly different (P>0.05) D1 - 100% SBM (Control diet) D4 - 25% SBM, 75% BDM D7 - 50% SBM, and SDM D2 - 75% SBM, 25% BDM D5 - 100% BDM D8 - 25% SBM, 75% SDM D3 - 50% SBM, and BDM D6 - 75% SBM, 25% SDM D9 - 100% SDM Table 4: Nutrients utilization and somatic indices of Oreochromis niloticus fed experimental diets.
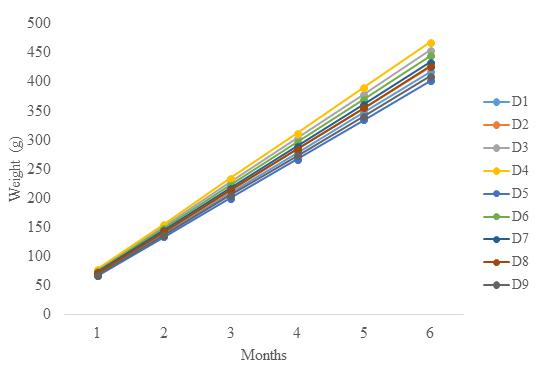
D1 – 100% SBM (Control diet) D2 - 75% SBM, 25% BDM D6 - 75% SBM, 25% SDM D3 - 50% SBM, and BDM D7 - 50% SBM, and SDM D4 - 25% SBM, 75% BDM D8 - 25% SBM, 75% SDM D5 - 100% BDM D9 - 100% SLP Figure 1: The monthly increase in weight of Oreochromis niloticus fed experimental diets.
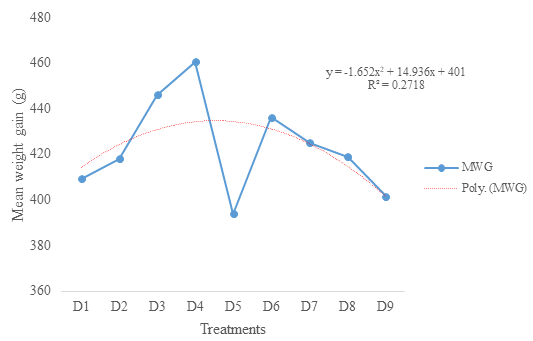
D1 – 100% SBM (Control diet) D2 - 75% SBM, 25% BDM D6 - 75% SBM, 25% SDM D3 - 50% SBM, and BDM D7 - 50% SBM, and SDM D4 - 25% SBM, 75% BDM D8 - 25% SBM, 75% SDM D5 - 100% BDM D9 - 100% SLP Figure 2: Trend line for the mean weight gain of Oreochromis niloticus fed experimental diets.
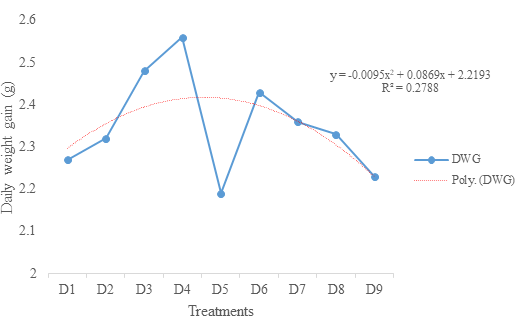
D1 – 100% SBM (Control diet) D2 - 75% SBM, 25% BDM D6 - 75% SBM, 25% SDM D3 - 50% SBM, and BDM D7 - 50% SBM, and SDM D4 - 25% SBM, 75% BDM D8 - 25% SBM, 75% SDM D5 - 100% BDM D9 - 100% SLP Figure 3: Trend line for the daily weight gain of Oreochromis niloticus fed experimental diets.
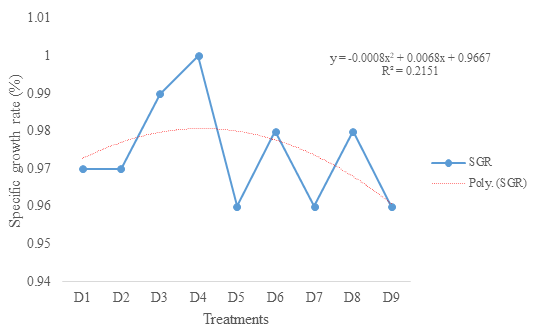
D1 – 100% SBM (Control diet) D2 - 75% SBM, 25% BDM D6 - 75% SBM, 25% SDM D3 - 50% SBM, and BDM D7 - 50% SBM, and SDM D4 - 25% SBM, 75% BDM D8 - 25% SBM, 75% SDM D5 - 100% BDM D9 - 100% SLP Figure 4: Trend line for the specific growth rate of Oreochromis niloticus fed experimental diets.
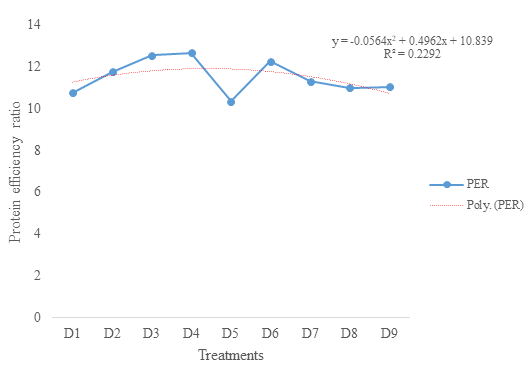
D1-100% SBM (Control diet) D2 - 75% SBM, 25% BDM D6 - 75% SBM, 25% SDM D3 - 50% SBM, and BDM D7 - 50% SBM, and SDM D4 - 25% SBM, 75% BDM D8 - 25% SBM, 75% SDM D5 - 100% BDM D9 - 100% SLP Figure 5: Trend line for the protein efficiency ratio of Oreochromis niloticus fed experimental diets.
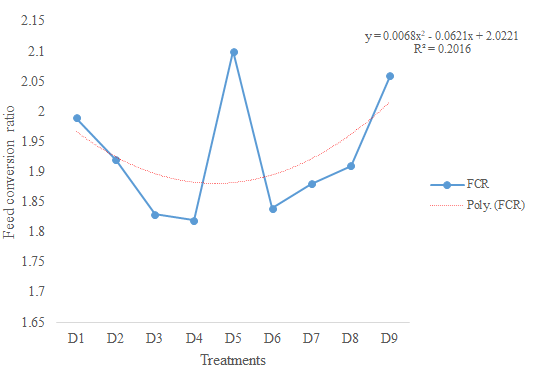
D1-100% SBM (Control diet) D2 - 75% SBM, 25% BDM D6 - 75% SBM, 25% SDM D3 - 50% SBM, and BDM D7 - 50% SBM, and SDM D4 - 25% SBM, 75% BDM D8 - 25% SBM, 75% SDM D5 - 100% BDM D9 - 100% SLP Figure 6: Trend line for the feed conversion ratio of Oreochromis niloticus fed experimental diets.
Discussion
The water quality parameters (temperature, dissolved oxygen and potential of hydrogen or hydrogen ion concentration) monitored during the experimental period were not affected by the forms of the experimental diets, all the parameters measured did not differ significantly (P>0.05) among the treatments and the control. The dissolved oxygen ranged from 5.20-5.23mg/l, hydrogen ion concentration (pH) ranged from 6.50-6.52 while the temperature ranged from 28.00oC – 28.40oC. Ayoola and Fedrick [16] stated that 3-8mg/L of dissolved oxygen is recommended for freshwater fish culture. The physicochemical parameters of water used for the culture of Oreochromis niloticus during the experimental period were within the range recommended for Nile tilapia culture [17].
The growth performance of Nile tilapia fed varying inclusion levels of blanched and sun-dried duckweed meal as a replacement for toasted soybean indicated that the initial mean weight (7.41g -7.51g) and initial mean length (7.75cm-7.87cm) were not significantly different (P>0.05) among the experimental treatments and the control showing uniformity in their sizes at onset of the experiment which in turn indicating the accuracy of randomization process among the experimental treatments and the control. The high mean weight gain observed in the D4 (75% blanched duckweed meal) and D3 (50% blanched duckweed meal) was an indication that the fish were able to utilize the diet more efficiently than the other treatments and the control diet. While the low mean weight gain obtained in D5 (100% blanched duckweed meal) and D9 (100% sun-dried duckweed meal) could be due to low feed consumption as a result of less palatability of the diet. Since it was observed that the fish were not actively responding to the diet during feeding when compared to the response in the other treatments and the control. The decrease in mean weight gain as a result of less palatability of the diet had been reported by Welker et al. [18]. Daily weight gain, percentage weight gain and specific growth rate also revealed a similar trend with the mean weight gain. The best growth performance was observed in the fish fed diet containing 75% blanched duckweed meal in this study contradicts the findings of Effiong et al. [19] who reported that the inclusion of duckweed at 10% in the diet of Heterobranchus longifilis fingerlings gives better results as compared to diets containing duckweed at 20% and 30%. Olaniyi and Oladunjoye [20] reported that the substitution of duckweed meal for 25% fish meal promotes higher growth performance than feeding only fish meal as the main source of protein in the Nile tilapia fish. These authors added that the growth performance of the fish that were fed the control diet was higher than those that received 50%, 75% and 100% duckweed meal. However, Oyas et al. [21] replaced duckweed with fish meal in the diet of common carp (Cyprinus carpio) fingerling at 0%, 15%, 30% and 45% inclusion levels and concluded that duckweed inclusion level at a lower level (15%) gives better results compared with higher inclusion levels (30% and 45%). The discrepancy observed between the results of this study and those of the above-referenced authors could be due to the differences in experimental fish in relation to species, type of duckweed species used, processing methods used in treating antinutrients in the duckweed, the ingredient that was replaced in the diet, culture system (indoor or outdoor) used for the experiment, age and stage of the fish development and water quality management. Condition factor is a useful index for monitoring feeding intensity, age and growth rates in fish [22]. It also provides information relating to the physiological condition of the fish, welfare, health and well-being of the fish. It is based on the hypothesis that heavier fish of a particular length is in a better physiological condition [22]. The condition factors (2.06 – 2.18) observed in this study were not significantly different among the treatments and the control indicating that all the experimental fish were in good condition. The survival rate of Nile tilapia fingerlings fed the experimental diets showed similar performance (96.66% - 100.00%) among the experimental treatments and the control as no significant difference was observed. The trend line for mean weight gain, daily weight gain and specific growth rate of Nile tilapia fed experimental diets displayed a decreasing trend as the inclusion levels of duckweed meal increased. While the trend line for the survival rate increased as duckweed meal increased in the experimental diets. Ramezani [23] and Sotolu [24]; had earlier stated that a high feeding rate of quality feed is directly related to fish growth performance hence, the trend of growth observed in the study is an indication that the energy quality of D4 (75% blanched duckweed meal) is better utilized in the diet of Nile tilapia fingerlings compared to the other treatments and the control.
The nutrient utilization of Nile tilapia fed diets containing different dietary levels of blanched and sun-dried duckweed meal show significant differences (P≤0.05) in protein efficiency ratio, feed conversion ratio and protein productive value among the experimental diets and the control. The lowest feed conversion ratio (1.82) observed in the fish fed D3 (50% blanched duckweed meal) and D4 (75% blanched duckweed meal) could be a result of the activation of digestive enzymes by the high mineral concentrations present in the duckweed. The best feed conversion ratio obtained in this research is in line with the findings of Sogbesan et al. [25] and Ibrahim et al. [26] who reported best feed conversion ratios of 1.85 and 1.95, respectively. Apparent net protein utilization differed significantly (P<0.05) among the experimental fish and the control. The highest ANPU (44.23) was recorded in the fish fed D4 (75% blanched duckweed meal) while the least ANPU of 33.65 was obtained in the fish fed D5 (100% blanched duckweed meal), this could be due high weight gain (460.59g) obtained in the fish fed D4 (75% blanched duckweed meal) and least weight gain (394.03g) obtained in the fish fed D5 (100% blanched duckweed meal) this observation revealed that high ANPU value will be obtained if the weight gain is high. The assessment of nutrient utilization and biochemical composition in the diets can be carried out using the morphometric characterization of the fish as described by Vatandoust et al. [27] using organ and tissue indices of a particular fish. The organ indices commonly used are the Viscerosomatic Index (VSI), Hepatosomatic Index (HSI), Gonadosomatic Index (GSI) and Spleenosomatic Index (SSI) as cited by Sudaporn et al. [28]. Babalola et al. [29] described viscerosomatic and hepatosomatic indices as the ratio of organs to body weight measured in relation to body mass which can be used as indices of changes in nutritional and energy status. According to Gumus and Ikiz [30], the assessment of viscerosomatic and hepatosomatic (organosomatic indices) plays a significant role in the secretion of digestive enzymes, digestion and absorption of food items as well as metabolism in fishes. The mean viscerosomatic index (6.99g - 9.90g) and hepatosomatic index (0.63g – 0.95g) of Nile tilapia fed with the experimental diets observed in this study, increase with the increase in mean weight gain, feed intake, protein efficiency ratio and protein productive value among the treatments and the control, this indicated that the fish were able to make use of the dietary duckweed meal in the diet by converting it into muscle tissues or carcass as reported by Marroh and Ekelemu [31].
Conclusions
The growth performance, nutrient utilization and protein efficiency ratio of the experimental fish increased with the increased of inclusion levels of blanched duckweed meal up to the maximum of 75% while decreasing with the increase of inclusion levels of sun-dried duckweed meal up to 100%. The fish fed 75% blanched duckweed meal had the best mean weight gain (460.59g), feed conversion ratio (1.82) and protein efficiency ratio (12.67) while the fish fed 100% inclusion level of sun-dried duckweed meal and 100% of blanched duckweed meal diet had the poor mean weight gain, feed conversion ratio and protein efficiency ratio of 401.69g and 394.03g, 2.06 and 2.10, 11.05 and 10.37, respectively. This study revealed that blanched duckweed meal can replace toasted soybean meal in the diet of Nile tilapia at 75% without any unpropitious effect on the growth performance and nutrient utilization.
References
-
FAO (2022) Nile tilapia tables. Aquaculture feed and fertilizer resources information system.
-
Tiamiyu LO, Okomoda VT, Agbo AO (2015) Nutritional Suitability of Leucaena Leaf Meal in the Diet of African catfish Clarias gariepinus. Journal of Fisheries Sciences 9(2): 1-5.
-
Olasunkanmi JB, Julius OT, Babalola TO, Jimoh JO, Ariyomo TO (2021) Alternative feed resources in Aquaculture: The role of underutilized plants – A Review. IOP Conference Series: Earth and Environmental Science 655(2021): 012008.
-
Khan MSK, Siddique MAM, Zamal H (2013) Replacement of fish meal by plant protein sources in Nile tilapia (_Oreochromis niloticus_) diet: growth performance and utilization. Iranian Journal of Fisheries Sciences 12(4): 864-872.
-
FAO (2020) Selected daily news on food chain distributions and countries’ responses to the COVID-19 impact on food chains.
-
Abdullahi AI, Auta J, Abdullahi SA, Bolorunduro PIO, Onimisi HU (2023a) Blood chemistry and enzyme activity of _Oreochromis niloticus_ (Linnaeus, 1758) fed dietary processed _Lemna paucicostata_ (Hegelm) as a replacement for soybean meal. Aquaculture Studies 23(4): AQUAST1128.
-
Christine A, Annita SKY, Ching FF (2018) Supplementation of duckweed diet and citric acid on growth performance, feed utilization, digestibility and phosphorus utilization of TGGG hybrid grouper (_Epinephelus fuscoguttatus x_ _Epinephelus lanceolatus_) juvenile. Journal of Science and Technology 40(5): 1009-1016.
-
Dorothy MS, Sudhanshu R, Vipin N, Khushvir S, Yogananda T, et al. (2018) Use of Potential Plant Leaves as Ingredient in Fish Feed - A Review. International Journal of Current Microbiological Application Sciences 7(7): 112-125.
-
Mohapatra SB, Patra AK (2013) Effect of partial replacement of fishmeal with duckweed feed on the growth performance of Cyprinus carpio fry. IOSR Journal of Agriculture and Veterinary Science 4(2): 34-37.
-
Abdullahi AI, Auta J, Abdullahi SA, Bolorunduro P, Onimisi HU (2022) Effect of different processing methods on nutritional composition of _Lemna paucicostata_ as inclusion in fish feed. Scholarly Journal of Food and Nutrition. 4(3): 1-5.
-
Mwale M, Gwaze FR (2013) Characteristics of duckweed (_Lemna paucicostata_) and its potential as a feed source for chickens reared for meat production: A review. Scientific Research and Essays 8(18): 689-697.
-
Abdullahi AI, Mohammed T, Haruna MY, Mohammed A (2023) Digestibility, growth and hepatosomatic index of _Oreochromis niloticus_ (Linnaeus, 1758) fed diets containing blanched _Lemna paucicostata_ (Hegelm). International Journal of Oceanography and Aquaculture 7(3): 1-9.
-
AOAC (2019) Official Methods of Analysis of Association of Official Analytical Chemists: Official Methods of Analysis of AOAC International, 21st (Edn.), AOAC, Washington DC.
-
Pauzenga U (1985) Feeding parent stock. Zootecnica International, pp: 22-24.
-
Kubiriza GK, Akol AM, Arnason J, Sigurgeirsson SS, Tómasson T, et al. (2017) Practical feeds for juvenile Nile tilapia are prepared by replacing Rastrineobola argentea fishmeal with freshwater shrimp (_Caridina nilotica_) and mung bean (_Vigna radiata_) meals. Aquaculture Nutrition 24(1): 94-101.
-
Ayoola OA, Fredrick CA (2012) Effects of the shape of culture tanks on the production of African catfish _Clarias_ _gariepinus_ juvenile. Journal of Agriculture and Social Research 12(1): 130-142.
-
Agano JM (2015) The effects of physicochemical parameters of water on tilapia (_Oreochromis niloticus_) growth in earthen ponds in Teso North Sub Country, Busia Country, Kenya. Aquatic Sciences and Fisheries Abstract, pp-121.
-
Welker AM, Jaros BD Puduvalli VK, Imitola J, Kaur B, et al. (2016) Standardized orthotropic xenografts in zebrafish reveal glioma cell-line-specific characteristics and tumor cell heterogeneity. Disease Models and Mechanisms 9(2): 199-210.
-
Effiong BN, Sanni A, Fakunle JO (2009) Effect of partial replacement of fishmeal with duckweed (_Lemna_ _paucicostata_) meal on the growth performance of Heterobranchus llogfilesfingerlings. Report and Opinion 1(3): 1-6.
-
Olaniyi CO, Oladunjoye IO (2012) Replacement value of duckweed (_Lemna minor_) in Nile tilapia (_Oreochromis_ _niloticus_) diet. Transnational Journal of Science and Technology 2(9): 1-9.
-
Oyas AA, Irfan AK, Tariq AB, Nasir H (2018) Duckweed (_Lemna minor_) is a plant protein source in the diet of common carp (_Cyprinus carpio_) fingerlings. Journal of Pharmacognosy and Phytochemistry 7(3): 42-45.
-
Ndemele PE, Kumolu-Jhonson CA (2010) Length-weight relationships and condition factors of twenty-one fish species in Ologe Lagoon, Lagos, Nigeria. Asian Journal of Agricultural Sciences 2(4): 174-179.
-
Ramezani H (2009) Effects of different protein and energy levels on growth performance of Caspian Brown Trout, _Salmotrutta capinus_ (Kessler, 1877). Journal of Aquatic Science 4(4): 203-209.
-
Sotolu AO (2009) Comparative utilization of fish waste meal with imported fishmeal by African Catfish (Clarias gariepinus). American Journal of Science 4(4): 285-289.
-
Sogbesan OA, Onoja CF, Adedeji HA, Idowu TA (2015) Utilization of treated duckweed meal (_Lemna_ _paucicostata_) as a plant protein supplement in African mud catfish (_Clarias gariepinus_) juvenilenile diets. Fish and Aquaculture Journal 6(4): 1-5.
-
Ibrahim WM, Eid AE, Mohamed K, Abd-elfattah B (2017) Effect of replacement of soybean meal with duckweed (_Lemna minor_) meal on the growth performance and feed utilization in Nile tilapia fingerlings. Journal of Animal Poultry and Fish Production 6(1): 7-12.
-
Vatandoust S, Anvarifar H, Mousavi-Sabet H (2014) Morphometric and meristic characteristics and morphological differentiation of Brown Trout Salmo trutta fario (Pisces: Salmonidae) along the Southern Caspian Sea Basin. European Journal of Zoological Research. 3(2): 56-65.
-
Sudaporn T, Kringsak M, Yuwadee P (2010) Effect of replacing fish meal with Spirulina on growth, carcass composition and pigments of Mekong Giant catfish. Journal of Agricultural Science 2(3):106-110.
-
Babalola OA, Sunnuvu TF, Fakunmoju FA (2022) Viscerosomatic and hepatosomatic indices of African catfish (_Clarias gariepinus_) juvenile fed with Lemna minor leaf meal. International Journal of Science, Environment and Technology 11(2): 94-104.
-
Gumus E, Ikiz R (2009) Effect of dietary levels of lipid and carbohydrate on growth performance, chemical contents, and digestibility in rainbow trout, _Oncorhynchus mykiss_. Pakistan Veterinary Journal 29(2): 59-63.
-
Marroh E, Ekelemu JK (2016) Effect on Growth of _Clarias_ _gariepinus_ post fingerlings, fed graded levels of _Ocimum_ _gratissimum_ as feed additive. International Journal of Research Studies in Biosciences 4(3): 20-24.
- Genetic Improvement of Nile Tilapia (Oreochromis niloticus): Advances in Selective Breeding and Genomic Approaches for Sustainable Aquaculture
- Microplastics, Contaminants, and Waste Hotspots: Divergences and Faults in Prioritizing Control Efforts
- Creating a Healthier, More Vibrant Open and Closed Aquatic Environment. A Submersible, Centrifugal Magnetically Affixed Current Changing Aquarium Pump
- An Attempt to Assess Alpha Diversity and Sample Size: Using the Ostracod Assemblages off Kumamoto Port, Japan
- Assessment of the Efficiency of Common Fishing Gears and Crafts Used at Mohananda River of Chapai Nawabganj, Bangladesh
- Fish Productivity and Biodiversity Status of Sundarban Mangrove in Bangladesh