Water Quality and Plankton Population Abundance Affected by Earthen Ponds Management
The study was conducted in two earthen ponds fish farming systems located at (El-Rayed area- Kafer El-Shiak government- Egypt); namely, feed and fertilizer fish farming systems. Each system was replicated in four ponds (8000m2 each), to determine water quality, phytoplankton and zooplankton abundance. Nile tilapia (Orechromis niloticus); mullet (Mugil cephalus) and catfish (Clarias garipinus) were cultured in each pond at initial weight of 2, 30 and 50 g, respectively. The present study aimed to evaluate two fish farming systems differing in pond management procedures in the Nile Delta regions. Results apparent insignificant differences between the two fish farming systems in terms of water temperature (ranged 12.7 to 30.9°C from winter to summer months), salinity, EC and total hardness. Whilst, fertilizer fish farm had significantly high levels of pH, DO, secchi disc, total alkalinity, orthophosphate, TAN, NO2, NO3, algal abundance and chlorophyll “a” n water compared to those of feed fish farm. Significant increase (P<0.05) in phytoplankton and zooplankton abundance were observed in fertilizer fish farm compared to feed fish farm, this was due the high organic manure inputs to pond water during all seasons including winter at one ton per feddan every 10 days.
Introduction
Since the 1950s, global aquaculture production has expanded significantly, whereas global capture fisheries production has exhibited no trend of increase since the early 1990s [1]. Aquaculture output for human consumption overtook capture fisheries production in 2016 FAO [2], and it contributed 52% of the total harvest weight of aquatic animals for human consumption in 2018 [3]. Freshwater fish farming requires the use of agricultural drainage water in Egypt, which interferes with the need for irrigation of other agricultural crops that also require the use of recycled drainage water [4]. Fish farming in Egypt is considered as a cash crop with higher revenues and net income compared to other agricultural activities. So, aquaculture activities in Egypt had a higher economic competitive edge than crop production sector in the Nile Delta, allowing their rapid growth in both two decades.
Water is regarded as a crucial component of every successful fish farming operation. To create future management plans, it is necessary to evaluate water in terms of its seasonal quality, the dynamics of micronutrients during agricultural operations, and the composition of effluent Ali AE, et al. [5] ideal for the farming operations in the Nile Delta. Additionally, the water quality in fish farm ponds should be in accordance with physiological needs for the cultivated species’ optimum growth; as a result, excellent quality water is a necessary for effective fish farming [6].
The present study aimed to evaluate two fish farming systems differing in pond management procedures in the Nile Delta regions. The study was designed to compare water quality dynamics in the two fish farms at the end of the production cycle.
Materials and Methods
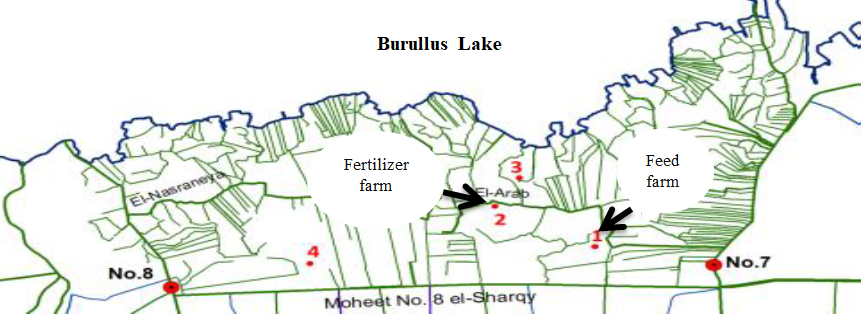
The present study was conducted to understand the linkages between water management practices and nutrient salt movement and accumulation in two fish farms in the North of the Nile Delta. The area between El-Moheet Drain and El-Burullus Lake necessitated a thorough analysis. The area between drains 7 and 8 is filled by (30,000 feddan) of fish ponds that are fed mostly by agricultural drainage water, deep groundwater wells, and El-Burullus Lake water.
Sample-Taking Site
The experiment was conducted in two separate fish farms (earthen ponds), each having 8000 m2 of surface area, four replicates, and an average water depth of 1.25 m. That differs in management during the production cycle, namely the feed fish farm and fertilizer fish farm systems. At the beginning of the production cycle, the feed fish farm relied on pelleted diet (which contains 25% crude protein) as feed input for the cultured fish. This rate was subsequently increased to 50 kg/feddan/day by the end of October. Feeding was discontinued for four months (from November to the end of February) during the overwinter season. In March, feeding was resumed at a rate of 25% hg/feddan/day, and by the end of the production cycle, it had been increased to 35 kg/feddan/day. The fertilizer fish farm, on the other hand, used both organic fertilizer and broken macaroni as additional nutrition (Figure 1).
Beginning with 25 kg/feddan/day, five days a week, the fertilizer fish farm implemented supplementary feeding with crushed macaroni. By the end of October, the amount had been raised to 60 kg/feddan/day. Crushed macaroni feeding was discontinued over the winter and resumed in the spring. Throughout the trial, including the overwinter period, one ton/feddan/10 days (equal to 100 kg/feddan/ day) of chicken dung was administered.
Water Samples
Water temperature °C, dissolved oxygen DO mg/l, pH, Salinity, Electrical conductivity, was measured in earthen ponds using water quality device multi parameters (YSI 5200); total ammonia nitrogen TAN and SD as a filed measurements. Water samples were taken monthly from each pond during July, 2014 to June, 2015 and analyzed for water quality (physical and chemical and biological of water).
Water samples were taken with a vertical water sampler from at least three spots in the ponds and mixed together in a plastic container according to Boyd CE [7]. Then we take one liter for water quality analysis, and put in plastic bottles and kept in ice box until transferred to (CLAR) for lab analysis during 24 hour. Total alkalinity (mg/l), total hardness, nitrite (mg/l), nitrate (mg/l), orthophosphate (mg/l) and chlorophyll “a” (µg/l) was determined according to APHA [8]. Chlorophyll “a” concentration was determined photometrically by using spectrophotometer Thermo Electron Corporation (model Nicolet evolution 100) according to APHA [8]. The concentration of chlorophyll “a” was determined according to the following equation [9]:
( ) " " 11.9 665 750 /1.25 1000 / Chlorophyll a R R AC V = − ×
Where R665 = reading of spectrophotometer at a wave length of 665
nm. R750 = reading of spectrophotometer at a wave length of 750 nm. AC = acetone volume. V = water sample volume.
Plankton Org./l
From July 2014 to June 2015, standing crops of phytoplankton and zooplankton were quantitatively and qualitatively estimated each month.
Phytoplankton Org./l
The sedimentation method published in APHA [8] was used to assess phytoplankton standing crop, and the findings are reported as the total number of various species and expressed in units per liter (Units/l). 1 ml was taken and placed in a Sedgwick-Rafter cell before being microscopically examined (using a fifty Rechert Scientific Instruments microscope (optical microscope 450 X magnifications) for counting after phytoplankton organism identification.
Zooplankton Org./l
Zooplankton representative samples were collected by filtering 30 liters of the lake water through the zooplankton net (with mesh openings 50-80 µm.), the results were expressed as number of organisms found in one m’ of the water samples (organisms/m3) according to APHA [8].
Statistical Analyses
Two-way ANOVA was used to evaluate the significant difference of the concentration of different items studied with respect to sites and seasons. A probability at level of 0.05 or less was considered significant. Standard errors were also estimated. All statistics were run on the computer, using the SAS programme [10].
Results and Discussions
Water is a vital component of the human environment since it fosters socioeconomic growth and increases reliance on resources for both agriculture and industry in general. Water quality describes the physical, chemical, and biological properties of water that affect the existence of life, particularly human activities. The intended uses of water define its quality, and each of these uses has some degree of impact on the water’s quality.
Table 1 displays the monthly variance in the factors related to water quality, during the experiment, the water temperature oscillated from 12.7 to 30.9°C, with insignificant differences between the feed fish farm and fertilizer fish farm ponds. In both fish farms, the water temperature peaked in the summer months of June, July, and August at around 29.6°C, was medium in the spring and autumn months (20.9–26.5°C), and dropped in the winter months of December, January, and February at 15.6°C. There were no significant variations in temperature across the treatments (P>0.05). The values of water temperature are quite close to air temperature. With the exception of the winter months when fish were overwintered, the range of water temperatures that were recorded during the trial period was appropriate for the survival and growth of farmed fish. Saeed SM [11] they observed that water temperature measurements closely mirrored air temperature, with the lowest (16.71°C) in winter months and the highest (28.02°C) in summer months. Also, Mohammed AA, et al. [12] noticed that the temperature fluctuated from 17.5°C in the winter months and 30.3°C in the summer months in different sites of fish farm. A temperature of around 35 degrees Celsius is typically regarded the threshold for aquatic life viability [13].
The pH of pond water was on the alkaline side (>7.8) in Table 1. This indicates well-buffered capacity and demonstrated a significant difference between the two fish farm ponds; the monthly pH values in the fertilizer fish farm (7.9-8.9 units) were significantly higher than those in the feed fish farm (7.6-8.2 units) due to increased photosynthetic activities in the fertilized ponds. According to Santhosh B, et al. [14] pH levels ranged between 6.7 and 9.5 are suitable for fish cultures, and a healthy pH level is between 7.5 and 8.5, whereas levels above and below this are stressful to the fishes. In the same trend, Mohammed AA, et al. [12] reported that the pH values varied from 7.9 in the winter months 8.78 in autumn months, respectively.
These results may be due to the increased phytoplankton density and photosynthetic activities (i.e. shallower secchi disc readings) as a result of organic fertilizer degradation in the fertilizer fish ponds. Intense photosynthesis was characterized by excessive algal blooms as indicated by the shallower secchi disc reading in the fertilizer compared to the feed fish ponds. The uptake of CO2 and bicarbonate from pond water during photosynthetic process helped increase pH values in the fertilizer fish ponds. The pH range observed during the current experiment was within the desirable range recommended for fish culture as reported by Boyd CE [15] noted that a fall in pH level is caused by excessive microorganism respiration as well as fish waste, whereas photosynthesis raises pH. Also, Saeed SM [11] reported that differences in photosynthetic activities in drainage water used in fish farming may lead to alterations in pH values.
The average monthly values of dissolved oxygen are showed ranged from 4.93 to 5.70 mg/l in feed fish farm and from 5.53 to 6.40 mg/l in fertilizer fish farm ponds through the maximum DO production period (Dusck time) (Table 1). Shaker IM, et al. [16] suggested that oxygen solubility and production in pond water may be influenced by water temperature and phytoplankton photosynthesis. Ekubo AA, et al. [17] clarified that the fish can die if exposed to less than 0.3 mg L-1 of DO for an extended length of time; a minimum concentration of 1.0 mg L-1 DO is required to maintain fish for an extended period of time; and 5.0 mg L-1 are acceptable in fish ponds.
The monthly values of secchi disc readings are shown in Table 1. The SD readings ranged 16.0-23.0 cm in the feed ponds, being significantly higher than those of the fertilizer ponds (11.0-14.5 cm) on monthly basis. Secchi disc readings were least during winter months due to the reduced feeding pressure of zooplankton and fish on algae under low water temperature. Under low water temperature during winter months (15.6ͦC) zooplankton and fish reduce feeding rate, allowing increased biomass of phytoplankton under cold temperature. Feed ponds received slow even inputs of ammonia and phosphate overtime by-products of dietary protein metabolism in contrast with high organic fertilizer inputs applied in the fertilizer ponds. The fertilizer inputs had positive effect on phytoplankton which was excessive in abundance compared with those of the feed inputs. This was due the high organic manure inputs to pond water during all seasons including winter at one ton per feddan every 10 days. However, in feed ponds due to feeding pelleted diets at a rate 25 kg/feddan/day at the start of the production cycle which were increased gradually to 50 kg/feddan/day by the end of October. Secchi disc indicated higher abundance of algae in the fertilizer ponds and low abundance in the feed ponds. These results are in agreement with those obtained by Shaker, et al. Osman MA, et al. [18] observed that the lower level of secchi disc (13.0 – 16.3 cm) in pond water compared to that of the Inlet water (22.5 cm), in fish ponds secchi disc transparency provides a rough estimate of plankton abundance.
The pH, temperature and dissolved oxygen were the most influencing parameters in fish ponds, where their values in all ponds although fluctuated from time, to time they stayed within the acceptable and favorable levels required for growth, survival and well-being of Nile tilapia.
| Temperature (°C) | ||||||||||||
|---|---|---|---|---|---|---|---|---|---|---|---|---|
| Locations | Jul. | Aug. | Sept. | Oct. | Nov. | Dec. | Jan. | Feb. | Mar. | Apr. | May | Jun. |
| Feed Fish Farm | 29.7±1.1Aa | 30.9±0.5Aa | 29.3±0.4Aa | 25.7±1.2Ab | 24.5±1.2Ab | 18.5±1.1Ac | 15.6±1.4Ac | 12.7±1.5Ad | 16.9±1.4Ac | 21.5±1.2Ab | 24.5±1.2Ab | 28.3±1.2Aa |
| Fertilizer Fish Farm | 29.8±0.3Aa | 30.7±0.3Aa | 29±0.5Aa | 26.1±0.4Ab | 24.6±0.4Ab | 18.3±1.2Ac | 15.7±1.3Ac | 12.9±1.3Ad | 16.9±1.3Ac | 21.6±1.4Ab | 24.4±1.0Ab | 28.3±1.2Aa |
| pH | ||||||||||||
| Locations | Jul. | Aug. | Sept. | Oct. | Nov. | Dec. | Jan. | Feb. | Mar. | Apr. | May | Jun. |
| Feed Fish Farm | 8.1±0.2Ba | 8.2±0.4Ba | 8.2±0.3Ba | 8.2±0.3Aa | 8.2±0.3Ab | 7.9±0.4Ab | 7.8±0.4Ab | 7.6±0.4Aa | 7.9±0.3Ab | 8±0.3Ab | 8.1±0.4Ab | 8.1±0.4Aa |
| Fertilizer Fish Farm | 8.9±0.3Aa | 8.8±0.2Aa | 8.6±0.3Aa | 8.5±0.3Aa | 8.2±0.2Ab | 8.1±0.2Ab | 8±0.3Ab | 7.9±0.4Aa | 8±0.3Ab | 8.2±0.3Ab | 8.2±0.2Ab | 8.7±0.2Aa |
| Down Dissolved Oxygen (mg/l) | ||||||||||||
| Locations | Jul. | Aug. | Sept. | Oct. | Nov. | Dec. | Jan. | Feb. | Mar. | Apr. | May | Jun. |
| Feed Fish Farm | 1.02±0.00 Bb | 1.12±0.09Ab | 1.72±0.18Aa | 0.4±0.23Bd | 1.06±0.004Bb | 1.04±0.003Bb | 1.04±0.006Ab | 1.05±0.003Ab | 0.92±0.06Bc | 0.86±0.02Bc | 0.89±0.16Bc | 0.68±0.20Bd |
| Fertilizer Fish Farm | 1.19±0.05 Ac | 1.06±0.01 Ad | 1.4±0.24Ba | 1.16±0.04Ac | 1.23±0.01Aa | 1.27±0.18Ab | 1.04±0.19Ad | 1.02±0.005Ad | 1.27±0.022Ab | 1.42±0.37Aa | 1.16±0.04Ac | 1.4±0.24Aa |
| Dusck Dissolved Oxygen (mg/L) | ||||||||||||
| Locations | Jul. | Aug. | Sept. | Oct. | Nov. | Dec. | Jan. | Feb. | Mar. | Apr. | May | Jun. |
| Feed Fish Farm | 4.68±0.025Bc | 4.67±0.025Bc | 4.9±0.041Bc | 5.18±0.048Bb | 5.08±0.075Bb | 4.93±0.075Bb | 5.1±0.041Bb | 5.48±0.132Ba | 5.5±0.204Ba | 5.7±0.09Ba | 5.43±0.07Ba | 4.15±0.08Bd |
| Fertilizer Fish Farm | 5.53±0.075Ad | 5.78±0.048Ad | 6.02±0.048Ac | 6.33±0.048Aa | 6.4±0.041Aa | 6.15±0.065Ab | 5.93±0.063Ad | 6.13±0.111Ac | 6.18±0.063Ab | 6.25±0.10Aa | 6.18±0.07Ab | 6.4±0.09Aa |
| Sicch Disk (SD) (cm) | ||||||||||||
| Locations | Jul. | Aug. | Sept. | Oct. | Nov. | Dec. | Jan. | Feb. | Mar. | Apr. | May | Jun. |
| Feed Fish Farm | 23.0±1.0Aa | 20.3±1.4Ab | 18.3±0.6Ab | 17.3±0.5Ab | 18.1±0.6Ab | 17.6±1.1Ab | 16.8±1.1Ac | 16±0.4Ac | 15.7±0.4Ac | 16.8±0.5Ab | 17.8±0.5Ab | 19.3±0.4Ab |
| Fertilizer Fish Farm | 14.5±1.3Ba | 13.5±1.2Ba | 13.1±1.5Ba | 12.5±1.5Bb | 12±0.5Bb | 12±0.5Bb | 11.1±0.6Bb | 11±0.6Bb | 12.2±0.5Ba | 12.5±1.1Ba | 13.5±1.2Ba | 14.1±1.2Ba |
Table 1: Monthly fluctuations of water temperatures, pH, Dissolved oxygen, Sicch disk and Salinity in feed and fertilizer fish
Letters (a to d) show horizontal differences among months in the same fish farm.; A&B column show vertical differences between fish farms in the same month. Data shown with different letters are statistically different at P < 0.05 level. Table 1: Monthly fluctuations of water temperatures, pH, Dissolved oxygen, Sicch disk and Salinity in feed and fertilizer fish farms earthen ponds during the experimental period from July, 2014 to June, 2015.
Monthly average of salinity and electrical conductivity (EC) of water presented in Table 2. Salinity and EC have positive relationships with evaporation rate of water, which averages 144 cm per year in the Nile Delta. Data showed that the average monthly values of salinity ranged from 2.30 to 3.13 g/l in the feed ponds and from 2.39 to 3.18 g/l in the fertilizer ponds. Salinity tended to slightly increase during winter and spring months compared to summer, full months due to the regime of daily water renewal employed on both farming systems. The lower salinity values observed during summer and fall months may be also attributed to beginning the production cycle in summer and ending the production cycle in the following late spring, along with the accumulation of salinity overtime during the growing period. Moreover, there were not significant differences between the two fish farms in terms of EC among different ponds (P>0.05). These results are in agreement with Osman MA, et al, [18] showed that the inlet water had the lowest salinity (0.72 g/l) while the pond water had higher salinity range of 1.05-1.2g/l. Consequently, the regime of water renewal would affect salinity of water overtime during the growing period.
Monthly averages of total hardness and total alkalinity are illustrated in Table 2, the hardness tended to increase overtime during the production cycle from summer months (2014) to spring months (2015) from 256.3- 266.5 mg/l at the start of the experiment to 359.8-364 mg/l at the end of experiment. This may be due to the effect of metabolic CO2 excretion by fish and aquatic biota on the dissolution of carbonate salts in bottom sediment which are converted to soluble bicarbonate salts. Total alkalinity in the two farms changed randomly among treatments. The average alkalinity values were different between the feed and fertilizer farms (P<0.05). The fertilizer ponds had higher initial alkalinity (433.13 mg/l) compared to the feed ponds (374.75 mg/l) which may be due to the difference in the nature of water and chemistry of pond sediments among the two farming systems. Raju PARK, et al. [19] showed that the alkalinity may increase as a result of increased sodium and magnesium bicarbonates and carbonates evolving in water column. Begun A, et al. [20] reported that electrical conductivity is a useful parameter of water quality for indicating salinity; it is related to the amount of total dissolved solids (notably certain ionic salts) in the water body.
Orthophosphate and chlorophyll “a” concentrations in water are presented in Table 2. The average values of orthophosphate and chlorophyll “a” were higher in fertilizer ponds (0.316-0.400 mg PO4-P/l and 41.01-66.62 µg Chl “a”/l) than those of the feed ponds (0.108-0.224 mg PO4-P/l and 20.15-23.89 µg Chl “a”/l), respectively. Chlorophyll “a” abundance in aquatic environments is correlated to the presence of phosphorus a limiting element of biological productivity. Those clarify the orthophosphate and chlorophyll “a” had positive correlation with fertilizer supports that the increase of organic fertilizer with increasing water temperature affected positively chlorophyll content in water. Boyd CE [21] indicated that phosphate concentration above 0.1 mg/l is enough to induce algal bloom in water. Decomposition of manure releases phosphate which enhances algal growth needed for fish nutrition [22]. Moreover, Muhammad ZIT [23] reported that chicken manure play a central role in algal and plankton production in earthen ponds through the release of mineral phosphate needed for algal growth as well as the enhancement of abundance of aquatic fauna. Ekpenyong K [24] indicated that the rise of nutrient concentration in pond water has effect on algal and chlorophyll concentrations, while the grazing rate of zooplankton and fish on phytoplankton has a negative effect.
Data shown in Table 3, present monthly average of inorganic nitrogen compounds (TAN, NH4, NH3, NO2 and NO3) found in pond water in each of the two fish farms. Total ammonia nitrogen (TAN) was the major form of inorganic nitrogen ranged 0.9-1.66 mg TAN/l and 1.2-1.99 mg TAN/l in the feed and fertilizer ponds, respectively. Total ammonia nitrogen originates from organic matter decomposition (wast feed, dead algae and faces) as well as metabolic end products of protein catabolism by fish and aquatic fauna. Average values of toxic NH3 component had positive correlation with pH and water temperature. pH values in the feed pond was optimal for fish culture (7.6-8.2 units) which produced less toxic ammonia (0.01-0.12 mg NH3-N/l) than those of the fertilizer ponds (7.9-8.9 units) which produced higher level of toxic ammonia (0.02-0.55 mg NH3-N/l) being less favorable for fish growth especially during summer and fall. The application of large amount of chicken manure in the fertilizer ponds enhanced primary production raising pond pH values to excessive levels. This was reflected in higher toxic ammonia, being positively correlated with pond pH. TAN values were lower in the feed ponds than fertilizer ponds since feeding always provide slow release of metabolic ammonia and phosphate over longer period of time while chicken manure was applied at the rate of 1.0 tons dry weight per feddan every days including winter season. Chicken manure at this rate would release huge amount of TAN which escalate the pH values of pond water to unfavorable level concerning the percentage of toxic ammonia relative to TAN concentrations. Slow growth rate of fish would always be correlated with high toxic ammonia levels above 0.1 mg/l according to Boyd CE [7] and Boyd CE, et al. [25].
The NH4 and NH3 were significantly increased (P<0.05) in fertilizer fish ponds than feed fish ponds during all months. The average values of toxic NH3 were 0.11; 0.086; 0.015 and 0.073 mg/l in feed fish farm, while were 0.52; 0.18; 0.032 and 0.195 mg/l at fertilizer fish farm for summer, autumn, winter and spring months, respectively. The highest values of toxic ammonia were recorded in summer and autumn months due to the warmth of these seasons. From the results, the TAN, NO2 and NO3 concentrations were significantly (P<0.05) increased in fertilizer fish ponds than feed fish ponds during all months. These results may be due to increase in the chicken manure application rates (100 kg dry matter/ feddan/day) during the whole growing period including winter season. The decomposition of chicken manure helped to release large amount of NH4 and NH3 compounds, acting as fertilizers which increased photosynthetic activities. Inorganic nitrogen salts can be considered important nutrients that control algal growth and abundance especially when orthophosphate are abundant. Phosphates are known to limit phytoplankton productivities when deleted in pond water. Saeed SM, et al. [11] indicated that seasonal oscillation in total ammonia concentrations (TAN) took place in his trial, with the least ammonia level observed in summer and fall. This may be induced by NH4-N uptake by algal community.
Nitrate concentration were lower during summer and spring months in all treatments which may be induced by lower DO required for nitrification at the sediment-water interface. While, autumn and winter months are characterized by continual mixing of water isotherm distribution in water column under lower temperature and high wind speed. The availability of oxygen during autumn and winter months in expected to be high enhancing nitrification by nitrifies which increase in activities under ample oxygen concentrations at the sediment-water interface. In the fertilizer fish farm nitrate averaged 0.23-0.6 mg/l during autumn- winter months period and decreased to 0.15-0.18 mg/l during spring- summer period, nitrification rates are known to increase with the availability of oxygen at the sediment- water interface. However, nitrate concentrations during most of the year, except for autumn months, were significantly low and their effect on algal productivity may be limited when compared to TAN concentrations. Consequently algal dynamics were mostly affected by TAN concentrations originating for chicken manure decomposition and metabolic execration by fish and aquatic fauna. Saeed SM, et al. [11] indicated that lower concentrations of nitrate during summer months may be attributed to the high algal uptake and intense photosynthesis under warm water and intense radiation.
| Salinity (g/l) | ||||||||||||
|---|---|---|---|---|---|---|---|---|---|---|---|---|
| Locations | Jul. | Aug. | Sept. | Oct. | Nov. | Dec. | Jan. | Feb. | Mar. | Apr. | May | Jun. |
| Feed Fish Farm | 2.85±0.11Ab | 2.63±0.11Ab | 2.3±0.1Ac | 2.38±0.12Ac | 2.7±0.13Ab | 2.53±0.12Ac | 2.53±0.12Ac | 3.08±0.12Aa | 3.2±0.1Aa | 3.03±0.13Aa | 3.13±0.13Aa | 3.13±0.13Aa |
| Fertilizer Fish Farm | 3.04±0.12Aa | 2.61±0.13Ab | 2.4±0.1Ac | 2.39±0.11Ac | 2.68±0.11Ab | 2.49±0.11Ac | 2.49±0.11Ab | 2.92±0.13Aa | 3.18±0.12Aa | 3.12±0.13Aa | 3.16±0.12Aa | 3.16±0.12Aa |
| Electrical conductivity (EC) (mS/cm) | ||||||||||||
| locations | Jul. | Aug. | Sept. | Oct. | Nov. | Dec. | Jan. | Feb. | Mar. | Apr. | May | Jun. |
| Feed Fish Farm | 5.53±0.22Aa | 5.53±0.12Aa | 5.05±0.22Ab | 50±0.1Ab | 5.6±0.12Aa | 5.45±0.14Aa | 5.45±0.15Aa | 5.68±0.17Aa | 5.56±0.24Aa | 5.35±0.23Aa | 5.55±0.15Aa | 5.55±0.23Aa |
| Fertilizer Fish Farm | 5.45±0.2Aa | 5.36±0.24Aa | 5.12±0.13Ab | 5.04±0.25Ab | 5.55±0.15Aa | 5.46±0.22Aa | 5.46±0.12Aa | 5.59±0.14Aa | 5.55±0.17Aa | 5.5±0.1Aa | 5.58±0.24Aa | 5.58±0.12Aa |
| Total alkalinity (mg/L) | ||||||||||||
| Locations | Jul. | Aug. | Sept. | Oct. | Nov. | Dec. | Jan. | Feb. | Mar. | Apr. | May | Jun. |
| Feed Fish Farm | 375±22Ba | 380±30Ba | 388±36Ba | 352.5±22Bb | 320.5±14Bc | 302.5±18Bd | 310±15Bd | 320±12Bc | 335±14Bc | 355±24Bb | 365±15Ba | 370±18Ba |
| Fertilizer Fish Farm | 412±34Ab | 445±33Ab | 475±36Aa | 465±22Aa | 440±20Ab | 424±20Ac | 404±13Ad | 412±11Ac | 420±18Ac | 435±22Ab | 445±14Ab | 440±16Ab |
| Total Hardness (mg/L) | ||||||||||||
| Locations | Jul. | Aug. | Sept. | Oct. | Nov. | Dec. | Jan. | Feb. | Mar. | Apr. | May | Jun. |
| Feed Fish Farm | 257±11Ac | 294.5±15Ab | 222±14Ac | 227.5±12Ac | 312.5±16Ab | 305±18Ab | 305±14Ab | 317.5±12Ab | 342.5±18Aa | 369±20Aa | 369±24Aa | 375.25±20Aa |
| Fertilizer Fish Farm | 278.5±14Ac | 294.65±12Ab | 231.4±12Ac | 237.75±11Ac | 313.45±13Ab | 308.5±12Ab | 308.5±14Ab | 326.75±15Ab | 331.25±14Aa | 360.5±12Aa | 367.75±20Aa | 379.23±20Aa |
| Orthophosphate (mg/L) | ||||||||||||
| Locations | Jul. | Aug. | Sept. | Oct. | Nov. | Dec. | Jan. | Feb. | Mar. | Apr. | May | Jun. |
| Feed Fish Farm | 0.101±0.01Bc | 0.115±0.01Bc | 0.137±0.011Bb | 0.143±0.011Bb | 0.144±0.012Bb | 0.151±0.012Bb | 0.154±0.012Bb | 0.203±0.02Ba | 0.212±0.02Ba | 0.222±0.021Ba | 0.232±0.022Ba | 0.231±0.02Ba |
| Fertilizer Fish Farm | 0.278±0.01Ad | 0.353±0.01Ac | 0.387±0.015Ab | 0.398±0.017Ab | 0.399±0.012Ab | 0.355±0.011Ac | 0.347±0.014Ac | 0.311±0.024Ac | 0.326±0.022Ac | 0.404±0.024Aa | 0.437±0.023Aa | 0.433±0.022Aa |
| Chlorophyll a (µg/L) | ||||||||||||
| Locations | Jul. | Aug. | Sept. | Oct. | Nov. | Dec. | Jan. | Feb. | Mar. | Apr. | May | Jun. |
| Feed Fish Farm | 17.61±1.56Bd | 21.98±1.77Bb | 25.47±2.04Ba | 26.31±2.08Bb | 19.54±1.74Bc | 20.32±1.66Bc | 20.68±1.47Bc | 26.13±2.11Bb | 19.08±1.77Bc | 23.5±1.98Bb | 24.28±1.89Bb | 28.71±2.13Ba |
| Fertilizer Fish Farm | 52.15±1.53Ac | 62.93±2.27Ab | 69.99±2.65Aa | 68.08±2.34Aa | 61.78±2.37Ab | 62.58±2.53Ab | 63.03±2.55Ab | 56.16±2.57Aa | 43.63±1.55Ad | 35.38±1.69Ac | 37.58±1.67Ac | 47.47±2.37Aa |
Table 2: Monthly fluctuations of water Sicch disk, Salinity and Electrical conductivity, Electrical conductivity, Total alkali
Letters (a to c) show horizontal differences among months in the same fish farm.; A&B column show vertical differences between fish farms in the same month. Data shown with different letters are statistically different at P < 0.05 level. Table 2: Monthly fluctuations of water Sicch disk, Salinity and Electrical conductivity, Electrical conductivity, Total alkalinity, Total Hardness, Orthophosphate and Chlorophyll “a” in feed and fertilizer fish farms earthen ponds during the experimental period from July, 2014 to June, 2015.
| Total ammonia nitrogen (TAN, mg/l) | ||||||||||||
|---|---|---|---|---|---|---|---|---|---|---|---|---|
| Locations | Jul. | Aug. | Sept. | Oct. | Nov. | Dec. | Jan. | Feb. | Mar. | Apr. | May | Jun. |
| Feed Fish Farm | 1.1±0.11Bb | 1.3±0.13Ab | 1.4±0.14Ba | 1.45±0.16Ba | 1.66±0.14Ba | 1.4±0.13Ba | 1.1±0.11Bb | 1±0.04Bc | 0.9±0.05Bc | 1.07±0.08Bb | 1.2±0.11Bb | 1.3±0.11Bb |
| Fertilizer Fish Farm | 1.6±0.14Ab | 1.7±0.15Ab | 1.9±0.17Aa | 1.9±0.17Aa | 1.95±0.15Aa | 1.85±0.14Aa | 1.6±0.11Ab | 1.2±0.08Ac | 1.2±0.08Ac | 1.3±0.11Ac | 1.5±0.13Ab | 1.6±0.13Ab |
| Ammonia (NH) (mg/L) 3 | ||||||||||||
| Locations | Jul. | Aug. | Sept. | Oct. | Nov. | Dec. | Jan. | Feb. | Mar. | Apr. | May | Jun. |
| Feed Fish Farm | 0.092±0.017Bb | 0.114±0.012Ba | 0.125±0.023Ba | 0.105±0.013Ba | 0.115±0.010Ba | 0.038±0.004Bc | 0.018±0.000Bd | 0.01±0.001Bd | 0.016±0.000Bd | 0.0418±0.004Bc | 0.068±0.012Bb | 0.107±0.013Ba |
| Fertilizer Fish Farm | 0.559±0.033Aa | 0.493±0.038Aa | 0.496±0.047Aa | 0.31±0.034Ab | 0.156±0.029Ac | 0.064±0.012Ad | 0.041±0.004Ad | 0.023±0.005Ad | 0.031±0.003Ad | 0.066±0.005Ad | 0.104±0.010Ac | 0.416±0.046Ab |
| Ammonium (NH) (mg/L) 4 | ||||||||||||
| locations | Jul. | Aug. | Sept. | Oct. | Nov. | Dec. | Jan. | Feb. | Mar. | Apr. | May | Jun. |
| Feed Fish Farm | 1.01±0.059Bc | 1.19±0.018Bb | 1.28±0.032Ba | 1.04±0.020Bc | 1.55±0.0418Ba | 1.36±0.016Ba | 1.08±0.093Bc | 0.99±0.013Bd | 0.89±0.014Bd | 1.03±0.021Bc | 1.13±0.094Bb | 1.19±0.021Bb |
| Fertilizer Fish Farm | 1.04±0.041Ad | 1.21±0.070Ac | 1.4±0.054Ab | 1.59±0.036Aa | 1.79±0.017Aa | 1.78±0.008Aa | 1.56±0.018Aa | 1.18±0.012Ac | 1.17±0.024Ac | 1.23±0.023Ac | 1.4±0.043Ab | 1.19±0.043Ac |
| Nitrite NO (mg/L) 2 | ||||||||||||
| locations | Jul. | Aug. | Sept. | Oct. | Nov. | Dec. | Jan. | Feb. | Mar. | Apr. | May | Jun. |
| Feed Fish Farm | 0.022±0.002Bd | 0.031±0.002Bc | 0.042±0.002Bb | 0.047±0.003Ba | 0.053±0.002Ba | 0.034±0.001Bb | 0.03±0.001Bc | 0.03±0.0001Bc | 0.03±0.0001Bc | 0.039±0.002Bb | 0.044±0.01Bb | 0.051±0.02Ba |
| Fertilizer Fish Farm | 0.088±0.002Ad | 0.108±0.01Ac | 0.153±0.02Ab | 0.176±0.02Ab | 0.189±0.01Aa | 0.155±0.002Ab | 0.093±0.002Ad | 0.081±0.0001Ad | 0.072±0.001Ad | 0.086±0.002Ad | 0.133±0.01Ac | 0.203±0.02Aa |
| Nitrate (NO) (mg/L) 3 | ||||||||||||
| locations | Jul. | Aug. | Sept. | Oct. | Nov. | Dec. | Jan. | Feb. | Mar. | Apr. | May | Jun. |
| Feed Fish Farm | 0.04±0.01Bc | 0.051±0.01Bc | 0.077±0.02Bb | 0.11±0.02Ba | 0.13±0.01Ba | 0.12±0.01Ba | 0.083±0.002Bb | 0.05±0.001Bc | 0.022±0.002Bd | 0.033±0.002Bd | 0.05±0.01Bc | 0.082±0.01Bb |
| Fertilizer Fish Farm | 0.134±0.01Ac | 0.185±0.02Ac | 0.456±0.02Ab | 0.647±0.02Aa | 0.715±0.01Aa | 0.412±0.01Ab | 0.169±0.02Ac | 0.12±0.001Ad | 0.09±0.001Ad | 0.099±0.002Ad | 0.148±0.01Ac | 0.408±0.02Ab |
Table 3: Monthly fluctuations of water Total ammonia nitrogen, Ammonia, Ammonium, Nitrite and Nitrate in feed and fertilizer f
Letters (a to d) show horizontal differences among months in the same fish farm.; A to B column show vertical differences between fish farms in the same month. Data shown with different letters are statistically different at P < 0.05 level. Table 3: Monthly fluctuations of water Total ammonia nitrogen, Ammonia, Ammonium, Nitrite and Nitrate in feed and fertilizer fish farms earthen ponds during the experimental period from July to June (2014-2015).
Phytoplankton in fish ponds were classified into four main genera, namely Chlorophyta; Bacillariophyta; Cyanophyta and Euglenophyta. Monthly data of algal abundance indicated that Chlorophyta were significantly increased in the two fish farms (P<0.05) compared to other groups (Table 4). Phytoplankton abundance in pond water depends on nitrogen and phosphorus inputs in water as influenced by metabolic wastes excretions by aquatic fauna and manure decomposition by bacterial activities. Nutrient inputs in the fertilizer ponds were higher than those of feed ponds as indicated by their higher abundance of algal of different genera. Total number of algal cell of different genera averaged 5.48 million cells/l in the feed ponds while those of the fertilizer ponds (13.76 million cells/l), were significantly higher. Chlorophyta density higher than Bacillariophyta on annual basis (P<0.05), followed by Cynanophyta, the least algal density was observed in Euglenophyta in both the fertilizer and feed farms (P<0.05). Chlorophyta; Bacillariophyta; Cyanonphyta and Euglenophyta were all higher in fertilizer ponds than in feed ponds, during all seasons. Algal density (million cells/l) of all genera did not have variations among seasons in feed farm.
Monthly abundance in the feed farmed ranged 2.2- 2.6 million celld/l for Chlorophyta, 1.4-1.6 million cells/l Bacillariophyta, 0.91- 1.17 million cells/l for Cyanophyta, and 0.45-0.61 million cells/l for Euglenophyta. This may be due to the slow and an even release of metabolic wast products (ammonia and phosphate) during different seasons. However, algal abundance of all genera in the fertilizer farm had higher density in water during summer and autumn warm period (16.0-16.5 million cells/l) compared to winter and spring which are considered cold period (11.35-12.35 million cells/l). This may be due to the effect of cold water during winter and early spring on photosynthetic activities and algal abundance. Algal abundance during summer and autumn season were higher in the two fish farms compared to other seasons during the experimental period. The annual average of phytoplankton groups in feed fish farm ponds were 2.4; 1.52; 1.03 and 0.53million cells/l and in fertilizer fish ponds were 6.55; 4.77; 1.53 and 0.91million cells/l for the same order, respectively. Phytoplankton abundance and algal quality determine the availability natural food with high protein content to herbivorous fish such as Nile tilapia and mullet. The controlled application and fertilizer management in earthen ponds are known to enhance plankton productivities [26, 27]. Nitrogen to phosphorus ratio in phytoplankton approximates 10:1, consequently fertilizer application in pond water should be balanced in order to enhance algal productivities [28]. High nutrient inputs in culture ponds, enhance algal production, which increase biological turbidity and reduce photic depth [29, 30]. Nitrogen and phosphorus inputs are critical to the well-being of algal communities which are considered as ecological indicators [29, 30].
Zooplankton densities were enhanced through the application of chicken manure in fertilized ponds, producing higher zooplankton densities compare to the feed ponds which depended solely on feed input as source of nutrition input. The positive correlation between zooplankton abundance and phytoplankton densities enhanced zooplankton abundance under warm water conditions in summer and autumn (total abundance: 28.1- 30.81 x10⁴ organisms/l) compared to cold water condition during winter and spring (23.8-24.79 x10⁴ organisms/l) in the fertilizer ponds. The lack of organic fertilizer effects on zooplankton abundance in the feed ponds, greatly reduce total abundance of zooplankton due to the absence of manuring. Total zooplankton abundance in the feed ponds ranged 10.82-11.87 x10⁴ organisms/l during warm summer and autumn, which were reduced to 9.16-9.61 x10⁴ organisms/l during cold winter and spring.
The effect of water temperature on zooplankton abundance was evident when warm season are compare to cold season. Comparing abundance of the same groups among different season produced similar results in terms of the positive effect of warm temperature on zooplankton abundance and development (the Q-10 question). Natural food abundance in ponds supplements nutritional requirements of fish in terms of energy and protein, reducing the requirements for artificial feed inputs. This will be reflected in terms of lower feeding costs and improved farm revenues. Chicken manure is considered as best organic manure used in widespread fashion in fish ponds for increasing natural food abundance (i.e. zooplankton). The lower cost of chicken manure relative of production output, helped its widespread use in fish farming practices. Bwala RL, et al. [31] indicated the zooplankton not only depend on phytoplankton as a nutritional source but also consume bacterial detritus and organic manure in pond water, which lower feeding pressure on phytoplanking. This allows algal reproduction increasing their abundance in pond water (Table 5).
| Month/Loca- tions | Jul. | Aug. | Sept. | Oct. | Nov. | Dec. | Jan. | Feb. | Mar. | Apr. | May | Jun. |
|---|---|---|---|---|---|---|---|---|---|---|---|---|
| Chlorophyta (Org./l X 106) | ||||||||||||
| Feed Farm | 2.58Ba±0.12 | 2.66Ba±0.11 | 2.71Ba±0.13 | 2.61Ba±0.1 | 2.51Ba±0.11 | 2.35Bb±0.11 | 2.12Bb±0.1 | 2.13Bb±0.1 | 2.20Bb±0.1 | 2.29Bb±0.1 | 2.32Bb±0.1 | 2.39Bb±0.1 |
| Fertilizer Farm | 7.26Aa±0.33 | 7.71Aa±0.35 | 7.82Aa±0.34 | 7.63Aa±0.36 | 7.06Aa±0.33 | 6.35Ab±0.31 | 5.23Ac±0.23 | 5.10Ac±0.21 | 5.38Ac±0.23 | 5.93Ab±0.24 | 6.33Ab±0.24 | 6.79Ab±0.23 |
| Bacillarophyta (Org./l X 106) | ||||||||||||
| Feed Farm | 1.57Ba±0.11 | 1.66Ba±0.11 | 1.70Ba±0.13 | 1.64Ba±0.11 | 1.59Ba±0.11 | 1.48Bb±0.11 | 1.34Bb±0.1 | 1.37Bb±0.1 | 1.42Bb±0.1 | 1.46Bb±0.11 | 1.48Bb±0.11 | 1.56Ba±0.12 |
| Fertilizer Farm | 5.34Ab±0.31 | 5.86Aa±0.33 | 5.96Aa±0.35 | 5.64Aa±0.27 | 5.20Ab±0.21 | 4.42Ac±0.13 | 3.69Ad±0.14 | 3.70Ad±0.14 | 3.91Ad±0.13 | 4.18Ac±0.14 | 4.52Ac±0.14 | 4.86Ab±0.15 |
| Cyanophyta (Org./lX 106) | ||||||||||||
| Feed Farm | 1.10Ba±0.03 | 1.21Ba±0.03 | 1.22Ba±0.04 | 1.18Ba±0.04 | 1.12Bb±0.03 | 1.04Bb±0.03 | 0.91Bc±0.01 | 0.79Bd±0.01 | 0.81Bd±0.01 | 0.93Bc±.02 | 1.0Bc±0.02 | 1.04Bb±0.02 |
| Fertilizer Farm | 1.71Ab±0.03 | 2.15Aa±0.03 | 2.33Aa±0.04 | 2.11Aa±0.03 | 1.87Ab±0.02 | 1.32Ac±0.02 | 1.07Ac±0.01 | 0.89Ad±0.01 | 0.95Ad±0.01 | 1.09Ad±0.01 | 1.28Ac±0.02 | 1.54Ac±0.02 |
| Euglenophyta (Org./lX 106) | ||||||||||||
| Feed Farm | 0.58Ba±0.01 | 0.62Ba±0.02 | 0.64Ba±0.02 | 0.60Ba±0.02 | 0.55Ba±0.02 | 0.49Ba±0.01 | 0.42Ba±0.01 | 0.45Ba±0.01 | 0.48Ba±0.01 | 0.50Ba±0.01 | 0.53Ba±0.02 | 0.55Ba±0.02 |
| Fertilizer Farm | 0.87Ac±0.03 | 1.17Ab±0.03 | 1.24Ab±0.03 | 1.33Aa±0.03 | 1.39Aa±0.02 | 1.03Ab±0.02 | 0.64Ad±0.01 | 0.61Ad±0.01 | 0.58Ad±0.02 | 0.61Ad±0.02 | 0.67Ad±0.03 | 0.76Ac±0.03 |
Table 4: Monthly fluctuations of phytoplankton (Org./l X 106) in the feed and fertilizer fish farms during the experimental pe
a, b, c, … means with different Letters (superscripts) in the same row are significantly different (P>0.05); A, B, C,… means with different Letters (superscripts) in the same column are significantly different (P>0.05). Table 4: Monthly fluctuations of phytoplankton (Org./l X 106) in the feed and fertilizer fish farms during the experimental period.
| Month/Location | Jul. | Aug. | Sept. | Oct. | Nov. | Dec. | Jan. | Feb. | Mar. | Apr. | May | Jun. |
|---|---|---|---|---|---|---|---|---|---|---|---|---|
| Cladocera (Org./L X 104) | ||||||||||||
| Feed Farm | 2.7 Ba±0.12 | 2.87Ba±0.21 | 3.11Ba±0.23 | 2.99Ba±0.23 | 2.69Bb±0.23 | 2.421Bb±0.11 | 2.179Bc±0.17 | 1.966Bd±0.16 | 2.039Bc±0.19 | 2.223Bc±0.19 | 2.420Bb±0.15 | 2.644Bb±0.18 |
| Fertilizer Farm | 7.09Ab±0.33 | 7.46Ab±0.33 | 8.06Aa±0.34 | 7.77Aa±0.33 | 6.97Ab±0.22 | 6.269Ac±0.23 | 5.667Ad±0.23 | 5.119Ad±0.21 | 5.329Ad±0.24 | 5.785Ac±0.22 | 6.303Ac±0.27 | 6.872Ab±0.31 |
| Copepoda (Org./L X 104) | ||||||||||||
| Feed Farm | 3.01Bb±0.11 | 3.23Ba±0.11 | 3.425Ba±0.12 | 3.578Ba±0.11 | 3.461Ba±0.12 | 3.115Bb±0.12 | 2.810Bb±0.1 | 2.547Bc±0.1 | 2.489Bc±0.1 | 2.582Bc±0.12 | 2.760Bc±0.11 | 2.976Bb±0.13 |
| Fertilizer Farm | 7.87Ab±0.16 | 8.380Ab±0.17 | 8.917Aa±0.15 | 9.290Aa±0.14 | 8.989Aa±0.13 | 8.095Ab±0.13 | 7.298Ac±0.11 | 6.621Ad±0.11 | 6.476Ad±0.12 | 6.714Ad±0.12 | 7.173Ac±0.13 | 7.733Ac±0.16 |
| Ostracoda (Org./L X 104) | ||||||||||||
| Feed Farm | 2.777Bb±0.11 | 3.038Ba±0.21 | 3.169Ba±0.17 | 3.222Ba±0.18 | 3.194Ba±0.15 | 2.920Bb±0.11 | 2.638Bc±0.12 | 2.364Bd±0.11 | 2.217Bd±0.11 | 2.265Bc±0.11 | 2.389Bd±0.13 | 2.623Bc±0.13 |
| Fertilizer Farm | 7.205Ab±0.23 | 7.854Ab±0.25 | 8.220Aa±0.23 | 8.368Aa±0.23 | 8.297Aa±0.23 | 7.574Ab±0.21 | 6.852Ac±0.22 | 6.139Ac±0.22 | 5.756Ad±0.15 | 5.884Ad±0.14 | 6.207Ac±0.17 | 6.785Ac±0.17 |
| Rotifera (Org./l x 104) | ||||||||||||
| Feed Farm | 1.904Bb±0.03 | 2.093Ba±0.1 | 2.226Ba±0.11 | 2.256Ba±0.11 | 2.289Ba±0.11 | 2.171Ba±0.1 | 1.953Bb±0.1 | 1.757Bb±0.1 | 1.666Bc±0.11 | 1.722Bc±0.11 | 1.784Bb±0.11 | 1.860Bb±0.11 |
| Fertilizer Farm | 4.939Ac±0.14 | 5.459Ab±0.15 | 5.783Aa±0.12 | 5.867Aa±0.13 | 5.941Aa±0.13 | 5.624Ab±0.14 | 5.087Ac±0.13 | 4.564Ad±0.13 | 4.327Ad±0.13 | 4.477Ad±0.13 | 4.629Ac±0.15 | 4.837Ac±0.17 |
Table 5: Monthly fluctuations of zooplankton (Org./l X 104) in the feed and fertilizer fish farms during the experimental peri
a, b, c, … means with different Letters (superscripts) in the same row are significantly different (P>0.05); A, B, C,… means with different Letters (superscripts) in the same column are significantly different (P>0.05). Table 5: Monthly fluctuations of zooplankton (Org./l X 104) in the feed and fertilizer fish farms during the experimental period.
Conclusion
The study carried out on the water properties of two fish farms has allowed the assessment and evaluation of the effects of different management systems on physical- chemical water quality. The results indicated that the management of ponds is responsible for the large changes in water properties. Note that the use of fertilization in ponds has a significant impact on the level of nitrogen and oxygen compounds, in addition to the blooming of phytoplankton and zooplankton compared to ponds that rely on the use of manufactured feed.
Acknowledgments
The authors are grateful to the Australian Government for funding this research. Thanks are also extended to ARC, ICARDA, and IWMI scientists for their guidance and support.
References
-
Boyd CE, McNevin AA, Davis RP (2022) The contribution of fisheries and aquaculture to the global protein supply. Food security 14(3): 805-827.
-
FAO (2020a) Fisheries and aquaculture statistics. Global aquaculture and fisheries production 1950- 2018 (Fishstat). Rome: FAO Fisheries and Aquaculture Department.
-
FAO (2020b) The state of world fisheries and aquaculture. FAO.
-
EL-Gayar OF (2003) Aquaculture in Egypt and Issues for Sustainable Development. Aquaculture Economics & Management 7(1-2): 137-154.
-
Ali AE, Othman AK, Othman J (2009) Prediction of Johor River Water Quality Parameters Using Artificial Neural Networks. European Journal of Scientific Research 28(3): 422-435.
-
Boyd CE, McNevin AA (2015) Aquaculture resource use and environmental. John Wily and Sons, pp: 366.
-
Boyd CE (1990) Water quality in ponds for aquaculture. Alabama Agricultural Experimental Station, Auburn University, Albama, USA, pp: 482.
-
American Public Health Association (APHA) (2000) Standard Methods for the Examination of Water and waste water. In: 20th (Edn.), American Public Health Association, American Water Works Association and Water Environmental Federation, Washington DC, USA.
-
Vollenweider RA (1969) Amanual on methods for measuring primary production in aquatic environments. 1 BPH and b. No. 12, Blackwell Sci. Publ, Oxford, pp: 213.
-
Statistical Analysis System (SAS) (2000) SAS program ver.612, SAS institution corporation, cary, NC 27513 USA.
-
Saeed SM (2013) Impact of environmental parameters on fish condition and quality in Lake Edku, Egypt. Egypt J Aquat Biol & Fish 17(1): 101-112.
-
Mohammed AA, Ahmed EA, Saeed SM, Dawah AM, Salah El Din RA (2017) A study on phytoplankton distribution, abundance and community structure in fish ponds of al-abbassa fish farm in relation to physico-chemical properties of water. Egyptian Journal of Phycology 18(1): 21-44
-
Indian Council of Agriculture Research (ICAR) (2011) Handbook of Fisheries and Aquaculture. ICAR publication, New Delhi, India, pp: 1116.
-
Santhosh B, Singh NP (2007) Guidelines for water quality management for fish culture in Tripura, ICAR Research Complex for NEH Region, Tripura Center, Publication no.29.
-
Boyd CE (1998) Water Quality for Pond Aquaculture. Research and Development Series. International Centre for Aquaculture and Aquatic Environment, Alabama Agriculture Experiment Station, Auburn University, Alabama, USA, pp: 37.
-
Shaker IM, Abou Zeid MY, Batran A (2013) Effect of using periphyton substrate (bamboo stems) on water quality, phytoplankton, zooplankton, periphyton and growth performance for tilapia, mullet and catfish in earthen ponds. Abbassa Int J Aqua 6(1): 108-139.
-
Ekubo AA, Abowei JFN (2011) Review of Some Water Quality Management Principles in Culture Fisheries. Res J Appl Sci Eng Technol 3(12): 1342-1357.
-
Osman MA, Mohamed MAMM, Ali HH, Al-Afify ADG (2010) Assessment of agriculture drainage water quality to be used for fish farm irrigation. Nature and Science 8(8): 60-74.
-
Raju PARK, Reddy MSR, Raghuram P, Suri Babu G, Rambabu T, et al. (2014) Alkalinity and Hardness Variation in Ground Waters of East Godavari District due to Aquaculture. International Journal of Fisheries and Aquatic Studies 1(6): 121-127.
-
Begun A, Ramaiah M, Harikrishna KI, Veena K (2009) Heavy metal pollution and chemical profile of Cauvery River water. E-Journal of Chemistry 6(1): 47-52.
-
Boyd CE (2000) Water quality, An introduction. Springer Science and Business Media, New York, pp: 325.
-
Sevilleja R, Torres J, Sallows J, Little D, (2001) Using animal waste in fish ponds. In: Halwart M, Gonsalves J, et al. (Eds.), Integrated Agriculture-aquaculture. FAO Fisheries Technical Paper 407, FAO, Rome (Italy).
-
Muhammad ZIT (2008) Studies on partial replacement of fish meal with oil seed meals in the diet of major carps in semi-intensive culture system. University of Agriculture, Faisalabad, Pakistan, pp: 200.
-
Ekpenyong K (2000) Algal biomass and pigment diversity in typical tropical fish ponds. Tropical Ecology 41(1): 89-94.
-
Boyd CE, Tucker CS (1998) Water Quality and Pond Soil Analysis for Aquaculture., Alabama agriculture Experiment Station, Alabama, USA, pp: 700.
-
Abbas G (2001) Effect of NPK fertilization on the physicochemical characteristics of water and soil and on the dry weight of planktonic and benthic biomass in carp ponds. Indian Journal of Animal Sciences 71(6): 597-603.
-
Wang HJ, Liang XM, Jiang PH, Wang J, Wu SK, et al. (2008) TN: TP ratio and planktivorous fish do not affect nutrient- chlorophyll relationships in shallow lakes. Freshwater Biology 53(5): 935-944.
-
Knosche R, Schreckenbach K, Pfeifer M, Weissenbach H (2000) Balances of phosphorus and nitrogen in carp ponds. Fisheries Management and Ecology 7(1-2): 15- 22.
-
Lindo MK (1991) Zooplankton populations of the coastal zone and nearshore waters of Hellshire: St. Catherine, Jamaica. Estuarine Coastal and Shelf Science 32: 597- 608.
-
Webber DF, Webber MK (1998) The water quality of Kingston Harbour: evaluating the use of the planktonic community and traditional water quality indices. Chemistry and Ecology 14(3-4): 357-374.
-
Bwala RL, Omoregie E (2009) Enrichment of fish ponds: application of pig dung vs. tilapia yield. Asian Network for Scientific Information. Pakistan Journal of Nutrition 8(9): 1373-1379.
- Genetic Improvement of Nile Tilapia (Oreochromis niloticus): Advances in Selective Breeding and Genomic Approaches for Sustainable Aquaculture
- Microplastics, Contaminants, and Waste Hotspots: Divergences and Faults in Prioritizing Control Efforts
- Creating a Healthier, More Vibrant Open and Closed Aquatic Environment. A Submersible, Centrifugal Magnetically Affixed Current Changing Aquarium Pump
- An Attempt to Assess Alpha Diversity and Sample Size: Using the Ostracod Assemblages off Kumamoto Port, Japan
- Assessment of the Efficiency of Common Fishing Gears and Crafts Used at Mohananda River of Chapai Nawabganj, Bangladesh
- Fish Productivity and Biodiversity Status of Sundarban Mangrove in Bangladesh