Assessment and Monitoring of Microbial Pollution in Certain Drinking and Bathing Water Ponds in and Around Sivagangai
Microbiological examination of water sample is usually undertaken to ensure that the water is safe to drink and bath in. Many potential pathogens could be associated with the water. In this juncture it is very important to protect and conserve the surface and ground water from the microbial contamination. The successful microbial pollution abatement depends not only on treatment and control but also on efficient monitoring of drinking and bathing water resources. For this, research approaches are very important for providing potable and safe drinking and bathing water to the humanity
Introduction
Water provides an ideal environment for a wide variety of micro-organisms to survive and function. Among these microbes, some of the bacterial organisms can infect human beings. Safe water must be free from the contamination of micro-organisms [1]. Drinking and Bathing water are liable to contamination with sewage or other excreted material. This contamination may cause serious intestinal and other systemic infections to human population. This hazard of water pollution is of two kinds. One is Biological and the other one is Chemical. Contaminated water provides an excellent medium for the growth of micro-organisms like salmonella typhi, Vibrio-cholerae, Giardialamblia, Polio-myelitis virus and Hepatitis virus [2]. According to 1980 study by the WHO nearly 30000 people die every day in developing countries of the world, because of unsanitary supplies.
The purity of drinking water is evaluated by testing the presence of harmful microbial organisms like coliforms as evidence of faecal contamination. The coliform bacteria include Escherichia coli, Streptococcus feacalis and Clostridium welchii. Of these E-coli is the most predominant coliform. They are the human intestinal coliforms. Hence the identification of the faceal coliforms and E-coli bacteria are more important to understand the purity of drinking water.
In the same way the assessment of microbial contamination is considered more important for the use of any water bodies for bathing and other purpose. In this juncture, the following micro-bial assays were conducted in the water samples collected from two bathing water ponds (Sivagangai Theppakkulam & Sivagangai Chettiyurani) and two drinking water sources (one from Mallamputti Chettiyurani a drinking water pond and other from the municipal drinking water) (Tables 2-4).
Materials and Method
Collection of Water Sample
Water samples from the drinking water and bathing water pond are collected as the procedure given in the text book of microbiology- by Chakra Borthy, [3] in sterilized glass bottle of 250ml with ground glass stopper protected by Kraft paper (Tables 2 & 3).
Collection of Water Sample from Tap Water
Sivagangai municipal tap water was collected in sterilized glass bottles. Before collection of water sample, the mouth of the tap was flamed with a sprit lamp. The tap was turned and allowed to flow for 5 minutes and then the bottle was filled with water (Table 5).
Transport of Water Samples to the Laboratory
The water samples immediately after collection were taken to the lab and examined at the earliest possible. The samples were assayed within 3 hours.
Neutralization of Chlorine
The municipal water is usually chlorinated. Hence at the time of collecting the water sample from municipal tap, neutralization was done by adding a crystal of sodium thiosulphate into the bottle before collection.
The following procedures were followed for the estimation of total bacterial population, total coliform and total faecal coliforms (E-coli) to understand the sanitary condition of the drinking and bathing waters.
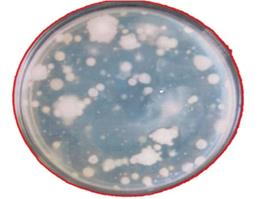
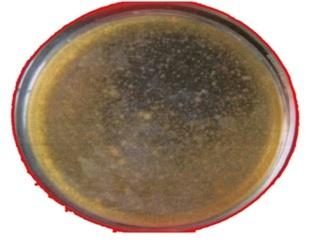
Serial Dilution Agar Plating Method
This method is a viable plate count method commonly used for the isolation and enumeration of microbial organisms.
This method is based on the principle that when material containing micro-organisms is cultured each viable micro-organism will develop into a colony, hence the number of colonies appearing on the plates representing the number of living microbial organisms in the sample.
Procedure
In serial dilution agar plate method, 1ml of water sample to be assayed is added to 99ml of sterile water blank and made to a total volume of 100ml. This dilution is named as 10-1. From this 10-1 bacterial suspension, 1ml is taken and is added to 99ml of sterilized distilled water and is made as 10-2. In this same way a serial dilution of 10-1, 10-2, 10-3, 10-4, 10-5, 10-6, 10-7 were made. Finally 1ml of aliquot of various dilutions (from 10- 4 to 10-7) are added to sterile Petri dishes (triplicate for each dilution) to which are added 15ml of sterile cooled, molten (450C) nutrient agar. Upon solidification the plates are incubated in an inverted position for 48hrs to 72hrs at 250. The number of colonies appearing on the diluted plates are counted, averaged and multiplied by the dilution factor to find out the total number of bacterial cells of the sample. The following formula is used to count the total bacterial population (Figures 1 & 2).
Total number of bacterial cells counted = Number (average of 3 replicates of colonies x dilution factor)
Presumptive Coliforms Test
The presumptive coliforms test is used to detect and estimate the coliform population of water sample. This test is known as presumptive because of the development of a positive result in a Mac Conkey broth inoculated with water. In this test known volume of water sample (3 test tubes of 10ml and 3 test tubes of 0.1ml) are added to lactose is a positive test for coliform bacteria. The lactose broth used in this test is selective for the isolation of coliforms because of the addition of bile and Lauryl Number of tubes giving positive reaction out of 3 of 10ml each 3 of 1ml each 3 of 0.1ml each MPN index per 100ml 0 0 1 3 0 1 0 3 1 0 0 4 1 0 1 7 1 1 0 7 1 1 1 11 1 2 0 11 2 0 0 9 2 0 1 14 2 1 0 15 2 1 1 20 2 2 0 21 2 2 1 28 3 0 0 23 3 0 1 39 3 0 2 64 3 1 0 43 3 1 1 75 3 1 2 120 3 2 0 93 3 2 1 150 3 2 2 210 3 3 0 240 3 3 1 460 3 3 2 1100 3 3 3 2400 sulphate. A few drops of phenolphthalein indicator were added to lactose broth for detection of acid.
The following statistical method is used to estimate the population of coliforms. The result obtained is expressed as the most probable number (MPN) of coliforms [4]. A count number of lactose fermentation tubes showing production of gas following incubation period is taken and MPN is found by matching the result with those provided in the following statistical (Table 1).
| Month of Year | Total Microbial Population / ml | Total coliform count / 100ml | Total E Coli count / 100ml | |
|---|---|---|---|---|
| 1. | July 2005 | 196x10-6 | 22 | 03 |
| 2. | Sept 2005 | 180x10-6 | 24 | 04 |
| 3. | December 2005 | 185x10-6 | 28 | 06 |
| 4. | March 2006 | 210x10-6 | 32 | 08 |
Table 1: Most probable number (MPN) of coliforms bacteria present in 100ml water for various combinations of positive and negativ
| Month of Year | Total Microbial Population / ml | Total coliform count / 100ml | Total E Coli count / 100ml | |
|---|---|---|---|---|
| 1. | July 2005 | 125x10-6 | 06 | 01 |
| 2. | Sept 2005 | 116x10-6 | 05 | 03 |
| 3. | December 2005 | 132x10-6 | 07 | 03 |
| 4. | March 2006 | 146x10-6 | 10 | 05 |
Table 2: Load of Microbial pollution assayed in Sivagangai Chettiyourani (Bathing water pond) during the year (2005-
| Month of Year | Total Microbial Population / ml | Total coliform count / 100ml | Total E Coli count / 100ml | |
| 1. | July 2005 | 60x10-6 | 01 | - |
| 2. | Sept 2005 | 59x10-6 | 01 | - |
| 3. | December 2005 | 65x10-6 | 03 | - |
| 4. | March 2006 | 76x10-6 | 04 | - |
Table 3: Load of Microbial pollution assayed in Malanpatti Chettiyourani (Drinking water pond) during the year (2005-
| Month of Year | Total Microbial Population / ml | Total coliform count / 100ml | Total E Coli count / 100ml | |
|---|---|---|---|---|
| 1. | July 2005 | 10x10-6 | Nil | Nil |
| 2. | Sept 2005 | 11x10-6 | Nil | Nil |
| 3. | December 2005 | 10x10-6 | Nil | Nil |
| 4. | March 2006 | 13x10-6 | Nil | Nil |
Table 4: Load of Microbial pollution assayed in Municipal drinking water (Tap water) during the year (2005-2006).
The faecal coliforms like E-coli population was assayed and calculated as a maximum of 8/100 / ml of water in the month of March and maximum of 3/10 / ml of water during raining season.
But the total population of microbes estimated in another bathing pond of Sivagangai (Sivagangai Chettiyurani) was comparatively lesser than the Theppakkulam water. The highest total microbial population observed in the month of March was 146x10-6 / ml of water during the monsoon season (September and December).
But in the month of July the population was 125x10-6 / ml of water and in the month of December it showed the level of 132x10-6 / ml of water. The total coliforms were estimated at 6/100ml, 4/100ml, 7/100ml & 10/100ml respectively. The highest level of coli form population was observed in the month of March. The results showed that the population of E-coli was higher as 5/100ml in the month of March and 1/100ml in the month of August. But in the month of September and December the assay revealed the same result as 3/100ml of water.
Load of Microbial Pollution in the Drinking Water Source
(Malampatti chettiyourani & Sivagangai, municipal drinking water). The assay of total population of Malampatti chettiyourani showed that the total number of microbes were very high in the month of March and December. It was estimated as 76x10-6 / ml of water. But during the month of September the level of total population was 59x10-6/ml of water. There was not any significant change in the level of total population in the month of July. It was only 60x10-6/ml of water.
The total coliforms were assayed in all the four months and the results showed as 1/100ml, 1/100ml, 3/100ml & 3/100ml respectively. But the results showed that no representation of faecal coliforms like E-coli in the Malampatti Chettiyourani.
The assay of total population of bacteria in municipal drinking water showed as 10x10-6, 11x10-6, 10x10-6, 13x10-6/ml of water sample in the above four months. The faceal coliform assays revealed that no representation of either non-facial or facial coliforms.
Discussion & Conclusion
The microbial assay of the Theppakkulam of Sivaganga, revealed that this pond was affected by heavy load of microbial pollution. The analysis further showed that it was also highly contaminated with coliform bacteria. The presence of E-coli population confirmed that the pond was also affected heavily by faecal contamination.
The results of the microbial analysis of the Sivagangai Chettiyourani also showed the higher load of microbial population. But the level of contamination was lesser than the Theppakkulam water. The results also revealed that this bathing water pond was affected by faecal contamination. But the E-coli population of this pond was lesser than the Theppakkulam water.
The results of the Malampatti Chettiyourani (Drinking water pond) showed that the pond was having the general microbial population and also with non-faecal coliforms. But the results of the assay revealed that this pond was free from faecal pollution. The portability of water of this pond is not affected by the microbial contamination.
The microbial assay of municipal drinking water showed the presence of naturally occurring microbes and not the presence of either faecal or non-faecal coliforms.
References
-
James AL (1985) The environmental and public health and human ecology.
-
Nygard G (1949) Hydrological studies of some Danish ponds and lakes II. The quotient hypothesis and some new or little known phytoplankton organisms.
-
Chakraborthy (1969) A text book of microbiology.
-
(1971) Standard methods for the examination of water and waste water, 13th (Edn) American Public Health, Newyork.
- California Red-Legged Frog and Non-Listed Amphibians Response to Non-Native Fish Removal
- Industrial Standardization of the Bio-OS: Algorithmic Codification of Resilience Engineering Guidelines and Version V8 Architecture
- Climate Variability and the Sustainability of Snail Farming in Nigeria: Past Trends, Present Challenges and Potential Outlook
- The Evaluation of the Surveillance System of Anthrax in Gilgit-Baltistan, Pakistan, 2018
- Natural Decline to Extinction of A New Zealand Rabbit Population
- Mitochondrial Bio-Logistics: Steering Co-Enzyme Q10 and Lycopene Synergies within the Science 4.0 Bio-OS Framework