Functional Analysis of Growth in Large White Male Turkeys
The Richards and Gompertz functions were used to analyze the growth curves of large white male turkeys. Gompertz function was yt=A*exp (-exp (b-kt)) where; yt is the body weight (g) at age t (weeks), A is asymptotic value and the both parameters b and k adjust slope and point of inflection. On the other hand, Richards function was yt=A*((1+b*exp (-kt)) ^ (-1/n)) where; n is shape parameter determining the position of the inflection point of the curve. The coordinates of the point of inflection are t+=b/k and y+=A/e (e= Eulerian number), t+= (-1/k)*ln│n/b│and y+=A/ for the Gompertz and Richards function, respectively. Body weights were recorded every week from 0 to 18 weeks of age. Data were individually taken from 24 males. Feed and water were supplied ad libitum. Floor space allowance was 0.50 cm2/bird during the study. The coefficient of determination (R2), weight (y+), age (t+) at the inflection point, the ratio of inflection/asymptotic weight (y+/A), degree of maturity (ut=yt/A) in 16th and 18th weeks were the same for both models and were 0.998, 5560 gram, 11.9 day, 0.368, 0.549 and 0.627, respectively.
Introduction
One of the examined important characteristics of living organisms is growth. Growth is defined as an increase in cell number and cell size of the organism in a certain period in all living things. Animals are generally measured by live weight associated increase in size. Genetic constitution and environmental factors affect growth [1, 2].
Growth is an important economic feature in broiler industry [3]. Prediction of growth curve parameters can be of importance the economy of production. Biological implications of the model parameters and their relationship with other production features provide a sound basis for developing a breeding strategy to modify the curve of growth [4, 5]. In order to describe the biological system of the growth, numerous nonlinear functions developed and used by some scientists [6, 7, 8, 9]. The growth, influenced by genetic and environmental factors, is clarified by some non-linear models such as Brody, Von Bertalanffy, Gompertz, Logistic, and Richard's [10].
Growth patterns which are used to identify growth have great importance because they allow estimation in earlier periods in selection studies of animal production, feeding, and training programs. In recent years, identification of growth of fish, poultry and mammals, are made by non-linear functions. The description of growth in Japanese quails by Ricklefs [11] and description of growth in quail, chicken and female turkeys from hatching to maturity by Anthony, et al. [12] are made by Gompertz model which is a non-linear growth model. Knizetova et al. [13, 14, 15] use Richards model on the growth analysis of ducks, chickens and geese. Similarly, Sengül and Kiraz [16] use Gompertz, Richards, Logistics and Morgan- Mercer-Flodin (MMF) models on growth analyzes of White Large turkeys. It is reported that growth curve parameters are hereditary and selection trials has been used successfully [17]. In this research, functional analysis of Large White turkeys was made by using Gompertz and Richards growth models.
Materials and Methods
The material of the study consisted of 24 male Large White turkeys. During the study (18 weeks), turkeys were housed in poultry research unit at Harran University. Feed and water were provided freely. For each turkey 0.50cm2 is allocated during the trial period. Live weights of turkeys were weighed weekly and individually. Richards and Gompertz functions were used to analyze growth curves of male Large White turkeys [18, 13]. Gompertz function:
yt=A*exp(-exp(b-kt)) yt: live weight (g) at age of t (week) A: asymptotic value b and k: the parameters that regulate point of slope and inflection Richards function:
yt=A* ((1+b*exp (-kt))^(-1/n)) yt: live weight (g) at age of t (week) A: asymptotic value b and k: the parameters that regulate point of slope and inflection n: the parameter that determines the position of point of inflection of curve Coordinates of point of inflection (POI= point of inflection); For Gompertz function, age (t+) and weight (y+) at point of inflection;
t+=b/k y+=A/e (e= number Eulerian)
For Richards function, age (t+) and weight (y+) at point of inflection;
t+=(-1/k)*ln│n/b│ y+=A/ Parameter estimates of growth curve were made in SPSS package programme, according to the NLIN procedure and Levenberg-Marquardt algorithm was used. According to assumed parameter values of Gompertz and Richards models (A, B, K & N) live weight estimates are made by week and by these parameters belonging to both of the models, using the formulas mentioned above inflection point weight (y +) and age (t +), inflection/ asymptotic weight ratio (y+/A), the degree of ripeness at 16 and 18 weeks (ut=yt/A) were calculated. Growth curves were drawn by MS Office Excel 2003 programme using observed values for body weight and estimated values for Gompertz and Richards model.
Results and Discussion
The observed values for live weight by week and the growth curves estimated by Gompertz and Richard model were given in at Figure 1. When Figure 1 is examined it occurs that both of the matching models suits to the observed values nicely (R2>0.99).
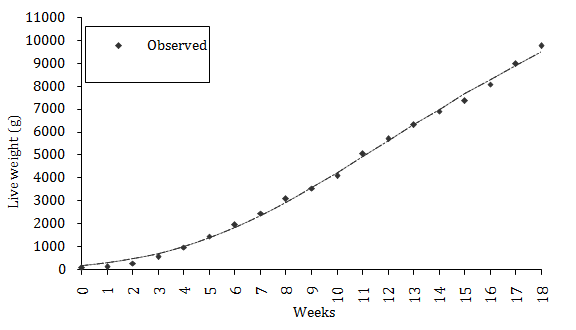
Figure1: Observed and estimated growth curves.
Values of the parameters of Gompertz and Richards models were the given in Table 1. A, b and k parameters in Gompertz model are calculated as 15114.503, 1.504159 and 0.125898; A, b, k and n parameters of Richards model are calculated as 15113.975, 0.000221, 0.125906 and 0.000049, respectively. Sengül & Kiraz [16] calculated respectively as 14620.90 and 10819.75 A parameter value (asymptotic weight) in Gompertz model and Richards model in Large White turkeys.
| Parameters | Gompertz model | Richard model |
|---|---|---|
| A | 15114.503 | 15113.975 |
| b | 1.504159 | 0.000221 |
| k | 0.125898 | 0.125906 |
| n | - | 0.000049 |
| t^{+ (week) | 11.9 | 11.9 |
| y+ (g) | 5560 | 5560 |
| y+/A | 0.368 | 0.368 |
| u16}$ | 0.549 | 0.549 |
| u18}$ | 0.627 | 0.627 |
Table 1: Parameters of Gompertz and Richard Model.
Conclusion
In both models, weight of bending point (POI = point of inflection) is determined as (y +=5560 g) and age (t+=11.9 day), and bending/asymptotic weight ratio is determined as (y+/A=0.368), during 16th and 18th weeks maturity degree (ut = yt/A, degree of maturity), is determined respectively similar as: 0549 and 0627. Knizetova, et al. [13, 14, 15], in their study using the Richards model, bending/asymptotic weight ratio (y+/A) estimated between 0.370 to 0.388 for broilers, 0.380 to 0.424 for ducks and 0.233 to 0.294 for geese.
| Age (week) | Live weight(g) | Gompertz | Richards | ||
| Live weight(g) | Estim. | Resd. | Estim. | Resd. | |
| 0 | 60 | 168 | -108 | 168 | -108 |
| 1 | 119 | 286 | -167 | 286 | -167 |
| 2 | 255 | 457 | -202 | 457 | -202 |
| 3 | 547 | 691 | -144 | 691 | -144 |
| 4 | 961 | 996 | -35 | 996 | -35 |
| 5 | 1439 | 1374 | 65 | 1374 | 65 |
| 6 | 1951 | 1824 | 127 | 1824 | 127 |
| 7 | 2445 | 2343 | 102 | 2343 | 102 |
| 8 | 3078 | 2921 | 157 | 2921 | 157 |
| 9 | 3536 | 3548 | -12 | 3548 | -12 |
| 10 | 4076 | 4211 | -135 | 4211 | -135 |
| 11 | 5049 | 4899 | 150 | 4899 | 150 |
| 12 | 5691 | 5597 | 94 | 5597 | 94 |
| 13 | 6306 | 6295 | 11 | 6295 | 11 |
| 14 | 6897 | 6982 | -85 | 6982 | -85 |
| 15 | 7364 | 7650 | -286 | 7650 | -286 |
| 16 | 8074 | 8292 | -218 | 8292 | -218 |
| 17 | 8969 | 8902 | 67 | 8902 | 67 |
| 18 | 9747 | 9478 | 269 | 9478 | 269 |
| R² | 0.998 | 0.998 | |||
| Syx | 162.306 | 167.636 |
Table 2: Observed and estimated growth curves in turkeys.
References
-
Barbato GF (1991) Genetic architecture of growth curve parameters in chickens. Theor Appl Genet 83(1): 24-32.
-
Mignon-Grasteau, Beaumont C, Le Bihan-Duval E, Poivey JP, De Rochambeau H, et al. (1999) Genetic parameters of growth curve parameters in male and female chickens. Br Poult Sci 40(1): 44-51.
-
Schulze V, Rohe R, Looft H, Kalm E (2001) Genetic analysis of the course of individual growth and feed intake of group-penned performance tested boars. Arch Tierz Dummerstorf 44: 139-156.
-
Abegaz S, Van Wyk JB, Olivier JJ (2010) Estimation of genetic and phenotypic parameters of growth curve and their relationship with early growth and productivity in Horro sheep. Archic Tierzucht 53(1): 85-94.
-
Saghi DA, Aslaminejad A, Tahmoorespur M, Farhangfar H, Nassiri M, et al. (2012) Estimation of genetic parameters for growth traits in Baluchi sheep using Gompertz growth curve function. Indian J Anim Sci 82(8): 889-892.
-
Kucuk M, Eyduran E, Bolacali M, Ozdemir T (2009) Determination of the ideal Growth Curve of Angora X Coloured Mohair Goat Cross and Coloured Mohair Goat Kids. Indian Vet J 86: 46-49.
-
Waheed A, Khan MS, Ali S, Sarwar M (2011) Estimation of growth curve parameters in Beetal goats. Arch Tierz 54(3): 287-296.
-
Nouman S, Abrar Y (2013) Non-linear growth models for Beetal goats. International Journal of Livestock Production 4(5): 78-81.
-
Cak B, Yilmaz O, Keskin S, Bayril T, Tariq MM (2017) Determination of Appropriate Growth Models for Early Selection Possibilities in Goats. Pakistan J Zool 49(2): 505-509.
-
Kum D, Karakus K, Ozdemir T (2010) The best nonlinear function for body weight at early phase of Norduz female lambs. Trakia J Sci 8(2): 62-67.
-
Ricklefs RE (1985) Modification of growth and development of muscles of poultry. Poult Sci 64(8): 1563-1576.
-
Anthony NB, Emmerson DA, Nestor KE, Bacon WL, Siegel PB, et al. (1991) Comparison of growth curves of weight selected populations of turkeys, quails and chickens. Poult Sci 70(1): 13-19.
-
Knizetova H, Hyanek J, Knize B, Roubicek J (1991a) Analysis of growth curves of fowl. I. Chickens. Br Poult Sci 32(5): 1027-1038.
-
Knízetová H, Hyánek J, Kníze B, Procházková H (1991b) Analysis of growth curves of fowl. II. Ducks. Br Poult Sci 32(5): 1039-1053.
-
Knizetova H, Hyanek J, Veselsky A (1994) Analysis of growth curves of fowl. III. Geese. Brit Poultry Sci 35(3): 335-344.
-
Şengül T, Kiraz S (2005) Non-linear models for growth curves in Large White turkeys. Turk J Vet Anim Sci 29: 331-337.
-
Mignon-Grasteau S, Piles M, Varona L, de Rochambeau H, Poivey JP, et al. (2000) Genetic analysis of growth curve parameters for male and female chickens resulting from selection on shape of growth curve. J Anim Sci 78(10): 2515-2524.
-
Rogers SR, Pesti GM, Marks HL (1987) Comparison of three nonlinear regression models for describing broiler growth curves. Growth 51(2): 229-239.
-
Sezer M, Tarhan S (2005) Model parameters of growth curves of three meat-type lines of Japanese quail. Czech J Anim Sci 50(1): 22-30.
- California Red-Legged Frog and Non-Listed Amphibians Response to Non-Native Fish Removal
- Industrial Standardization of the Bio-OS: Algorithmic Codification of Resilience Engineering Guidelines and Version V8 Architecture
- Climate Variability and the Sustainability of Snail Farming in Nigeria: Past Trends, Present Challenges and Potential Outlook
- The Evaluation of the Surveillance System of Anthrax in Gilgit-Baltistan, Pakistan, 2018
- Natural Decline to Extinction of A New Zealand Rabbit Population
- Mitochondrial Bio-Logistics: Steering Co-Enzyme Q10 and Lycopene Synergies within the Science 4.0 Bio-OS Framework