The Relationship between the Length and Weight of the Sea Star Pentaceraster Regulus (Muller & Troschel, 1842)
The length weight relationship of the starfish Pentaceraster regulus is done in this study. For that some stat fishes were collected and their length was recorded. A total of 764 specimen of starfish (Pentaceraster regulus) ranged from 31 to 184 mm in length were used for the study. This study showed the relationship between length and weight as isometric in P. regulus.
Introduction
The length weight relationship is one of the standard methods employed to yield authentic biological information. It is required in population dynamics and in fishery stock assessment [1, 2]. The relationship between length and weight of the fish in frequently used to compare the effect of biotic and abiotic factors on the health or well being of a population [3]. It is a direct way of converting logarithmic growth rates into weight and indicates the events in the life history such as metamorphosis and the onset of maturity [4]. Marine species do not adhere strictly to the classic species- related niche differentiation often observed in terrestrial systems [5], and it is argued that in understanding variability in marine communities, it can be more useful to consider interactions among individuals of similar body size [6, 7, 8, 9, 10, 11, 12]. In addition, properties such as community production can be predicted from analyses of body size distributions, but such analyses usually require data on individual body weights [13, 14, 15].
King, RP [16] reported that the information on length weight relationship is more important for the management of fishery resources. The differences in length-weight relationship have also been reported to be associated with sex of the fish [17], Season [18], genetic strain, location [19], and species interactions.
According to Allen [20], during the growth period if the fish does not change its form or density the weight will be proportional to the cube of any linear dimension. If any morphological change occurs in the body shape of the fish, the co-efficient regression of logarithmic weight on logarithmic length deviates from ‘3’. If the fish maintains the same shape throughout the life without any change then ‘b’ is equal to ‘3’.
In recent years applications of analyses that occupy size classed faunal data to investigate properties and trends in marine communities have increased [21, 22]. These analyses are based on the assumption that body size plays a key role in the structuring marine communities [8].
Materials and Methods
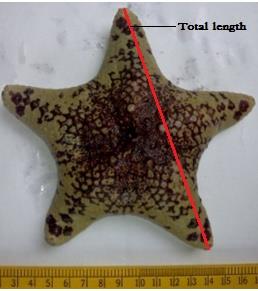
The specimens were collected randomly, monthly basis from Thondi coast. A total of 1248 were collected and a random of 764 animals was examined for the study. Immediately after the collection the standard length and weight of the starfish were recorded. A total of 764 specimen of starfish (Pentaceraster regulus) ranged from 31 to 184 mm in length were used for the study. The total length of the animal was measured from the tip of the 1st arm to the tip of the 3rd arm using a fine thread along the body of the starfish. Then the thread was straightened and measured using a scale. The body weight of each individual animal was recorded to the nearest mg using an electronic balance Figure 1.
The average log values of the observed length-weight with a clear interval of 10 mm were plotted. The equation used for the evaluation of the length-weight relationship was, W =aLb Where, W= weight, L= total length, a= constant, b= exponent The data were analysed through the logarithmic form of the above equation Log W=log a+ b log L (i.e) y= a+bx Where a = intercept; y = log W; x = log L and b = slope of the line or regression co-efficient. Analysis of co-variance was employed to determine whether b value differed among the categories at 5% level.
Length- weight relationship in P. regulus
Results
The length- weight relationship during the present study was analyzed using ordinary least square regression with 95% confidence. A total of 764 animals with maximum length 184mm and minimum length 31mm were used for this study. The linear relationship between length and weight is shown in Figure 2, The monthly- obtained data for one year was pooled and obtained the following regression equation Table 2.
Shanker S, et al. The Relationship between the Length and Weight of the Sea Star Pentaceraster Regulus (Muller & Troschel, 1842). Int J Zoo Animal Biol 2018, 1(4): 000122.
| Category | N | Σx | Σy | Σx2 | Σy2 | Σxy | |||||||||||||
|---|---|---|---|---|---|---|---|---|---|---|---|---|---|---|---|---|---|---|---|
| P. regulus | 764 | 1557.918 | 3617.676 | 3192.391 | 17157.31 | 7393.965 |
Table 1: Sum of squares and products of the length-weight data of P. regulus.
| Group | Df | Sum of square products | B value | Errors of estimate | ||||||||||||
|---|---|---|---|---|---|---|---|---|---|---|---|---|---|---|---|---|
| X2 | XY | Y2 | Df | S. S | ||||||||||||
| P. regulus | 764 | 15.551 | 16.946 | 26.98 | 3.030 | 763 | 8.514 |
Table 2: Corrected sum of squares and products of length-weight data of P. regulus regression co-efficient and deviation Table 2:
Table 2: Corrected sum of squares and products of length-weight data of P. regulus regression co-efficient and deviation Table 2: Corrected sum of squares and products of length-weight data of P. regulus regression co-efficient and deviation from the regression. Df = degree of freedom x2, xy and y2 = corrected sum of squares and products b = regression co-efficient ss = sum of squares
Discussion
The relationship between the body length and weight play an important role in fishery biology for estimating the biomass from obtaining analytical models and to relate the biological parameter i.e., indicating the rate of weight gained relative to the growth [23, 24]. Changes in length-weight relationship are associated with in size and sexual maturity.
Parameter ‘b’ is the exponent of the arithmetic form of length-weight relationship and slope of regression line in the logarithmic form. It is also called allometric coefficient and it has important biology meaning indicting the rate of weight gain relative to growth in length. The value usually falls between 2.5 and 3.5 and often lies close to 3 [2]. When the starfish grow at the same rate in all the linear directions, then the increase in length, width and height are proportional it is called isometric. In such cases, ‘b’ is equal to 3 value of ‘b’ different from 3 indicates allometric growth; and if ‘b’ is greater the 3, the starfish exhibits its normal shape as it increases in length and becomes slimmer, if ‘b’ in less than 3. The ‘b’ value obtained for P. regulus was 3.03. The ‘a’ value was o.844 and the correlation-coefficient (r) was around 0.9. Since the ‘b’ value in (b > 3) the animal grows in isometric way as described by Tesch FW [25].
The result state that the length-weight relationship are not constant over the whole year, varying according to factors such a food availability, feeding rate, gonad development and spawning period. However, the parameter ‘b’ is characteristic of the species and generally does not vary significantly throughout the year, unlike the parameters ‘a’, which may vary daily, seasonally and /or between different habitats.
In conclusion, this study showed the relationship between length and weight as isometric in P. regulus. Use of length and weight relationship applied here should dramatically reduced the time and cost involved in collecting adequate data for size-based analysis of starfish. This study is also first of its kind and no information on this line is available so far in starfish.
References
-
Gulland JA (1993) Manual of Methods for Fish Stock Assessment - Part 1, Fish Population Analysis. FAO Manuals in Fisheries Science No. 4.
-
Bagenal TB, Tesch FW (1978) Age and growth. I Bebenal (Eds), Methods for Assessment of Fish reduction in fresh water, 3rd (Edn). IBP hand book, Oxford, 3: 101-136.
-
Cone RS (1989) The need to reconsider the use of condition indices in fisheries science. Trans Am Fish Sot 118(5): 510-514.
-
Kalita N, Jayabalan N (1997) Age and growth of the Karangid Alepes para (class: Osteichthyes) from Mangalore coast. Indian J Mar Sci 26: 107-108.
-
Persson L (1988) Asymmetries in competitive and predatory interactions in fish populations. Size- structured populations pp: 203-218. Shanker S, et al. The Relationship between the Length and Weight of the Sea Star Pentaceraster Regulus (Muller & Troschel, 1842). Int J Zoo Animal Biol 2018, 1(4): 000122.
-
Cohen JE, Pimm SL, Yodzis P, Saldana J (1993) Body Sizes of Animal Predators and Animal Prey in Food Webs. Journal of Animal Ecology 62(1): 67-78.
-
Jennings S, Pinnegar JK, Polunin NVC, Warr KJ (2002) Linking size-based and trophic analyses of benthic community structure. Marine Ecology Progress Series 226: 77-85.
-
Jennings S, De Oliveira JAA, Warr KJ (2007)
-
King RP (1996) Length-weight relationships of Nigerian freshwater fishes. ICLARM Quarterly 19(3): 49-52.
-
Hile R (1941) Age and growth of the rock bass, _Amloloplites_ _rupestris_ (Rafinesque) in Nebish lake,Wisconsin. Trans Wis Acad Sci lett 33: 189-337.
-
Cada GF, Loar JM, Sale MJ (1987) Evidence of Food Limitation of Rainbow and Brown Trout in Southern Appalachian Soft-Water Streams. Trans Am Fish Soc 116(5): 692-702. Measurement of body size and abundance in tests of macro-ecological and food web theory. J Anim Ecol 76(1): 72-82.
-
Jennings S, Mackinson S (2003) Abundance-body mass relationships in size-structured food webs. Ecology Letters 6(11): 971-974.
-
Brown JH, Gillooly JF, Allen AP, Savage VM, West GB (2004) Toward a metabolic theory of ecology. Ecology 85(7): 1771-1789.
-
Jennings S, Blanchard JL (2004) Fish abundance with no fishing: predictions based on macro-ecological theory. Journal of Animal Ecology 73(4): 632-642.
-
Pope JG, Rice JC, Daan N, Jennings S, Gislason H (2006) Modeling an exploited marine fish community with 15 parameters- results from a simple size-based model. ICES Journal of Marine Science 63(6): 1029- 1044.
-
Brey T (1990) Estimating productivity of macro benthic invertebrates from biomass and mean individual weight. Meeresforschung 32: 329-343.
-
Edgar GJ (1990) The use of the size structure of benthic macro-faunal communities to estimate faunal biomass and secondary production. Journal of Experimental Marine Biology and Ecology 137(3): 195-214.
-
Brey T, Jarre-Teichmann A, Borlich O (1996) Artificial neural network versus multiple linear regression: predicting P/B ratios from empirical data. Marine Ecology Progress Series 140: 251-256. Leucichthusarbedi (Lesuer), in lakes of the enorth eastern high lands, Wisconsin, Bulletin of the Bureau of Fisheries 49(19): 211-317.
-
Allen KR (1938) Some observations on the biology of the trout (Salmotrutta) in Windermere. J Anim Ecol 7(2): 333-349.
-
Blanchard JL, Dulvy NK, Jennings S, Ellis JR, Pinnegar JK, et al. (2005) Do climate and fishing influence size- based indicators of Celtic Sea fish community structure? ICES Journal of Marine Science 62: 405- 411.
-
Greenstreet SPR, Rogers SI (2006) Indicators of the health of the fish community of the North Sea: identifying reference levels for an ecosystem approach to management. ICES Journal of Marine Science 63(4): 573-593.
-
Gulland JA (1983) Fish stock assessment A manual of basic methods. FAO/Wiley Ser on Food and Agriculture pp: 233
-
Frota LO, Costa PAS, Braga AC (2004) Length-weight relationships of marine fishes from the central Brazilian coast. NAGA, World Fish Center Quarterly 27(1): 20-26.
-
Tesch FW (1968) Age and Growth. Methods for Assessment of Fish Production in Fresh Waters. edited by Ricker, WE Oxford: Blackwell Scientific publications. Shanker S, et al. The Relationship between the Length and Weight of the Sea Star Pentaceraster Regulus (Muller & Troschel, 1842). Int J Zoo Animal Biol 2018, 1(4): 000122.
- California Red-Legged Frog and Non-Listed Amphibians Response to Non-Native Fish Removal
- Industrial Standardization of the Bio-OS: Algorithmic Codification of Resilience Engineering Guidelines and Version V8 Architecture
- Climate Variability and the Sustainability of Snail Farming in Nigeria: Past Trends, Present Challenges and Potential Outlook
- The Evaluation of the Surveillance System of Anthrax in Gilgit-Baltistan, Pakistan, 2018
- Natural Decline to Extinction of A New Zealand Rabbit Population
- Mitochondrial Bio-Logistics: Steering Co-Enzyme Q10 and Lycopene Synergies within the Science 4.0 Bio-OS Framework