Analysis of Peasant Farmers in Rabbit Production in Sokoto State, Nigeria
The study evaluated the analysis of peasant farmers in rabbit production in Sokoto south local government area in Sokoto state, Nigeria. The procedure involved multi stage sampling techniques of the sample size and the use of questionnaire was employed. The entire respondents were rabbit farmers. This study examined current trend on small and ultra-smallholder rabbits units in Sokoto south of Sokoto state Nigeria. The methodology combined questionnaire survey with onfarm monitoring and recording of data in relations to socio-economic characteristics of rabbits keepers, management, constraints and marketing outlets .the result obtained was presented in frequency and percentage table. The study shows that 70% were male while 30% were female. The study also review that 44%, 36%, 12% and 8%represent the ages of rabbits farmers of 25-35years, 36-45years, 46-45years and 56years and above respectively within the study area, it was also review that 64%, 20%, and 16% represent the marital status which includes that of single married and widow. the distributions of years of farmers experience in rabbits production is also represented by 20%, 40%, 10%, and 30% of 1- 6years, 7-12years and 19 years and above of experience respectively. It also reveals that the source of breeding stocks by the farmers, i.e. from own stock, other farmers, market and research institutions which was represented by 40%, 20%, 36% and 4% respectively. And with respect to housing many farmer place their cage outside the house (70%) and also the major disease experience by the farmer is manage (52%) which serves as one of constrains facing the rabbit farmer meanwhile mating of does follows seasonal pattern due to seasonal heat stress. About (52%) farmer noted that does perceptivity and conception rates were markedly low during the dry season. From this study it highly recommended that the farmer should put down the use of personal experience in putting the animal and the extension agent should reach out to the rabbit farmers for proper and adequate information and the farmer should make used of stocks from the research institute for stocks replacement/breeding.
Introduction
The management of rabbits by peasant farmer involves the process that is takes by a peasant farmer to take care, feed, housing system, health management and reproduction either for sales (income generation) or for consumption. Basically management is the process of organizing, controlling, managing and the decision making process in production in other to achieve sets of goals while in as much as rabbits production is concerned with goals of consumption, recreation and for income generation by a farmer or other uses e.g. as pet.
Rabbits are small, long ears, short tails mammals, in the family laphoridae with the order lagomorphs, found in the several part of the world. Rabbit farming is an agric business with a high management especially due statistics showing that over one million tons of rabbit meat is consumed yearly around the world. They are also characterized with gestation period of 31 to 33 days. This livestock is a great source of income and food for part of Africa including Nigeria. There are no little or no religious limitation consumption of rabbits like other livestock such as swine. They are cheaper to rise than other higher livestock, grasses, leaves and some types of waste can be a great rabbit meal. The meat is highly nutritious tasty and easily digestible even rabbit production is a veritable way of alleviating animal protein deficiency in Nigeria.
In Nigeria today there are major factors that favor rabbit production such as population production growths in Nigeria is increasing rapidly and this call for increase in production of livestock input to meet the protein demand of population. More so rabbits are characterized by short gestation period which help the peasant farmer and also high reproductive potential, rapid growth rate and the ability to utilize forage. Small farming system with the rabbits feed on crop residues, weed waste, fruits vegetables and poultry droppings. Furthermore the manual can be used as fertilizer to crop and gardens and lastly of all is the meat which is an important source of good quality protein as it devoid of fats. For over three decades now the contribution of small holder rabbit units to food security in developing countries has been clearly recognized [1].
The distribution of rabbits farmers by occupation which was prove to be 33% of all farmers are government employees (civil servants, teachers, etc.) while 39% and 28%represent private sector(artisans, business man, farmers, etc.) and others (student, retirees, etc.) respectively. This trend shows that those engaged in rabbit farming cut across all professions and walks of life in the society [2]. Also the distribution of rabbit farmers by person(s) in charge of the units by purpose for keeping rabbits is a significant proportion of the farmer (60%) indicated that the primary reasons for keeping rabbits for consumption with occasional sales of excess stocks. this implies that rabbit keeping serves the primary goal of providing supplemental protein for the house hold. others (18%) multiple reasons for establishing enterprise [2]. Furthermore the distribution of rabbit farms by type of material use for cage construction and the distribution of rabbit farms by type of cage design are also analyze to be mostly place outside the house (67%) while the remaining units place their cages inside their houses because of thieves or to maximize the effect of heat stress [2].
The farmer also engage in selection of different breeds due to their own taste of it are production performance, breed type, health status, growth rate and mothering ability etc. and of these breed include new Zealand white, Californian white, Dutch, angora, Kenya white, etc. which are of different performances in different area. Availability of veterinary services and cost of drugs for rabbit treatment is not high increase rabbit production and tend to low demand of veterinary service and direct consultation.
Additionally there are necessary equipment for rabbit production which includes feeders, drinkers, nest box, weighing balance, scrapers, wire bush, shovels and thermometer etc. Rabbits production in Nigeria plays a significant role in the development and provision of food and materials for marketing purposes; however there are some problems which may be affecting the production of rabbit in Nigeria; these problem could be poor management procedure, poor funding and lack of treatment measure for health problem promotion rabbit production area of agriculture and un ability to select good breed stock for rearing by the farmer, Secondly there have been series of studies on rabbit production but not even a single study has been carried out on the management of rabbit production by peasant farmer on Sokoto south local government of Sokoto state.
The researcher aim at achieving the following goals or objectives was to describe socio-economic characteristics of peasant farmers in rabbit production and to identify the management of good rabbit breed for production. Others include, to describe the marketing process for rabbit production and to identify the constriction of rabbit production.
The topics is researchable in such a way that it will help not only the student but also the teachers, the rabbit breeders and those that wanted to engage in rabbit production to develop skills of good rabbit management such as feeds, health management selection of rabbit for rearing and marketing process in Sokoto state. The significance of these study or research is to access and explain the management system adopted by peasant farmers in the rabbit’s production in Sokoto South of Sokoto State Local Government and also provide the new adequate knowledge for peasant farmers and informal distance learning education immolating from the previous research.
The study will cover the management practice such as feed, housing system and health management of the peasant farmer rabbit farms and the study is limited to some selected areas or farm in Sokoto South Local government and the financial problem in major problem we faced during this research work.
Materials and Methods
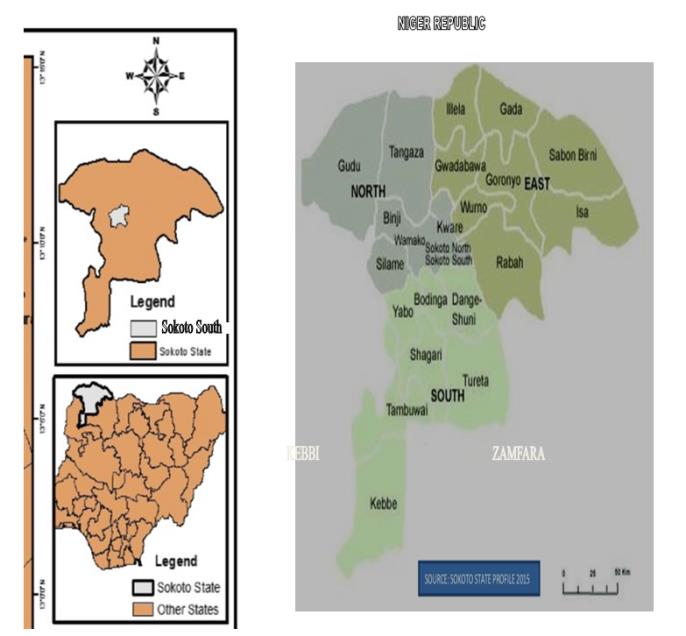
The major occupation of the people are farming, fishing and trading. The main ethnic groups are Hausa and Fulani other Nigerian tribes also reside and live harmoniously with the indigenes of Sokoto South Local Government Area (Figure 1).
In this chapter, the researcher present the method and design of the study carried out. The research will also look at the research design, population of the study, sample and sampling techniques, instrument used for the collection of data and thereafter the method of data analysis and procedure.
Study Area
The study was carried out in Sokoto State, which was created in 1996 its headquarters are in Sarkin Zamfara. It has an area of 41 km2 and a population of 194,914 at 2006 census and the postal code of the area are 840. It is located in longitude 13.0176oN and latitude 5.2371oE.
Sokoto state, Northwestern Nigeria bordering the Republic of Niger to the North, it also shares boundaries with Kebbi state to the West and South, Zamfara to the South and East and it’s consist of 18 district, some of the districts of the Local Government are;
Adar Kwanni, Dandi, Gaji, Karaye, Mabara Kanti Sani, Mabera Idi, Mabera Mujaya, Magajin Rafi, Mana, RijiyarDorowa, RujinSambo, Sabon Birnin, Salami, Sarkin Musulumi, Sarkin Zamfara, Tudun Wada, Ungwar Jariri, Mabera Gari.
Sampling Procedure and Sampling Size
Four (4) districts were purposely selected out of 18 districts in Sokoto south Local Government Area for the study based on the dominance of Rabbit production practice in the study area. The districts selected are Mabera Idi, Mabera Mujaya, Rujin Sambo, and Sarkin Musulumi.
Rabbit production that are reared by peasant farmers and the management were targeted randomly giving a total size of 50 Rabbit Farmer were selected. The sampling techniques used in the research is therefore simple random sampling as farmer were selected without considering who farmers were. This is to avoid any bias that may lead to hindrance in collecting the data.
Instrument
The instrument used for data collection in this research is questionnaire. However, the questionnaire is chosen as it is considered the most appropriate instrument as regards to this study. The questionnaire consists of structured questions and possible answers/responses that the Rabbit Farmer chooses the option that is appropriate to the Rabbit Farmer interest
Result Analysis and Discussion
ability. The researcher distributed the questionnaire personally to the farmers and collected it instantly after completion as it does not contain much complexity that requires more time before completion.
Procedure of Data Analysis
This research used descriptive statistics which involved the use of frequency distribution that was later converted to percentage to interpret the collected data. Also the responses from the Rabbit Farmer were carefully analyzed. In view of this, a simple percentage methodology is used in analyzing the collected data. The formula used is as follow;
No of responses per option No of questionnaires returned X100
| S/N | Gender | No. of Rabbit farmer | Percentage | ||||||||
|---|---|---|---|---|---|---|---|---|---|---|---|
| 1 | Male | 35 | 70% | ||||||||
| 2 | Female | 15 | 30% | ||||||||
| Total | 50 | 100% |
Table 1: Distribution of Rabbit Farmers gender.
The Table 1 above shows that 35 Rabbit Farmer represent 70 percent while 15 Rabbit Farmer represent 30 percent. The gender that is mostly found in the rabbit’s production is mostly male which is also supported by Attamah, et al. [3] in Enugu state. Who reported that the farmers were majority small scale farmers and are male who has the capacity of increasing their scale of production owning to their energetic nature (youthfulness)
| S/N | Age | No. of Rabbit Farmer | Percentage | ||||||||
|---|---|---|---|---|---|---|---|---|---|---|---|
| 1 | 25-35 | 22 | 44% | ||||||||
| 2 | 36 – 45 | 18 | 36% | ||||||||
| 3 | 46 – 55 | 6 | 12% | ||||||||
| 4 | 56 and above | 4 | 8% | ||||||||
| Total | 50 | 100% |
Table 2: Distribution of Rabbit Farmer age.
The Table 2 above show that 22 Rabbit Farmer represent 44 percent and 18 farmer represent 36 while 6 Rabbit Farmer represent 12 percent and lastly 4 farmer Rabbit Farmer represent 8 percent. The table shows that the major age involves in rabbits production are majorly youth with an average of 25-35 years which agrees with findings of chah, et al. in Enugu state.
| S/N | Marital status | No. of Rabbit Farmer | Percentage | ||||||||
|---|---|---|---|---|---|---|---|---|---|---|---|
| 1 | Single | 32 | 64% | ||||||||
| 2 | Married | 10 | 20% | ||||||||
| 3 | Widow | 8 | 16% | ||||||||
| Total | 50 | 100% |
Table 3: Distribution of Rabbit Farmer in marital status.
result above which supports Attamah, et al. [3] findings in 2018 in Enugu, which state that single and productive youth are mostly rabbits farmers.
| S/N | Size of the family | No. of Rabbit Farmer | Percentage (%) | |||||
|---|---|---|---|---|---|---|---|---|
| 1 | Large | 4 | 8 | |||||
| 2 | Medium | 32 | 64 | |||||
| 3 | Small | 14 | 28 | |||||
| Total | 50 | 100 |
Table 4: Distribution of Rabbit Farmer on size of the famer family.
represent 28%.The major Rabbit Farmer farmers are characterized with majorly medium family.
| S/N | Occupation | No. of Rabbit Farmer | Percentage (%) | |||||
|---|---|---|---|---|---|---|---|---|
| 1 | Civil Servant | 22 | 44 | |||||
| 2 | Private Sector | 18 | 36 | |||||
| 3 | Others | 5 | 10 | |||||
| 4 | 5 | 10 | ||||||
| Total | 50 | 100 |
Table 5: Distribution of occupation of farmers apart from rabbit farming.
The table 5 above shows that 22 Rabbit Farmer represent 44% and 18 Rabbit Farmer represent 36%, five Rabbit Farmer represent 10% for others and for none 5 Rabbit Farmer represent 10%. The highest proportion of Rabbit Farmer of rabbits keepers are mostly civil servant and private sector by occupation which is also similar with the osenis, et al. [2] while this trends shows that the distribution cut across all professions and walks of life in the society.
| S/N | Years of experience | No. of Rabbit Farmer | Percentage (%) | |||||
|---|---|---|---|---|---|---|---|---|
| 1 | 6-Jan | 10 | 20 | |||||
| 2 | 7 – 12 | 20 | 40 | |||||
| 3 | 13 – 18 | 5 | 10 | |||||
| 4 | 19 and above | 15 | 30 | |||||
| Total | 50 | 100 |
Table 6: Distribution of farmer experience in Rabbit production.
15 Rabbit Farmer represent 30 percent. The early stage of rabbit production cut across most while majorly rabbit’s farmers are with average experience of 7-12 years.
| S/N | Cage Placement | No. of Rabbit Farmer | Percentage (%) | ||||||
|---|---|---|---|---|---|---|---|---|---|
| 1 | Inside | 15 | 30 | ||||||
| 2 | Outside | 35 | 70 | ||||||
| Total | 50 | 100 |
Table 7: Distribution of cage placement for rabbit production.
production purposes and this finding is supported by the research made in south western Nigeria (osun and Oyo state respectively) by Ajayi, et al. and Walamidi, et al.
| S/N | Breeding stock | No. of Rabbit Farmer | Percentage (%) | |||||||
|---|---|---|---|---|---|---|---|---|---|---|
| 1 | Own stock | 10 | 20 | |||||||
| 2 | Other framer | 20 | 40 | |||||||
| 3 | Market | 18 | 36 | |||||||
| 4 | Research Institution | 2 | 4 | |||||||
| Total | 50 | 100% |
Table 8: Distribution of source of breeding stock.
From the above table 8 it shows that 20 Rabbit Farmer represent 40% and 10 represent 20% while 18% Rabbit Farmer represent 36% and lastly 2 Rabbit Farmer represent 4%. This could be linked to the fact that rabbit producer is new in the area as can be seen in the average year experience of the farmer and the average stocks size. Naturally farmers are known constant for consulting others farmers in the business before them for information and guidance. This is in line with innovation diffusion theory as supported by Nnodim, et al.
| S/N | Stock size | No. of Rabbit Farmer | Percentage (%) | |||||||
|---|---|---|---|---|---|---|---|---|---|---|
| 1 | 10-Jan | 20 | 40 | |||||||
| 2 | 20-Nov | 16 | 32 | |||||||
| 3 | 21 – 30 | 10 | 20 | |||||||
| 4 | 31 and above | 4 | 8 | |||||||
| Total | 50 | 100 |
Table 9: Distribution of Rabbit Farmer the stock size.
The table 9 above shows that 20 Rabbit Farmer represent 40% and 16 Rabbit Farmer represent 32% while 10 Rabbit Farmer 20% and 4Rabbit Farmer represent 8 percent. The result also views that most of the rabbit’s farmers stocks that is own by them are mostly within the range 1-10 most. Supported by Attamah, et al. [3].
| S/N | Breeds | No. of Rabbit Farmer | Percentage (%) | |||||||
|---|---|---|---|---|---|---|---|---|---|---|
| 1 | Dutch | 4 | 8 | |||||||
| 2 | Gross breed | 22 | 44 | |||||||
| 3 | French looped | - | - | |||||||
| 4 | Angora | 10 | 20 | |||||||
| 5 | Kenya white | - | - | |||||||
| 6 | New Zeeland an white | 10 | 20 | |||||||
| 7 | California White | 4 | 8 | |||||||
| Total | 50 | 100 |
Table 10: Distribution of breeding own by Rabbit Farmers.
The table 10 above shows 4 Rabbit Farmer represent 8% and 32 Rabbit Farmer represent 44% and also 10 Rabbit Farmer represent 20% while 10 Rabbit Farmer represent 20% and lastly 4 Rabbit Farmer represent 8% with the result above it can be view that most preferred breeds by Rabbit Farmer are three while the one of most preferred breed by farmers is New Zeeland white. This could be due to the prolific nature of New Zeeland white this agreed with the finding of Baruwa, et al. [4] in Osun State, who reported that the two most popular breed’s rears are New Zeeland and Californian white breeds.
| S/N | Seasons | No. of Rabbit Farmer | Percentage (%) | ||||||||
|---|---|---|---|---|---|---|---|---|---|---|---|
| 1 | Early dry | 10 | 20 | ||||||||
| 2 | Late dry | 26 | 52 | ||||||||
| 3 | Early rain | 4 | 8 | ||||||||
| 4 | Late rain | 10 | 20 | ||||||||
| Total | 50 | 100 |
Table 11: Distribution of rabbit’s farm by seasonal effect and on doe mating.
In the table 11 above it shows 10 Rabbit Farmer represent 20 percent and 20 Rabbit Farmer represent 52 percent while 4 Rabbit Farmer represent 8% and lastly 10 Rabbit Farmer represent 20% about 52% of rabbit keeper noted that mating of those was usually most difficult in the dry season period (Early and late dry season) which may indicate some level of intensification of breeding activities during the cooler months of the year which is also supported by Komolafe SO, et al. [2] finding in Ibadan Osun Area.
| S/N | Seasons | No. of Rabbit Farmer | Percentage (%) | ||||||||
|---|---|---|---|---|---|---|---|---|---|---|---|
| 1 | Early dry | 10 | 20 | ||||||||
| 2 | Late dry | 26 | 52 | ||||||||
| 3 | Early rain | 4 | 8 | ||||||||
| 4 | Late rain | 10 | 20 | ||||||||
| Total | 50 | 100 |
Table 12: Distribution of factors considered when selecting breeding stocks.
| S/N | Marketing process | No. of Rabbit Farmer | Percentage | |||||||
|---|---|---|---|---|---|---|---|---|---|---|
| 1 | Market | 26 | 52% | |||||||
| 2 | Homebuyer | 14 | 28% | |||||||
| 3 | Company industry | 10 | 20% | |||||||
| Total | 50 | 100% |
Table 13: Distribution on how did the Rabbit Farmer market their rabbits.
From the above table 13 it could be view that 26 Rabbit Farmer represent 52% while 14 Rabbit Farmer represent 28% and lastly 10 Rabbit Farmer represent
| S/N | Marketing rate | No. of Rabbit Farmer | Percentage (%) | |||||||
|---|---|---|---|---|---|---|---|---|---|---|
| 1 | High | 14 | 28 | |||||||
| 2 | Medium | 32 | 64 | |||||||
| 3 | Low | 4 | 8 | |||||||
| Total | 50 | 100 |
Table 14: Distribution of marketing rate of rabbit production.
marketing of rate of rabbits is still equilibrium in Nigeria because it is just a new growing sector in Nigeria to the people and the farmer.
| S/N | Patronization rate | No. of Rabbit Farmer | Percentage (%) | |||||||
|---|---|---|---|---|---|---|---|---|---|---|
| 1 | High | 15 | 30 | |||||||
| 2 | Normal | 30 | 60 | |||||||
| 3 | Low | 5 | 10 | |||||||
| Total | 50 | 100 | ||||||||
| S/N | Constraints | No. of Rabbit Farmer | Percentage (%) | |||||||
| 1 | Diseases | 30 | 60 | |||||||
| 2 | Capital | 7 | 14 | |||||||
| 3 | Thief | 10 | 20 | |||||||
| 4 | Others | 3 | 6 | |||||||
| Total | 50 | 100 |
Table 15: Distribution of rabbit patronization.
In the table 15 above it could be view that 15 Rabbit Farmer represent 30percent and 30 represent 60percent and lastly 5 Rabbit Farmer represent 10percent. Rabbit patronization in the market is still normal but as say by Tom, et al. [5] is not a get rich quick business but there is some profit for those that are willing to make necessary sacrifices (Table 16).
represent 6 percent [6]. The most constraint face by the rabbit farmer is disease and thief due to environmental structure of Sokoto South of Sokoto State [7, 8, 9, 10].
| S/N | Diseases experience | No. of Rabbit Farmer | Percentage (%) | |||||||
|---|---|---|---|---|---|---|---|---|---|---|
| 1 | Yes | 32 | 64 | |||||||
| 2 | No | 18 | 36 | |||||||
| Total | 50 | 100 |
Table 16: Distribution of incidence of rabbit disease experience by Rabbit Farmer.
represent 36 percent. Due to the above fact in table 16 the incident of diseases is increasing [11, 12, 13, 14].
| S/N | Diseases | No. of Rabbit Farmer | Percentage (%) | ||||||||
|---|---|---|---|---|---|---|---|---|---|---|---|
| 1 | Ear canker | 10 | 20 | ||||||||
| 2 | Sniffles | 4 | 8 | ||||||||
| 3 | Marge | 26 | 52 | ||||||||
| 4 | Diarrhea | 10 | 20 | ||||||||
| Total | 50 | 100 |
Table 17: Distribution of disease normally experience by the Rabbit Farmer.
| S/N | Occurrence of disease | No. of Rabbit Farmer | Percentage (%) | ||||||||
|---|---|---|---|---|---|---|---|---|---|---|---|
| 1 | Yes | 42 | 84 | ||||||||
| 2 | No | 8 | 16 | ||||||||
| Total | 50 | 100 |
Table 18: Distribution of occurrence of disease with season.
16%. The trends shoes that diseases always occur with season in this area.
| S | /N | Reaction to diseases problem | No. of Rabbit Farmer | Percentage (%) | ||||||
|---|---|---|---|---|---|---|---|---|---|---|
| 1 | Personal treatment | 30 | 60 | |||||||
| 2 | Calling veterinaries | 15 | 30 | |||||||
| 3 | Culling of infected animal | 5 | 10 | |||||||
| Total | 50 | 100 |
Table 19: Distribution of reaction of Rabbit Farmer to disease problem.
The above table 20 shows that 30 Rabbit Farmer represent 60% and 15 Rabbit Farmer represent 30% and 5 Rabbit Farmer represent 10percent. The result from the table shows that highest percentage of the farmer (60%) treats their rabbits themselves when diseases. The resulting to self-medication could be away of cutting cost on part of the farmers but could be highly detrimental on livestock business. It could be also be possible to reduce disease infestation to barest minimum when farmers learn the act of employing the service of veterinary doctor. It has been established that the major causes of death in even in humans is self-medication. The push for self-medication by the majority could also be associated with their stock size which is small; two on the average, the small body size of rabbit could also propel farmers into self-medication as farmer can easily forgo rabbit supported by Nnodim, et al. report.
| S/N | Method of disease treatment | No. of Rabbit Farmer | Percentage (%) | |||||||
|---|---|---|---|---|---|---|---|---|---|---|
| 1 | Modern drug | 20 | 40 | |||||||
| 2 | Indigenous knowledge | 18 | 36 | |||||||
| 3 | Both | 12 | 24 | |||||||
| Total | 50 | 100 |
Table 20: Distribution of treatment of disease problem.
It could be view from the above table 21 that 20 Rabbit Farmer represent 40% while 18 represent 36% and lastly Rabbit Farmer represent 24 percent. The majority of the farmer used modern drug in treatment this might may be that there is access to affordable rabbit medication and the average stock size of two given the farmer motivation factor of the usage of modern drugs as the cost of treatment. May be cheap when compared to treating large stock size.
| S | /N | Source of information | No. of Rabbit Farmer | Percentage (%) | ||||||
|---|---|---|---|---|---|---|---|---|---|---|
| 1 | Fellow farmers | 15 | 30 | |||||||
| 2 | Media | 4 | 8 | |||||||
| 3 | Veterinaries | 15 | 30 | |||||||
| 4 | Extension officers | 4 | 8 | |||||||
| 5 | Internet | -- | - | |||||||
| 6 | Personal knowledge/ experience | 12 | 24 | |||||||
| Total | 50 | 100 |
Table 21: Distribution of the source of information on appropriate drugs use for rabbit disease by Rabbit Farmer.
From the table 22 above it could be view that 12 Rabbit Farmer represent 24%, 4 Rabbit Farmer represent 8%, 15 Rabbit Farmer represent 30%, 4 Rabbit Farmer represent 8% and 15 Rabbit Farmer represent 30 percent. The majority of the farmers source information on appropriate drugs for rabbit’s treatment from fellows’ farmers. This could be that the farmers have more trust and confidence in fellows farmers especially those that are into the enterprise before them, as they could be speaking from the experience this is in accordance with the Mbutu, et al. that more rabbit farmers ware influence by their neighbor as they search for information on rabbit farming from them as well as from livestock officers.
| S/N | Veterinary service | No. of Rabbit Farmer | Percentage | ||||||||
|---|---|---|---|---|---|---|---|---|---|---|---|
| 1 | Yes | 36 | 72 | ||||||||
| 2 | No | 14 | 28 | ||||||||
| Total | 50 | 100 | |||||||||
| S/N | Cost of drugs | No. of Rabbit Farmer | Percentage (%) | ||||||||
| 1 | High | 21 | 42 | ||||||||
| 2 | Not high | 29 | 58 | ||||||||
| Total | 50 | 100 |
Table 22: Distribution of availability of veterinary service.
From the above table 23 it shows that 36 Rabbit Farmer represent 72% and 14 Rabbit Farmer represent 28%. This result tends to shows that there is availability of veterinary officer’s services but to consider their services, rabbit’s farmers are not due low average stocks.
From the above table 24 it shows that 2i Rabbit Farmer represent 42% and 29 Rabbit Farmer represent 58% this could be supported by premium selecting of good healthy rabbits stocks for production which may tends to reduce incidence of diseases among farmers.
| S/N | Management of disease | No. of Rabbit Farmer | Percentage | |||||||
|---|---|---|---|---|---|---|---|---|---|---|
| 1 | Yes | 41 | 0.83 | |||||||
| 2 | No | 9 | 0.18 | |||||||
| Total | 50 | 1 |
Table 23: Distribution of constraint in management of disease by Rabbit Farmers.
18% the result above shows that there are various constraint and challenges facing the farmers at a whole.
| S/N | Vaccines availability | No. of Rabbit Farmer | Percentage (%) | |||||||
|---|---|---|---|---|---|---|---|---|---|---|
| 1 | Yes | 30 | 60 | |||||||
| 2 | No | 20 | 40 | |||||||
| Total | 50 | 100 |
Table 24: Distribution of unavailability of vaccines.
From the above table 26 it shows that 30 Rabbit Farmer represent 60% and 20 Rabbit Farmer represent 40% the costs of vaccines may tend to increase the availability of vaccines for the farmers that are willing to use it.
| S | / | N | Storage and unfamiliar symptoms | No. of Rabbit Farmer | Percentage (%) | ||||||
|---|---|---|---|---|---|---|---|---|---|---|---|
| 1 | Yes | 37 | 74 | ||||||||
| 2 | No | 13 | 26 | ||||||||
| Total | 50 | 100 |
Table 25: Distribution of storage and unfamiliar symptoms.
From the above table 27 it shows that 37 Rabbit Farmer represent 74% and 13Rabbit Farmer represent 26%. Lack of knowledge and low average experience may tends to enable farmers to be unfamiliar to storage and disease symptoms.
| S | /N | Lacks of training on diseases management | No. of Rabbit Farmer | Percentage | |||||||
|---|---|---|---|---|---|---|---|---|---|---|---|
| 1 | Yes | 40 | 80% | ||||||||
| 2 | No | 10 | 20% | ||||||||
| Total | 50 | 100% | |||||||||
| S/N | Poor extension contact | No. of Rabbit Farmer | Percentage | ||||||||
| 1 | Yes | 42 | 84% | ||||||||
| 2 | No | 8 | 16% | ||||||||
| Total | 50 | 100% |
Table 26: Distribution of lacks of training on disease management by Rabbit Farmer.
20% this is due to the low average experience in rabbits farming.
From the above table 29 it shows that 42Rabbit Farmer represent 84% and 8Rabbit Farmer represent 16%. Due to the low cost of drugs and low cost of vaccines, this tends farmers to need or have low demand for extension services or the information that is readily available from others farmers may be the major reason for low extension officers turn up.
Conclusion
From the findings of this research work, it can be deduced that the farmers placed high premium on selecting disease free rabbits also s breeding stock. It also pointed out that farmers treat by selves using modern drugs, majority. Furthermore the study noted in preponderance of small-and ultra-small holder rabbit’s production units in sokoto south local government of Sokoto state. Backyard rabbit’s keepers cut cross all ages and professions. The only major source or designated center for foundations/replacement stocks is other farmers breeding activities were mainly seasonal. Notable constraints include diseases, finance, theft, capitals and others more so dry season also affects doe mating and its marketing rate is mainly normal and rabbit are mostly selling in the market.
Recommendations
There is need for co-ordination and streamlining of the activities of the peasant farmers. It is therefore recommended that farmers should minimize the usage of personal experience in disease management but should make effort to engage the service of veterinary doctors in ensuring healthy farm and veterinary expert should less the cost of the services to the rabbits farmers and government should add subsidy to vaccines and rabbits drugs and also made available and others requirement against rabbits production constraints. Extension agent should also reach out to rabbit’s farmers with relevant information that could boost their production and turn to increase their living standard.
Rabbit’s farmers should also learn how to improve their breeding stock by also making use of research institute for breeds stock or replacement. Market of rabbits should also be made available for easy access of buying and selling of rabbits and to increase rabbits marketing and patronization rate. This will also encourage others people to engage in rabbits production and also boost the economics of a state, since they are highly rich in protein production for consumption.
References
-
Owen JE (1976) Rabbit production in tropical development centres. A review Trop Sci 18(4): 203- 210.
-
Oseni SO, Ajayi BA, Komolafe SO, Siyanbola O, Ishola M, et al. (2008) small holder Rabbit production in south weatern Nigeria: Current Status, emergency Issues and way forward. Management and Economy, 9th World Rabbit Congress, Verona-Italy, pp: 1597- 1602.
-
Attamah J, MAtlamah CO, Mnodim ME (2008) Disease Management practice among Rabbits farmers in Enugu State Nigeria. Journal of Agricultural extension 22(3).
-
Baruwa IO (2014) Profitability and constraints to rabbits productions under tropical conditions in Nigeria. Journal of livestock sciences 5: 83-88.
-
Tom W, Smith (2007) Emeritus, Professor of poultry Science, Mississippi State University. Extension Service of Mississippi State University, Cooperating with U.S. Department of Agriculture Published in furtherance of Acts of congress.
-
Ray Molbay (2008) Behavior and performance of growing Rabbits under various floor types. Global Vegetarian 14(1): 149-153.
-
FAO (2008) The Rabbit Husbandary, health and Production Chapter 6: Housing Equipment, produced by agriculture consumer protection. FAO corporate Document Repository.
-
Gill, Charlie (2004) The art of Palpation Country Size Magazine.
-
Grund AS (2016) Animal Kingdom: Effects of Animal Diseases or bis Biosciences.
-
Lamidi WA (2005) Environmental and Different Management Systems in Rabbit Does A review American Journal of Environmental Policy and management 3: 51-56.
-
Ontario H (2008) US Department of Agriculture marketing Services. United State Classes, Standard and Grades for Rabbits.
-
LukeFahr Steven, Cheeke PR, MCHITT JI, Patton NM (2004) Limitation of intensive meat rabbit production in North America. A Review Canadian Journal of Animal Science 84: 349-360.
-
Lukefahr, Steven G, Schuster KG, Caution Mc, Verma T, et al. (2010) Self Sustaining Rabbit projects A pilot Study involving feed of sweet potatoes forage. Proceedings of the 4th Rabbit Congress of the Americans Carsoba, Argentina.
-
Mailafia S, Onakpa MM, Owoleke OE (2010) problems and prospects of Rabbit Production in Nigeria A review. Bayero Journal of Pure and Applied Science 3(2): 20-25.
-
Mbutu EMM (2018) Factor influencing Rabbit farming. A Case of Rabbit Production project in Abothguchi west division, Meru Country Kenya Department of Agricultural Economics. University of Marrobi, Kenya.
-
Samkol P, Lukefatir SD (2008) A Challenging Role for organic Rabbit production Towards Poverty Alleviation in Soulth East Asia 9th world Rabbit Congree Verona Italy.
-
USDA-APHIS-VS (2002) U.S. Rabbits industry profile United States Department of Agricultural Animal and Plant Health Inspection Service/Veterinary Services Centres for Epidemiology and Animal Health, centre for emergency Issues, Fat Collins. Co. www.aphisUsda.
-
USDA Fsis (2006) Rabbit From farm to Table Fact Sheet.
- California Red-Legged Frog and Non-Listed Amphibians Response to Non-Native Fish Removal
- Industrial Standardization of the Bio-OS: Algorithmic Codification of Resilience Engineering Guidelines and Version V8 Architecture
- Climate Variability and the Sustainability of Snail Farming in Nigeria: Past Trends, Present Challenges and Potential Outlook
- The Evaluation of the Surveillance System of Anthrax in Gilgit-Baltistan, Pakistan, 2018
- Natural Decline to Extinction of A New Zealand Rabbit Population
- Mitochondrial Bio-Logistics: Steering Co-Enzyme Q10 and Lycopene Synergies within the Science 4.0 Bio-OS Framework