Population Dynamics of Mosquitoes (Diptera: Culicidae) in their Larval Stage: Relationship with Some Climatic Variables through Mathematical Modeling in Villa Clara, Cuba
Emerging and re-emerging diseases are the health problems have aroused interest world. This work to determine the influence some meteorological variables exert in the larval populations of culicids, by means of the mathematical modeling in the province Villa Clara, Cuba. Regressive Objective Regression (ROR) the following variables as responses: general and specific larval densities, and as explanatory variables: relative humidity, temperature, precipitation, cloudiness, mean wind speed and atmospheric pressure. The real and predicted value was plotted for the province. The analysis of variance corresponding time series for the General Larval Density (GLD) and the Specific Larval Density (SLD) the province of Villa Clara and in three municipalities (Ranchuelo, Sagua la Grande and Santa Clara), the correlations were designed between the predicted and real value of meteorological variables. General and specific larval densities showed a cyclical and seasonal behavior, with the high values from May to October, coinciding with the rainy period in Cuba. Temperature, relative humidity, mean wind speed and atmospheric pressure proved to be excellent predictors of population dynamics of mosquitoes with entomoepidemiological importance and; therefore, for surveillance mosquito borne diseases in both human and animal populations. Predictive models for general and specific larval densities based on meteorological variables allowed the population dynamics of mosquitoes, in both urban and rural ecosystems, and their impact on the risk of disease transmission, thus allowing better predictive scenarios to be developed and supporting the implementation of better control strategies.
Introduction
Emerging and reemerging diseases are health problems which have significantly increased worldwide during last year’s [1, 2, 3]; many of them are considered catastrophes resulted from their high morbidity and/or lethality as well as their negative economic impact on the health sector, tourism, industry and trading [4, 5, 6]. The changing epidemiology and predisposing factors for the responsible for the dramatic resurgence of such diseases are complex since a large proportion are zoonosis [7, 8, 9, 10]. Furthermore, global and/or local demographic, social and environmental changes have led to the spread of infection to humans [11, 12, 13].
Global warming and the intensification of extreme meteorological disturbances, have brought spatiotemporal changes on the behavior of vectors and the diseases they transmit [14, 15, 16, 17]. Meteorological conditions are considered one of the most important factors related to the spread of vector borne diseases, the clematis variables with the most significant influence are temperature, humidity and rainfall [18, 19, 20]. Nevertheless, other determining factors contribute to the appearance of major epidemic outbreaks caused by local levels of socioeconomic development, the increase in human mobility and trading, urbanization and deforestation [8, 16, 21].
Alongside tropical and subtropical regions, vector borne emerging and reemerging diseases affect millions of people yearly [22, 23, 24, 25]. Among vectors, culicids are the ones of biggest hygienic-sanitary importance because are responsible for the maintenance and transmission of pathogens causing Malaria, Dengue, Chikungunya, Zika, Yellow Fever, West Nile Fever, and Lymphatic Filariosis [26, 27, 28, 29, 30, 31].
Malaria is the main parasitic disease worldwide [31, 32], it caused 429,000 deaths in 2015. About 90% of malaria- related global deaths occur in Africa, 70% of them in children under five years old [31, 32]. Dengue has spread during last decades and still the worst arboviral disease [3, 33, 34], Chikungunya and Zika have emerged recently [35, 36, 37, 38, 39]. In the Americas, Yellow Fever remains a persistent heath threat 4,066 cases and 58% lethality between 1985 and 2012 [30, 31]. An outbreak affected 295 people (72% lethality) in Brazil from December to February 2017 [28, 40]. In Africa, 150 Yellow Fever outbreaks were reported between 1980 and 2012, and 200,000 cases occurred globally [27, 28, 30, 41].
Climate is a key factor determining temporal and geographical distribution of arthropods and their life cycles, and therefore evolution of associated arboviruses, as well as the efficiency they are transmitted by culicids to vertebrate hosts [8, 10, 11, 20, 33]. As vector reservoirs are susceptible to seasonal changes and climatic conditions and the transmission dynamics of arboviral diseases are interlinked [42, 43, 44]. The impact of climate on vector borne diseases might be mitigated by surveillance systems with early warning for epidemic outbreaks, thus reducing disease impact [17, 20, 34, 43].
In Cuba, the emergence and reemergence of arboviral infections are a health problem as there is a tendency to increase the number of cases as well as the populations of vector organisms [9, 10, 45, 46, 47]. Although meteorological variables are determinant in the transmission of arboviral diseases, in Cuba there are few studies on the effect of these variables on larval density of culicids with entomoepidemiological importance.
Therefore, this research was undertaken to determine the influence of meteorological variables on population dynamics of mosquito larval stages through mathematical modeling in Villa Clara province, Cuba.
Materials and Methods
Study Area
The investigation was carried out in all 13 municipalities of Villa Clara province, Cuba, The province, limits to the East with Sancti Spíritus province, to the West with Matanzas province, to the South with Cienfuegos province and to the North with the Atlantic Ocean; its capital and most populated city is Santa Clara (Figure 1).
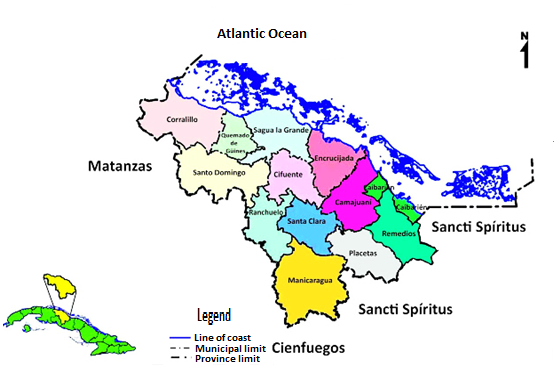
Source: Provincial Meteorological Center of Villa Clara. Figure 1: Administrative map of Villa Clara province, Cuba.
The Provincial Unit for Surveillance and Vector Control (UPVLA) registered 316,370 houses and/or establishments in the general universe, where 236,391 (74.7%) belong to the urban area. These places cumulate approximately 1,581,850 tanks intended for water storage that provide favorable conditions for the breeding, proliferation and dissemination of culicids. In the province were identified, 304 permanent and 218 temporal culicid.
Survey Design
This retrospective study based on documentary review of statistical records and archives existing from 2007 to 2017 at UPVLA, at the Provincial Department of Health Statistics and the Provincial Meteorological Center of Villa Clara. This step revealed the entire entomological history of the monthly reports of all permanent (n=304) and temporal (n=218) conceived in the urban area of the 13 municipalities, and reached all permanent (n=304) and temporal (n=218) hatcheries spread in the urban area of 13 municipalities. The meteorological variables data (i.e. Maximum Temperature (MT), Average Temperature (AT), Minimum Temperature (MT), Maximum Relative Humidity (MRH), Average Relative Humidity (ARH), Minimum Relative Humidity (MRH), Provincial Precipitation (Prec.), Atmospheric Pressure (AP), Average Wind Speed (AWS) and Cloud cover (Cloud) comprised five meteorological stations located in Santa Clara, Manicaragua, Caibarién, Santo Domingo and Sagua La Grande.
The mosquito larvae collection was performed by the bucket method [48], later larvae were identified under a MSB-9 stereo microscope following specialized keys [49, 50, 51, 52] taking into account all later variations in the systematics and taxonomy of culicids [53, 54, 55].
Calculation of Larval Density (LD)
The calculation of General Larval Density (GLD) and Specific Larval Density (SLD) of Anopheles mosquitoes followed the formula:
L LD= N X F
Where;
LD = Larval Density, L = Total of collected larvae, N = Number of buckets, and F = Fraction, a constant which is equal to 0.01 in 10 cm diameter buckets, as the constant is the bucket diameter square expressed in square meters.
Information Analysis
The surveillance data was organized in Windows Excel by the variables: years, months the reported general and specific larval densities. Then, were calculated time series and tendencies for each of the variables at the municipal and provincial levels.
Mathematical Modeling
The prediction model was fitted using a Regressive Objective Modeling (ROR) [52, 56], where the focality of Ae. aegypti was the Response Variable and the meteorological variables were the Explanatory Variables. The data was processed using Pearson and t Student correlations as statistical significance tests in the statistical package SPSS ver. 13.
As a first step for the ROR prediction were created the dichotomous variables DS, DI and NoC, where:
NoC: Number of cases, DS = 1, if NoC is odd, DI = 0, if NoC is even, When, DI = 1, DS = 0 and vice versa.
Subsequently, was executed the corresponding Regression analysis module on the statistical package SPSS version 19.0 (IBM, 2010), specifically the ENTER method where the predicted variable and the ERROR were obtained.
Then the ERROR variable auto correlograms were obtained, with special attention on the maximums of the significant partial autocorrelations (PACF). The new variables were then calculated according to the PACF significant Lag. Finally, these regressed variables were included in the new regression in a process of successive approximations until obtaining a white noise in the regression errors, delays of one year in advance were used for atmospheric pressure as recommended by other authors for climate indexes [52, 56].
Results
The Provincial ROR Model
The combination of delays 1, 2 and 6, showed a perfect model for each of the municipalities. The 100% variance was explained, with a practically imperceptible standard error; the Durbin Watson statistic indicates there is no information on the residuals, since a perfect model was fitted (Table 1).
| Model | R | R2 | Corrected R2 | Estimation typical error | Durbin-Watson |
|---|---|---|---|---|---|
| 1 | 1.000a | 1 | . | . | 1.268 |
Table 1: Summary of the ROR model for Villa Clara province. a. Prediction Variables: LAG6Foci, DI, LAG1 Foci, LAG2 Foci. b. For r
Table 1: Summary of the ROR model for Villa Clara province. a. Prediction Variables: LAG6Foci, DI, LAG1 Foci, LAG2 Foci. b. For regression through the origin (the model with no intersection term), R2 measures the proportion of the variability of the dependent variable explained by the regression through the origin. The comparison with R2 is not possible in models that include an intersection. c. Dependent Variable: Province; d. Linear regression through origin.
The model visualized in Table 2 shows the coefficient for the different model parameters. This depends on the number of outbreaks 1, 2 and 6 years ago, where the tendency
| Model B | Non-standardized coefficients | Typified coefficients | t | Sig. | ||
|---|---|---|---|---|---|---|
| Typical error | Beta | |||||
| 1 | DS | 14114.7 | 0 | 1.4 | . | . |
| DI | 12952.32 | 0 | 1.049 | . | . | |
| LAG2Foci | -0.546 | 0 | -0.574 | . | . | |
| LAG1Foci | -0.886 | 0 | -0.917 | . | . | |
| LAG6Foci | 0.875 | 0 | 0.685 | . | . |
Table 3: Coefficients obtained according to ROR methodology for the province. a. Dependent Variable: Province; b. Linear regressi
| Minimum | Maximum | Mean | Typical deviation | N | |
|---|---|---|---|---|---|
| Predicted value | 4497 | 9749 | 7601 | 1999.6683 | 5 |
| Residual | 0 | 0 | 0 | 0 | 5 |
| Typical predicted value | -1.552 | 1.074 | 0 | 1 | 5 |
| Typical residue | . | . | . | . | 0 |
Table 4: shows the residuals statistics for predicted value and residual. a. Dependent Variable: Province; b. Linear regression t
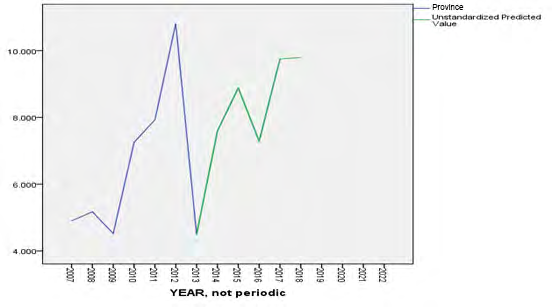
In the provincial model the predicted value showed an excellent coincidence with the real value from 2013 to 2017, then the forecast for 2018 remain similar to the previous year (Figure 2).
- (NoC) was extracted from the model, so there is stability in collecting the provincial data.
- Analysis of Variance
- Since the residuals are zero, the analysis of variance for the General Larval Density (GDL) indicates that the Fisher’s
- F cannot be determined (Table 4).
- Model
- Sum of squares gl
- Mean square
- F Sig.
- 1
- Residual regression
- 3.05E+08
- 5 60,971,099,200 .
- .a
- 0
- 0
- .
- Total
- 3.05E+08
- 5
Table 2: Analysis of variance for the General Larval Density
A summary of the obtained models express that most of explained variance occurreds equally in all municipalities and it is 100%; most of tendencies did not appear, except in Cifuentes municipality were it was prone to increase and in Caibarién and Ranchuelo to decrease. The most significant delays were 2, 1 and 6 (Table 5).
| Municipalities | Durbin Watson | DS | DI | NoC | Lag2 | Lag1 | Lag6 |
|---|---|---|---|---|---|---|---|
| Corralillo | 1.459 | 16.99 | 2.709 | -1.09 | 1.936 | -2.198 | |
| Quemado | 1.889 | 22.85 | 3 | 0.148 | -3.89 | 18.41 | |
| Sagua | 0.892 | 2400 | 3919 | -2.36 | -1.36 | 6.348 | |
| Encrucijada | 2.184 | 5.968 | 6.437 | -0.48 | 0.378 | -0.194 | |
| Camajuaní | 1.655 | 141.7 | 65.98 | -2 | 0.802 | 0.534 | |
| Caibarién | 2.044 | -14.88 | -4.604 | 3.378 | -1.38 | 5.901 | |
| Remedios | 1.328 | 160.4 | 300.25 | -2.89 | -0.6 | 6.846 | |
| Placetas | 1.808 | 126.9 | -14.28 | -2.78 | -1.45 | 12.97 | |
| Santa Clara | 1.397 | 13432 | 12753 | -0.43 | -0.76 | 0.008 | |
| Cifuentes | 1.567 | 143.4 | -136.4 | 19.708 | 0.807 | -0.986 | |
| Santo Domingo | 1.57 | 356.3 | 399.82 | -0.75 | -2 | 15.04 | |
| Ranchuelo | 1.63 | -78.03 | -130.3 | -33.25 | 0.253 | 10.69 | |
| Manicaragua | 2.415 | 418.5 | 467.47 | -1.3 | -0.15 | 0.482 | |
| Province | 1.268 | 14114 | 12952 | -0.55 | -0.89 | 0.875 |
Table 5: Results of the GLD modeling per municipalities.
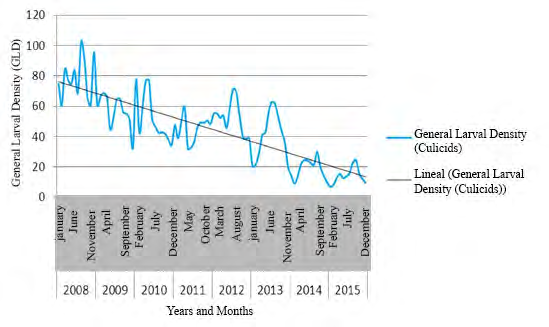
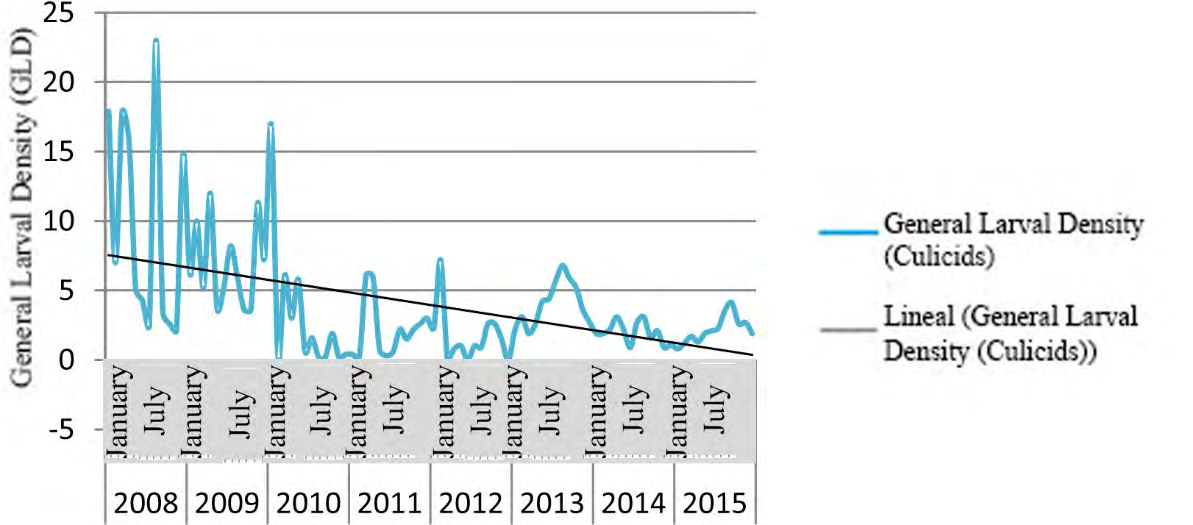
Figure 3 shows the time series of culicids GLD in Villa Clara province, from 2008 to 2015.
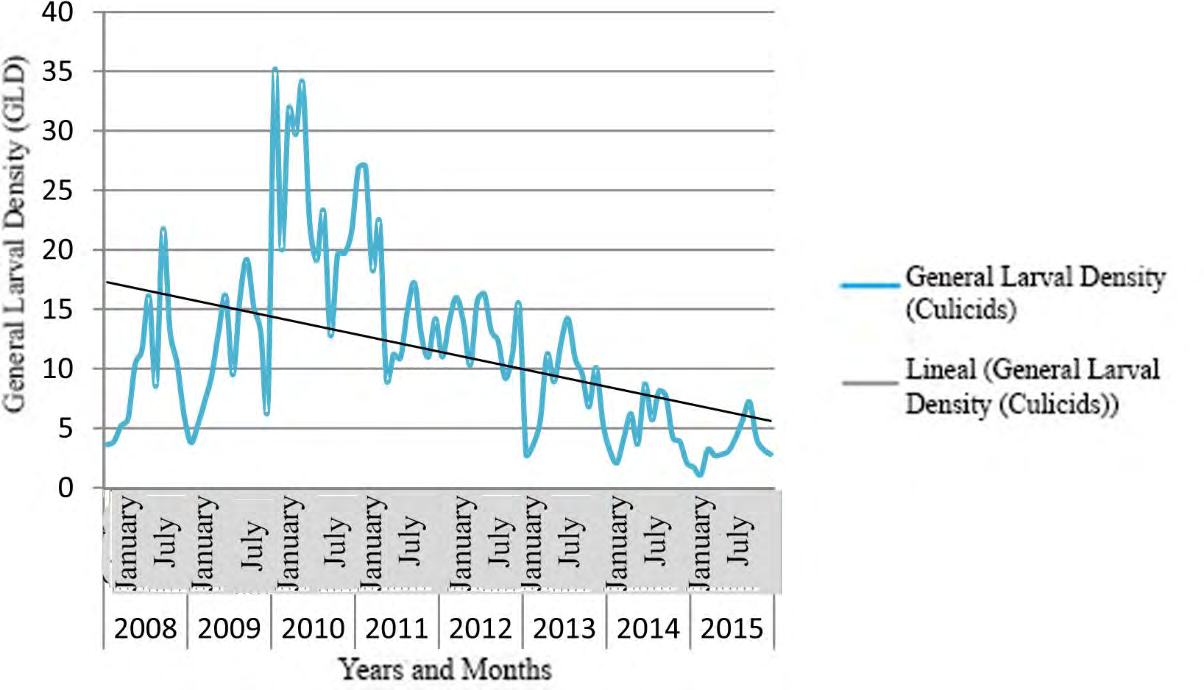
Figures 4-6 show the time series for GLD in three municipalities of Villa Clara province; these results confirm the seasonal cyclical behavior of culicids, and the downward tendency of this variable.
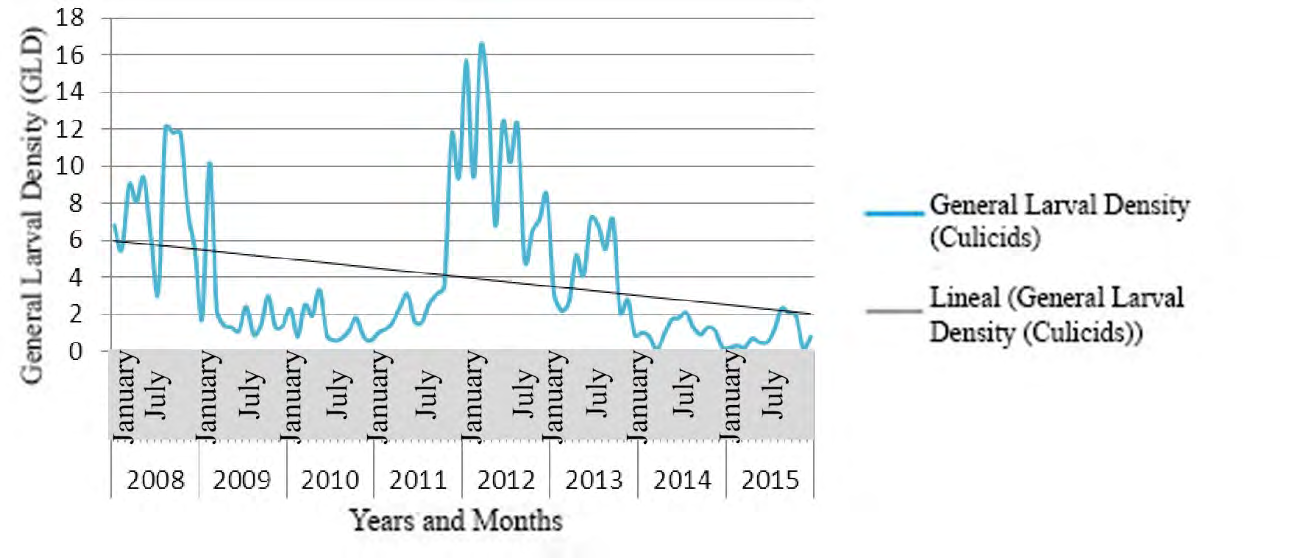
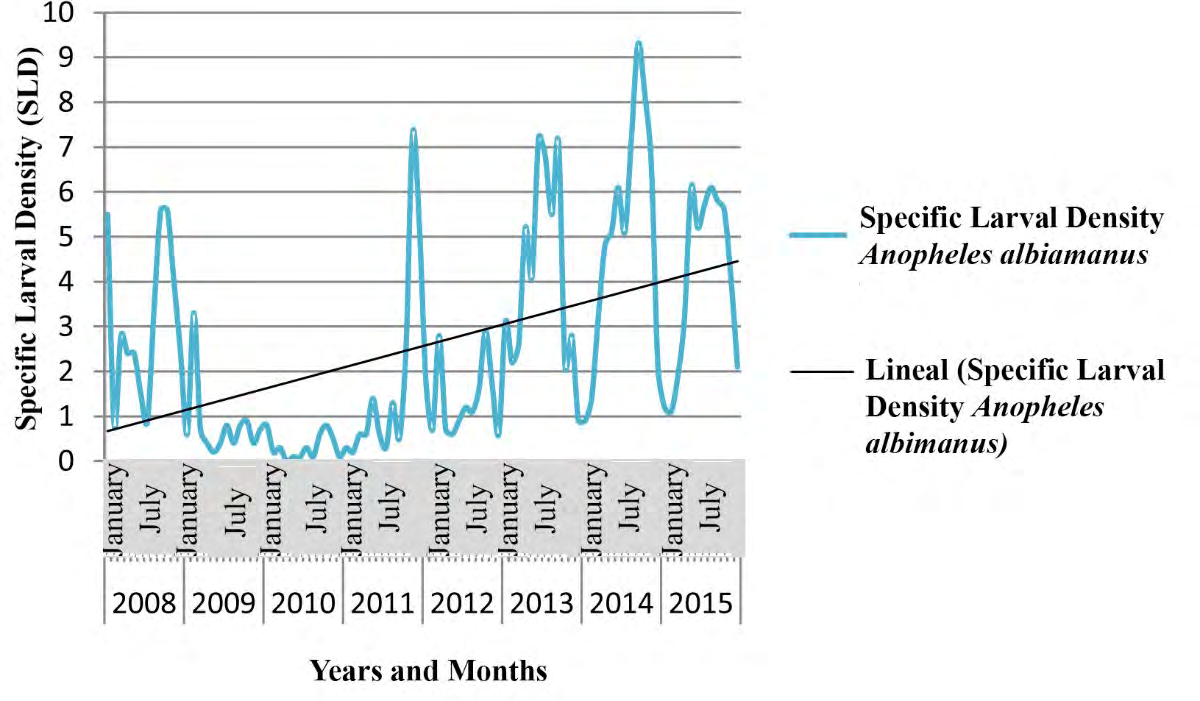
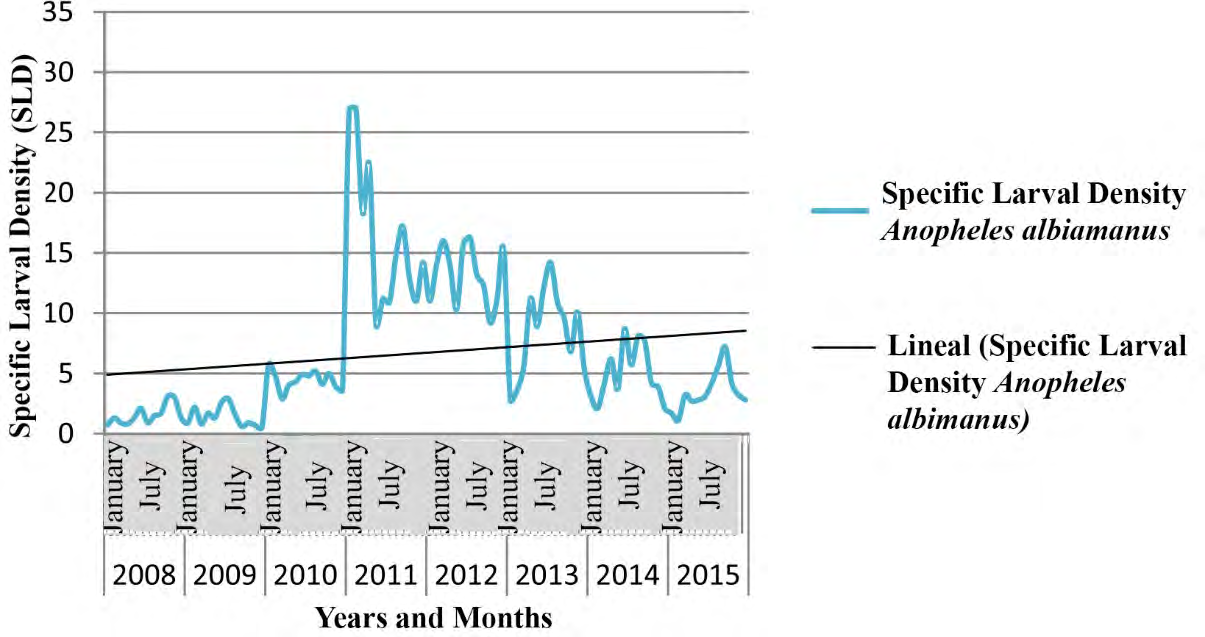
The tendency of the Specific Larval Density (SLD) was to increase, displaying a full correspondence between meteorological variables and the ecology of vectors belonging to Anopheles genus.
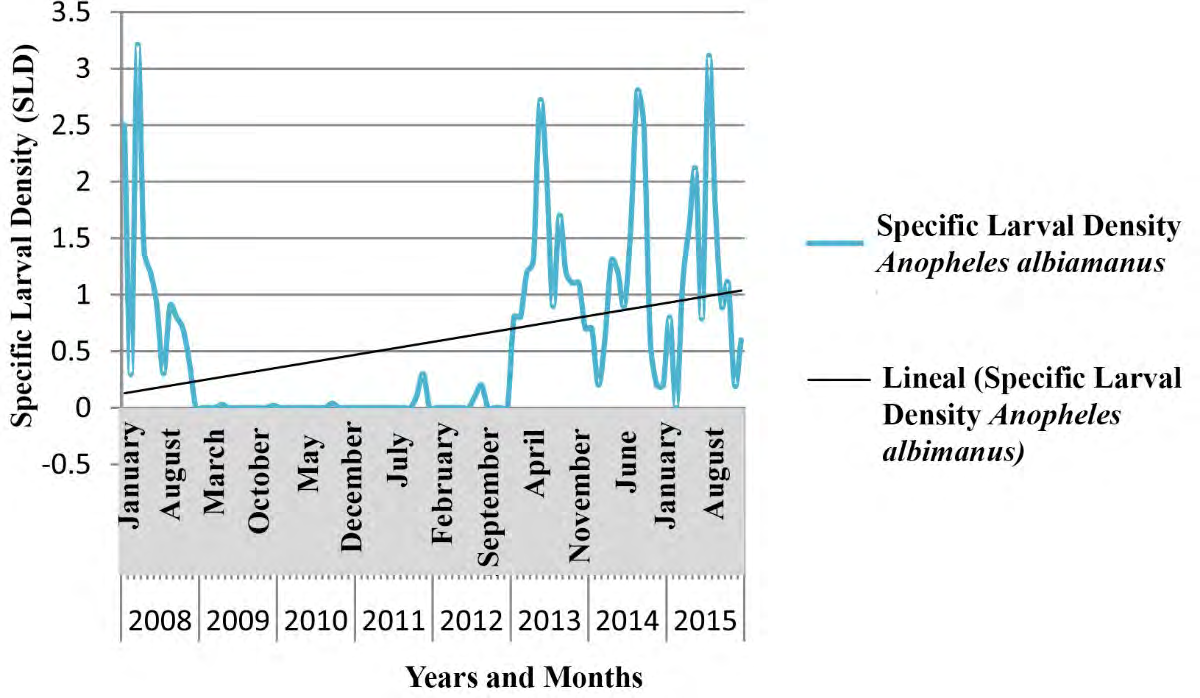
Figures 7-9 show the seasonal cyclical behavior of Anopheles albimanus larval density, the highest indexes coincided with the rainy season.
Prediction with Statistical and Climatic Variables
The prediction with statistical variables first, and then with climatic variables, showed the later had the highest correlation with the errors of the pure statistical models, influencing the proximity of the meteorological station. The correlations between the real value and those predicted by both models were calculated, observing that 9 models with climatic variables exceed the pure statistics and 4 models remain the same, since the influence of climatic variables was not significant. Table 6 resume the climatic variables that entered as significant in the models, for example, in Santa Clara the Atmospheric Pressure and the Average Relative Humidity recorded in the Meteorological Station Yabú. Santa Clara was the best modeled municipality with climatic variables (52.14% SKILL).
| Municipalities | Pure statistic model | Model with climate variables | SKILL (%) | Climate variables | |
|---|---|---|---|---|---|
| Corralillo | 0.287 | 0.515** | 44 | Average Temperature Sagua | |
| Quemado | 0.486* | 0.486** | - | - | |
| Sagua | 0.505** | 0.505** | - | - | |
| Encrucijada | 0.726** | 0.726** | - | - | |
| Camajuaní | 0.475** | 0.626** | 24.12 | Average Humidity Sagua | |
| Caibarién | 0.741** | 0.882** | 15.99 | Precipitation Sagua | |
| Remedios | 0.538** | 0.538** | - | - | |
| Placetas | 0.657** | 0.658** | 0.15 | Atmospheric Pressure Yabú | |
| Santa Clara | 0.246 | 0.514** | 52.14 | Atmospheric Pressure, Average Relative Humidity Yabú | |
| Cifuentes | 0.617** | 0.681** | 9.4 | Cloud cover Yabú | |
| Santo Domingo | 0.370* | 0.593** | 37.61 | Minimum Relative Humidity Sto. Domingo | |
| Ranchuelo | 0.382** | 0.482** | 20.75 | Average Wind Velocity Yabú | |
| Manicaragua | 0.686** | 0.751** | 8.66 | Atmospheric Pressure Average Relative Humidity Yabú | |
| Model | R | R2 | Corrected R2 | Estimation typical error | Durbin-Watson |
| 1 | .910a | 0.829 | 0.805 | 270.242 | 1.239 |
| a. Prediction Variables: xy13_mean, DS, Lag25Foci, Lag13Foci, Lag73Foci, NoC, xy10_mean | |||||
| b. For regression through the origin (the model with no intersection term), R2 measures the proportion of the variability of the dependent variable explained by the regression through the origin. The comparison with R2 is not possible in models that include an intersection. | |||||
| c. Dependent Variable: Santa Clara | |||||
| d. Linear regression through origin |
Table 6: Correlation between predicted and real values of climate variables per municipalities. SKILL = (1 – (Pure Model / Model
As an example, Santa Clara municipality was selected for show the results of the model with climatic variables (Table 7). The model explained 91% of variance (standard deviation of 270 foci), the Durbin Watson statistic advice more variables might be including and that more information from the residuals might be add to the model.
The analysis of variance was significant, with a 35.2 Fisher’s F (Table 8).
| Model | Sum of squares | gl | Mean square | F | Sig. | |
|---|---|---|---|---|---|---|
| 1 | Regresión | 18001018.2 | 7 | 2571574.03 | 35.21 | .000a |
| Residual | 3724565.804 | 51 | 73030.702 | |||
| Total | 21725584.000b | 58 |
Table 7: Analysis of variance with climate variables for Santa Clara. a. Prediction Variables: xy13_mean, DS, Lag25Foci, Lag13Foc
Table 8: Analysis of variance with climate variables for Santa Clara. a. Prediction Variables: xy13_mean, DS, Lag25Foci, Lag13Foci, Lag73Foci, NoC, xy10_mean b. The total squares sum was not corrected for the constant because the constant was zero in the regression through origin. c. Dependent Variable: Santa Clara d. Linear regression through origin The model depends of the foci data one year and a month ago (Lag13Foci), two years and a month ago (Lag25Foci) and six years and a month ago (Lag73Foci), although they were non-significant variables they provided variance to the model. The tendency was negative and non-significant (Table 9).
| Model B | Non-standardized coefficients | Typified coefficients | t | Sig. | ||
|---|---|---|---|---|---|---|
| Typical error | Beta | |||||
| 1 | DS | 60.47 | 72.938 | 0.069 | 0.829 | 0.41 |
| Tendency | -0.377 | 2.467 | -0.064 | -0.15 | 0.88 | |
| Lag25Foci | -0.151 | 0.098 | -0.16 | -1.54 | 0.13 | |
| Lag13Foci | -0.197 | 0.121 | -0.183 | -1.62 | 0.11 | |
| Lag73Foci | 0.075 | 0.114 | 0.083 | 0.656 | 0.52 | |
| Mean Relative Humidity | 35.55 | 9.426 | 4.773 | 3.771 | 0 | |
| Atmospheric Pressure | -2.237 | 0.736 | -3.664 | -3.04 | 0 | |
| a. Dependent Variable: Santa Clara | ||||||
| b. Linear regression through origin |
Table 8: Foci model with climate variables for Santa Clara.
Discussion
The combination of delays 1, 2 and 6 allowed fitting a perfect model for each of the municipalities. Since the influencing parameters could not be measured because were displayed divisions by zero, it was necessary to apply mathematical definitions recommended by other authors [56, 57].
The standardized residuals showed a mean value of zero and a standard deviation of 1, as corresponds to a perfect model, coinciding with previous researches [52, 56, 57]. The models exposed in Table 5 indicate that the highest explained variance occurred equally in all municipalities and was 100%; the most significant delays were 2, 1 and 6. These good fitting results by ROR models were also reported by others [56, 57, 58, 59].
The GLD showed a seasonal cyclical behavior (Figures 2-6), with a tendency to decrease. Peak values of GLD appeared between May and October, coinciding with the highest temperature and rainfall in Cuba. This climate favor mosquito proliferation, catalyzing the hatching/emergence of eggs, increasing the female’s sub-population and shortening their life cycle; therefore, increase the morbidity due to mosquito borne diseases in humans and animals [60, 61, 62, 63]. Results of this research partially agree with those reported by García, et al. [64], who found the highest larval density in river ecosystems occurred in October 2009 and 2010 in a health area of Santa Clara municipality. Nevertheless, both researches differs regarding the extension of the study area and period, the present work covered 522 temporal and/ or permanent Culicidae hatcheries throughout Villa Clara province during eight years, which allowed displaying confident chronological series since they need three to four years data at least. Additionally, García, et al. [64] carried out their work under a different design, including only a health area of Santa Clara, which is the most densely populated municipality in the province showing the highest rates of culicids Larval Density, the highest urbanization and the largest number of deposits for water storing.
The time series for GLD in three municipalities of Villa Clara province (Figures 4-6) displayed a tendency to decrease coinciding with the intensification of control actions against culicids since the emergence of two arboviral diseases in Cuba: Chikungunya and Zika in 2013 and 2015 respectively.
The SLD tendency of Anopheles genus was to increase following seasonal cyclical behavior (Figures 7-9), and showing a full correspondence with meteorological and biological/ecological variables, similar results to those achieved by different authors [9, 65, 66]. The An. albimanus larval density displayed the highest indexes during the rainy season, which constitutes a potential risk for the local transmission of imported Malaria in Cuba [44, 57]. The fitted model depended on the foci data one year and a month ago (Lag13Foci), two years and a month ago (Lag25Foci) and six years and a month ago (Lag73Foci), despite being non- significant variables they provide variance to the model. Climate variables highly influenced larval density, as the Average Relative Humidity increases by 1%, the number of foci increases by 35.5, while increasing Atmospheric Pressure in one Hectopascal influence the focis to decrease by 2.2, results according to those achieved for mosquitoes and other organisms [9, 25, 44, 45, 59].
The wide geographical distribution and increasing proportion among culicids of St. aegypti and St. albopictus in Villa Clara province, represents a high entomoepidemiological risk as they transmit various viruses such as: Dengue, Yellow Fever, West Nile Fever, Chikungunya and Zika [67, 68, 69]. These species are present throughout all Cuban territory, colonizing under the influence of climate variables a significant number of breeding sites generated by the human activity [4, 34, 35, 40], thus showing their high ecological plasticity and adaptability to diverse ecological niches [9, 70].
Conclusion
The meteorological variables significantly influence the modeling of culicids population dynamics. In Santa Clara municipality, the fitted model significantly depended on climate variables recorded in Yabú Meteorological Station; so that as the Average Relative Humidity increases by 1%, the foci quantity increases by 35.5; while one Hectopascal increase of the Atmospheric Pressure, provokes a decrease of 2.2 on the foci amount.
Conflict of Interest Statement
The authors declare that they have no conflict of interest.
Contribution
All the authors contributed substantially to the concrescence of the manuscript, with the largest being concentrated in the first five authors.
Financing
No funding was available.
References
-
Gubler DJ (2002) The global emergence/resurgence of arboviral diseases as public health problems. Arch Med Res 33(4): 330-342.
-
Bhatt S, Gething P, Brady O (2013) The global distribution and burden of dengue. Nature 37: 1103-1016.
-
Valença Araujo ML, Vivas Miranda JG, Sampaio R, Moret MA, Rosario RS, Saba H (2018) Nonlocal dispersal of dengue in the state Bahia. Science of the Total Environment 631: 40-46.
-
Bangs ML, Lavasati RP, Corwin AL, Wuryadi S (2006) Climatic factors associated with epidemic dengue in Palembang, Indonesia: Implications of short-term meteorological events on virus transmission. The Southeast Asian Journal of Tropical Medicine and Public Health 37(6): 1103-1116.
-
Guzmán MG, Alvarez M, Halstead SB (2013) Secondary infection as a risk factor for dengue haemorrhagic fever/ dengue shock syndrome: an historical perspective and role of antibody-dependent enhancement of infection. Arch Virol 158: 1445-1459.
-
Gould E, Pettersson J, Higgs S, Charrel R, de Lamballerie X (2017) Emerging arboviruses: why today? One Health 4: 1-13.
-
Fimia DR, González GR, Cepero RR, Valdés ÁM, Osés RR, et al. (2012a) Influencia de algunas variables climáticas sobre la malacofauna fluvial con importancia zoonótica en la provincia Villa Clara. REDVET 13(7): 16-19.
-
Banu S, Hu W, Guo Y, Hurst C, Tong S (2014) Projecting the impact of climate change on dengue transmission in Dhaka, Bangladesh. Environment International 63: 137- 142.
-
Fimia DR, Marquetti FM, Iannacone J, Hernández CN, González MG, et al. (2015) Anthropogenic and environmental factors on culicid fauna (Diptera: Culicidae) of Sancti Spiritus province, Cuba. The Biologist (Lima) 13: 53-74.
-
Fimia DR, Aldaz CJ, Aldaz CN, Segura OJ, Cepero RO, et al. (2016a) Mosquitoes (Diptera: Culicidae) and their control by means of biological agents in Villa Clara province, Cuba. International Journal of Current Research 8: 43114-43120.
-
Gould E, Higgs S (2009) Impact of climate change and other factors on emerging arbovirus diseases. Transactions of the Royal Society of Tropical Medicine and Hygiene 103: 109-121.
-
Altizer S, Ostfeld RS, Johnson PTJ, Kutz S, Harvell CD (2013) Climate change and infectious diseases: from evidence to a predictive framework. Science 341: 514- 519.
-
Ebi KL, Nealon J (2016) Dengue in a changing climate. Environmental Research 151: 115-123.
-
Alkhaldy I (2017) Modelling the association of dengue fever cases with temperature and relative humidity in Jeddah, Saudi Arabia-A generalised linear model with break-point analysis. Acta Tropica 168: 907-915.
-
Li C, Wang X, Wu X, Liu J, Ji D, et al. (2017) Modeling and projection of dengue fever cases in Guangzhou based on varation of weather factors. Science of the Total Environment 606: 867-873.
-
Li C, Lu Y, Liu J, Wu X (2018) Climate change and dengue fever transmission in China: Evidences and challenges. Science of the Total Environment 623: 493-501.
-
Liu B, Gao X, Ma J, Jiao Z, Xiao J, Abid HM, et al. (2019) Modeling the present and future Distribution of arbovirus vectors Aedes aegypti and Aedes albopictus under climate change scenarios in Mainland China. Science of the Total Environment 664: 203-214.
-
Colón GFJ, Fezzi C, Lake IR, Hunter PR (2013) The Effects of Weather and Climate Change on Dengue. PLOS Neglected Tropical Diseases 7: 1-9.
-
Naish S, Dale P, Mackenzie JS, McBride J, Mengersen K, et al. (2014) Climate change and dengue: a critical and systematic review of quantitative modelling approaches. BMC Infectious Diseases 167: 1-14.
-
Xu Z, Bambrick H, Yakob L, Devine G, Lu J, et al. (2019) Spatiotemporal patterns and climatic drivers of severe dengue in Thailand. Science of the Total Environment 656: 889-901.
-
Lambrechts L, Scott TW, Gubler DJ (2010) Consequences of the expanding global distribution of Aedes albopictus for dengue virus transmission. PLoS Negl Trop Dis 4: e646.
-
Turellet MJ, Dohm DJ, Fernández R, Calampa C, O’Guinn ML (2006) Vector competence of Peruvian mosquitoes (Diptera: Culicidae) for a subtype IIIC virus in the Venezuelan equine encephalomyelitis complex isolated from mosquitoes captured in Peru. Journal of the American Mosquito Control Association 22: 70-75.
-
Cabezas SC, Fiestas DV, García MM, Palomino SM, Mamani CE, et al. (2015) Dengue en el Perú: a un cuarto de siglo de su reemergencia. Rev Peruana Med Exp Salud Publica 66: 219-227.
-
Ngoagouni C, Kamgang B, Nakouné E, Paupy C, Kazanji M (2015) Invasion of Aedes albopictus (Diptera: Culicidae) into central Africa: what consequences for emerging diseases?. Parasites & Vectors 8: 191-197.
-
Bezerra JMT, Araújo RGP, Melo FF, Gonçalves CM, et al. (2016) Aedes (Stegomyia) albopictus dynamics influenced by spatio temporal characteristics in a Brazilian dengue- endemic risk city. Acta Tropica 164: 431-437.
-
Chieh CS, Min LC, Pin CC, Han CH, Han YS, et al. (2010) Lagged temperature effect with mosquito transmission potential explains dengue variability in southern Taiwan : Insights from a statistical analysis. Science of The Total Environment 408: 4069-4075.
-
(WHO) World Health Organization (2014a) State of the Art in the Prevention and Control of Dengue in the Americas. Meeting Report. Washington, DC.
-
Lebl K, Zittra C, Silbermayr K, Obwaller A, Berer D, et al. (2014) Mosquitoes (Diptera: Culicidae) and their relevance as disease vectors in the city of Vienna, Austria. Parasitology Research 114: 707-713.
-
Ferguson NM, Cucunuba ZM, Dorigatti I, Nedjati-Gilani GL, Donnely CA, et al. (2016) Countering the Zika epidemic in Latin America. Science 353(6297): 353-364.
-
Wasserman SS, Edelman R, Tacket CO, Bodison SA, Perry JG, et al. (2016) Yellow fever epidemic. Ame J Trop Med Hyg 62: 681-685.
-
Vasconcelos PF (2017) Yellow fever. In Arthropod borne diseases. Springer International Publishing, Cham, Switzerland 101-113.
-
(WHO) World Health Organization (2015) Country Profile. The World Malaria Report 2014.
-
(WHO) World Health Organization (2016) Zoonoses and Veterinary Public Health. Emerging Zoonoses.
-
Liu HJ, Quam M, Wilder SA, Stenlund H, Ebi K, et al. (2016) Climate Change and Aedes Vectors: 21st Century Projections for Dengue Transmission in Europe. EBioMedicine 7: 267-277.
-
Ganesh KS, Mopuri R, Rao MS, Rao BK, Kumaraswamy S, et al. (2019) Temperature dependent transmission potential model for chikungunya in India. Science of the Total Environment 647: 66-74.
-
Cauchemez S, Ledrans C, Poletto P, Quenel H, Valk V, et al. (2014) Local and regional spread of chikungunya fever in the Americas. Euro Surveill 19(28): 208-214.
-
Zanluca C, Melo VC, Mosimann AL, Santos GI, Santos CN, et al. (2015) First report of autochthonous transmission of Zika virus in Brazil. Mem Inst Oswaldo Cruz 110(4): 569-572.
-
Fauci AS, Morens DM (2016) Zika virus in the Americas – yet another arbovirus threat. N Engl J Med 374(7): 601- 604.
-
Kaur N, Jain J, Kumar A, Narang M (2017) Chikungunya outbreak in Delhi, India, 2016: a report on the co- infection status and co-morbid conditions in patients. New Microbes New Infect 20: 39-42.
-
Saavedra LM, Romanelli GP, Rozo CE, Duchowicz PR (2018) The quantitative structure-insecticidal activity relationships from plant derived compounds against chikungunya and zika Aedes aegypti (Diptera: Culicidae) vector. Science of the Total Environment 610-611: 937- 943.
-
Ministério da Saúde-Brasil (2017) Health Surveillance Secretariat - Center for public health emergency operations on yellow fever.
-
(WHO) World Health Organization (2014b) Global Health Observatory (GHO) data. The world malaria report.
-
Cepero RO (2012) El cambio climático: su efecto sobre enfermedades infecciosas. REDVET 13 (05B).
-
Fimia DR, Osés RR, Otero MM, Diéguez FL, Cepero RO, et al. (2012b) El control de mosquitos (Diptera: Culicidae) utilizando métodos biomatemáticos en la provincia de Villa Clara. REDVET 13(3).
-
Osés RR, Fimia DR, Iannacone OJ, Saura GG, Gómez CL, et al. (2016) Modelación de la temperatura efectiva equivalente para la estación del Yabú y para la densidad larval total de mosquitos en Caibarién, provincia Villa Clara, Cuba. Rev Peruana de Entomología 51: 1-7.
-
(MINSAP) Ministerio de Salud Pública (2016a) Primer caso de virus de zika importado en Cuba.
-
(MINSAP) Ministerio de Salud Pública (2016b) Primer caso de transmisión autóctona de Zika en Cuba.
-
(OMS) Organización Mundial de la Salud (1982) Lucha biológica contra los vectores de enfermedades. Serie de informes Técnicos. 679. Ginebra, Suiza.
-
Pérez Vigueras I (1956) Los Ixódidos y culícidos de Cuba, su historia natural y médica. Ed. Universidad de La Habana. pp: 579.
-
Méndez RJ, Fimia DR, González OI, Moreno MR (2005) Clave pictórica para identificar géneros de Mosquitos Cubanos en su etapa larval. Gaceta Médica Espirituana 3: 1-21.
-
González BR (2006) Culícidos de Cuba. 1st (Edn.), La Habana: Editorial Científico-Técnica. pp: 184.
-
Osés R, Saura G, Pedraza A (2012a) Modelación matemática ROR aplicada al pronóstico de terremotos de gran intensidad en Cuba. REDVET 13 (05B).
-
Reinert J (2000) New classification for the composite genus Aedes (Diptera: Culicidae: Aedini), elevation of subgenus Ochlerotatus to generic rank, reclassification of the other subgenera, and notes on certain subgenera and species. Journal of American Mosquito Control Association 16(3): 175-188.
-
Reinert J (2001) Revised list of abbreviations for genera and subgenera of Culicidae (Diptera) and notes on generic and subgeneric changes. Journal of American Mosquito Control Association 17(1): 51-55.
-
Reinert J (2004) Phylogeny and classification of Aedes (Diptera: Culicidae) based on morphological characters of all life stages zoological. Zoological Journal of the Linnaean Society 142(3): 289-368.
-
Osés R, Grau R (2011) Modelación regresiva (ROR), versus modelación ARIMA, usando variables dicotómicas en mutaciones del VIH. Universidad Central Marta Abreu de Las Villas.
-
Osés R, Fimia DR, Silveira PE, Hernández VW, Saura GG, et al. (2012c) Mathematical model of the density of Anopheles mosquito larva (Diptera: Culicidae) in 2020 in Caibarien, Villa Clara province, Cuba. REDVET 13(3).
-
Osés R, Saura G, Otero M, Pedraza A, Socarrás J, Ruiz N (2012b) Cambio climático e impacto en la salud animal en la provincia de Villa Clara, Cuba. REDVET 13 (05B). URL:
-
Fimia DR, Iannacone J, Osés RR, González GR, Armiñana GR, et al. (2016b) Association of some climatic variables with fasciolosis, angiostrongilosis and fluvial malacofauna in Villa Clara province, Cuba. 10: 259-273.
-
Arenas VAR, Carvajal PLA (2012) Influencia de los cambios climáticos en la definición del sexo en el Aedes aegypti y su impacto en las epidemias de dengue. Revista Facultad de Salud (RFS) 4: 11-24.
-
Grubaugh ND, Saraf S, Gangavarapu K, Watts A, Tan AL, et al. (2009) Travel surveillance and genomics uncover a hidden Zika outbreak during the waning epidemic. Cell 178(5): 1057-1071.
-
Mohammed A, Chadee DD (2011) Effects of different temperature regimens on the development of Aedes aegypti (L.) (Diptera: Culicidae) mosquitoes. Acta Tropica 119(1): 38-43.
-
Rivera GO (2014) Aedes aegypti, virus dengue, chikungunya, Zika y el cambio climático. Máxima alerta médica y oficial. REDVET 15 (10).
-
García GS, Pérez BA, Fimia DR, Osés RR, Garín LG, González GR (2012) Influencia de algunas variables climatológicas sobre las densidades larvarias en criaderos de culícidos. Pol Cap Roberto Fleites 2009-2010. REDVET 13 (05B).
-
Beck Johnson LM, Nelson WA, Paaijmans KP, Read AF, Thomas MB, et al. (2013) The effect of temperature on Anopheles mosquito population dynamics and the potential for Malaria transmission. PLoS ONE 8(11): e79276.
-
Fimia DR, Iannacone J, Roche FD, Cruz CL, López GE (2014) Epidemiological risk and zoonotic diseases in urban communities from the municipality of Santa Clara, Cuba. The Biologist (Lima) 12: 225-239.
-
Mackenzie JS, Gubler DJ, Petersen LR (2005) Emerging Flavivirus: the spread and resurgence of Japanese encephalitis, West Nile and Dengue virus. Journal of the American Mosquito Control Association 10(S12): S98- 109.
-
Pupo AM, Cabrera V, Vázquez Y, Drebor M, Andonova M, et al. (2011) Estudio serológico en localidades con infecciones confirmadas al virus del Nilo Occidental. Rev Cubana Med Trop 63: 227-230.
-
Telle O, Vaguet A, Yadav NK, Lefebvre B (2016) The spread of dengue in an endemic urban milieu-the case of Delhi, India. PLoS One 11: e0146539.
-
Marquetti FM (2006) Aspectos bioecológicos de importancia para el control de Aedes aegypti y otros culícidos en el ecosistema urbano. Ciudad de La Habana. Instituto de Medicina Tropical «Pedro Kourí» (IPK). pp: 1-186.
- Natural Decline to Extinction of A New Zealand Rabbit Population
- Mitochondrial Bio-Logistics: Steering Co-Enzyme Q10 and Lycopene Synergies within the Science 4.0 Bio-OS Framework
- Hymenoptera Specimens from the Caño Negro Wetland, of the National Museum Collection, Costa Rica
- Science 4.0: Comprehensive Architecture of the Biological Operating System (Bio-OS) A Framework for Systemic Resilience and Industrialized Bio-Governance
- Rabbit on, or Hare Back? Understanding Climate Change
- Clinical Validation of Science 4.0: Flow Steering and Epigenetic Drift Inversion on a 76-Year-Old Hybrid System