Carbon Sequestration and Carbon Footprint in Some Aquaculture Practices in West Bengal, India
The present investigation on carbon sequestration and carbon footprint in some aquaculture practices in West Bengal, India was conducted from the six fish ponds, two from the Nadia, two from North 24 Parganas, one from Purba Medinipur, and one from Bankura districts of West Bengal. The polyculture consisting rohu, catla, mrigal, silver carp, and grass carp are being practiced by the farmers. Sometimes, they also culture monopia with these carp species. The average culture period was four months, and usually the farmers practices two crops in a year. The farmer from Bankura practices for eleven months culture. The water depth varied from 1.2 to 2.1 m. The fish production varied from 27300 to 35400 kg/ha with an average of 31690±3469kg/ha. The water pH was neutral to alkaline. The other parameters, viz., dissolved oxygen; total alkalinity, total hardness, and ammonium nitrogen were within the optimum range for good aquaculture practices. The pond sediment was slightly acidic. From fertility status point of view, organic carbon was low to medium, available nitrogen was low to medium, and available phosphorus was low. The carbon footprint analysis of these culture systems was done. The inputs used in the culture systems were urea, single super phosphate, mustard oil cake, rice bran with wheat flour, lime and pelleted feed. The carbon equivalent (CE) of the culture systems ranged from 1745 to 13391 kg/ha with an average of 5370±5278 kg/ha. The chance of emission of carbon-di-oxide equivalent (CO2-e) of these culture practices varied from 0.198 to 1.441 kg CO2-e/kg fish with an average of 0.614±0.593 kg CO2-e/kg fish. The carbon sequestration in the sediments of these fish ponds ranged from 12960 to 54000 kg/ha/yr with an average of 25044±15357 kg/ha/yr. The carbon sequestration by the sediments of the fish ponds varied from 0.405 to 1.520 kg/kg fish with an average of 0.787±0.434 kg/kg fish.
Introduction
Carbon di-oxide (CO2), the main anthropogenic greenhouse gas, if that releasing into the atmosphere, is responsible for increasing the greenhouse effect leading to global warming. Climate change is caused by the massive increase of GHG (Green House Gases) emission to the atmosphere, for example carbon dioxide, which is caused not only from natural factors but also from human activities (anthropogenic factors) including the burning of fossil fuels and deforestation [1, 2].
With the increase of atmospheric CO2 concentration, considerable attention has been devoted to terrestrial carbon (C) sequestration in soils, forests, and grasslands. The depositional environments (i.e., lakes and impoundments) represent short to long term scale sequestration of atmospheric CO2. Globally, this sequestration of organic C (OC) in the sediments of natural lakes ranges from 30 to 70 Tg C/yr (Tg = teragram = 1012 g = 1 million metric ton) [3, 4, 5].
The burial in impoundments is much larger ranging from 150 to 220 Tg C/yr [6]. These rates of C burials are comparable to the OC storage in the sediments of the global oceans estimated at 120–240 Tg C/yr [7, 8, 9].
Seaweed is potential marine vegetation which can use solar energy for the bio-fixation of concentrated CO2 sources from atmosphere into biomass that can be used to produce phycocolloid compound [10]. These macroalgae have relatively better capability on carbon sequestration than terrestrial plants [11]. It is reported that among four seaweed variants, such as Kappaphycus alvarezii var. Tambalang and Maumere, K. striatum and Eucheuma denticulatum, E_. _denticulatum has the highest rate of C sequestration rate based on maximum values which range about 16.08–68.43 ton C/ha/year; while other variants have relatively similar values [12].
The annual magnitude of OC stored in lakes and reservoirs is also comparable to the delivery of OC by rivers to the ocean, about 400 Tg C/yr [13, 14, 15]. However, these rates of OC sequestration in lakes and agricultural impoundments are modest compared to the current total storage of OC terrestrially which ranges from 1000 to 4000 Tg C/yr [16].
Wetlands also accumulate significant amounts of C in their soils, compared to adjacent upland sites [17, 18]. Strategies to reduce C and other greenhouse gas (GHG) emissions from agriculture and enhance C sinks on farms/ wetlands have also been identified [19, 20, 21, 22], but options for different aquaculture farming systems have not been widely assessed. There is 11.1 million hectare (Mha) of aquaculture ponds globally [23]. Manures, fertilizers, feed and other agricultural wastes are applied to ponds for higher production, and these inputs stimulate OC production by phytoplankton photosynthesis in ponds [24]. Aquaculture ponds do not have large external sediment loads like reservoirs or watershed ponds in agricultural or other rural areas. Further, sediments in aquaculture ponds are eroded by rain, waves and water currents generated by mechanical aerators, activities of different culture species, and harvesting operations. Thus, coarse soil particles suspended by internal erosion settle near edge of ponds while smaller particles tend to settle in deeper areas of the ponds [25]. Uneaten feed, organic fertilizers, organic matter (OM) from dead plankton, and excreta from different species settle at pond bottoms, and gradually mix with soil particles.
When ponds are drained for harvest, organic detritus is discharged from the ponds and after draining, pond bottoms are exposed to sunlight for drying which enhance soil aeration and accelerate decomposition of labile OM [26]. Despite these practices in aquaculture ponds, a layer of sediments with a higher OC concentration than that in the original soil develops at the pond bottom [27]. Aquaculture ponds sequester as much as 0.21% of the annual global C emissions of about 10 Pg/yr, and represent a small sink for C which is an important ancillary benefit in considerations of the global C budget [28]. Total technical potential of C sequestration in 0.79 Mha of aquaculture ponds in India ranges from 0.6 to 1.2 Tg C/yr with an average of 0.9 Tg C/yr which is 0.2% of Indian current, annual carbon emission [29]. However, detailed data on C emissions and sequestration by aquaculture ponds are scanty globally, but especially in India. Thus, the present investigation was to assess the potentials of sediments of some polyculture ponds in C sequestration and to analyze the carbon footprint of these aquaculture ponds.
Materials and Methods
Selection of Farmers
In the present investigation, aquaculture practices of six fish farmers were chosen from the four districts, i.e., Nadia; North 24 Parganas; Purba Medinipur; Bankura districts of West Bengal. The sample/site numbers are given in Table 1. In a survey mode and through a questionnaire the fish culture practices from the farmers were known. The farmers cultured different fishes, viz., Labeo rohita (rohu), Catla catla (catla), Cirrhinus mrigala (mrigal), Hypophthalmichthys molitrix (silver carp), Ctenopharyngodon idella (grass carp), and monopia fish as a polyculture practices in their ponds. They used these fishes in different ratios, but the majorities were Indian major carps, viz., rohu, catla and mrigal. The depths of the ponds were 1.2 to 2.1 meters. They prepared their ponds using urea and single super phosphate (SSP) to produce the fish foods i.e. planktons. Then they used pelleted feed, mustard oil cake (MOC), rice bran and wheat flour in 1:1 ratio as fish feed. Once or twice, they used lime in their ponds. The average culture period was 120 d. In this case, they used to get at least two crops in a year. These farmers used to sell small fish in the market in live condition and used to receive good prices. Their fish production levels become very high in a year in such culture practices. Only the farmer of Bankura used to culture the fishes for 330d.
| Sample No. | Area/Location | Pond area (ha) | Culture of species with stocking size (g)and stocking ratio | Stocking density (103/ha) | Surviv ability (%) | Harvesting size (g) |
|---|---|---|---|---|---|---|
| 1 | Garapota, Hanskhali, Nadia | 0.8 | Rohu (5-8,av.6) Mrigal (2-4, av.3) Silver carp (5- 8,av.6) Monopia (2-4, av.3) (30:30:30:10) | 87.5 | 80 | Rohu (300-400,av.350) Mrigal (100-150, av.120) Silver carp (300-400,av.360) Monopia (100-200, av.160) |
| 2 | Garapota, Hanskhali, Nadia | 4.66 | Rohu (25-35,av.30) Catla (35-45, av.40) Mrigal (10-20, av.15) Grass carp (35- 45,av.40) Monopia (7-10, av.8) (30:30:20:10:10) | 45.5 | 80 | Rohu (400-500,av.450) Catla (500-800, av.650) Mrigal (200-250, av.200) Grass carp (500-700,av.600) Monopia (100-200, av.150) |
| 3 | Hathkhola, Gobardanga, Ichapur, North 24 Parganas | 0.4 | Rohu (45-55,av.50) Mrigal (15-25, av.20) Silver carp (20-35, av.30) Grass carp (25-35,av.30) Rohu (35-45, av.40) (30:30:30:10) | 75 | 80 | Rohu (300-400,av.350) Mrigal (15-25, av.150) Silver carp (220-280, av.250) Grass carp (200-300,av.250) |
| 4 | Kadambagachhi, Chowgachha Road,Narayanpur, North 24 Parganas | 0.8 | Catla (45-55, av.50) Mrigal (25-35, av.30) Monopia (7- 15, av.10) (30:30:30:10) | 62.5 | 80 | Rohu (300-400,av.350) Catla (400-500, av.450) Mrigal (150- 250, av.200) Monopia (75-125, av.100) |
| 5 | Tamluk, Purba Medinipur | 4.26 | Rohu (65-75,av.70) Catla (140-160, av.150) Mrigal (65-75, av.70) Silver carp (90-120,av.100) Grass carp (90-110,av.100) (30:30:20:10:10) | 37.5 | 90 | Rohu (500-600,av.550) Catla (600-800, av.700) Mrigal (500-600, av.550) Silver carp (600-700,av.650) Grass carp (600-700,av.650) |
| 6 | Maheshpur, Indpur, Bankura | 3.33 | Rohu (60-70,av.65) Catla (100-120, av.110) Mrigal (60-70, av.65) Silver carp (80-90,av.85) Grass carp (90-110,av.100) (30:30:20:10:10) | 33 | 90 | Rohu (1000-1500,av.1250) Catla (1000-2000, av.1500) Mrigal (800-1200, av.1000) Silver carp (1000- 1500,av.1250) Grass carp (1000-1500,av.1250) |
Table 1: Culture practices in the ponds in different places of West Bengal.
Sample Collection
The water and sediment samples were collected from these ponds. The water and sediment samples were collected from several locations of each fish pond and then composite samples were prepared for the respective fish ponds. The water samples were directly analyzed in the laboratory while the composite sediment samples were dried in the air and powdered with a wooden hammer, strained through a 2 mm and then an 80 mesh sieve respectively.
Methodology for Sample Analysis
The different parameters were measured as follows: Water and Soil analysis: The pH of water samples were measured using a pH meter. The electrical conductance of the water was measured using a conductivity meter. The dissolved oxygen was fixed at the site of the ponds using manganous sulfate and alkaline iodide azide solution. In the laboratory, the precipitate was dissolved using sulfuric acid and then titrated with standard sodium thio sulfate solution using starch as an indicator. Total alkalinity was measured by titration with standard sulfuric acid using methyl orange as an indicator. Total hardness was measured by titration with standard EDTA solution using ammoniumhydroxide- ammonium chloride buffer solution and Erichrome Black-T indicator. The ammonium-nitrogen was estimated using Nessler’s reagent. All these parameters were analyzed following the standard procedures [30].
The sediment pH or sediment reaction of each sample was measured with the help of glass electrode pH meter having glass and calomel electrodes by maintaining the sediment water ratio was 1:2.5 (sediment : water) [31]. The instrument was calibrated using standard buffer solution and temperature regulator was used for fixing the instrument at room temperature before taking the measurement of pH of sediment. In the same sediment water, more water was added to it to make the sediment water ratio was 1:5 and the conductivity was measured using a conductivity meter. Available nitrogen of the sediment was estimated by alkaline potassium permanganate method [32]. Available phosphorus of the sediment was estimated by Bray No. 1 extracting solution (ammonium fluoride and hydrochloride acid) [33].
• Carbon footprint analysis Carbon footprint analysis was done using the carbon content of different inputs as follows: The pelleted feed used in the fish culture contained 46–48% C (on dry weight basis). The mustard oil cake, rice bran, and wheat flour contained 28, 32, and 30% C, respectively. The carbon equivalent (CE) of urea, SSP, and lime were 1.35/kg fertilizer nutrient, 0.20/ kg fertilizer nutrient, and 0.16/kg, respectively [34].
• Carbon sequestration analysis Soil carbon sequestration was measured by CORE Method. In this method, sediment samples from the pond was collected by a soil sampler (Corer) in such a way that only the sediment core was collected, no bottom soil below the sediment was collected. The sediment depth was estimated directly from the pond while collecting the sediment samples.
Wet sediment samples were weighed, a measured quantity dried for 24 h at 105 °C, cooled in desiccators, and weighed again for dry bulk density estimation [35]. A part of sediment samples were air dried, pulverized to pass a 0.25-mm screen and analyzed for OC using dichromate oxidation technique by rapid titration method [36]. The carbon sequestration rate (kg C/ha) was calculated [19] as follows = [OC (%)*dry bulk density (g/cm3)*depth (m)*104 m2]/100.
Results and Discussion
The fish culture practices in the different aquaculture ponds of Nadia, North 24 Parganas, East Medinipur, and Bankura districts of West Bengal are presented in Table 1. The pond area varied from 0.40 to 4.66 ha. The water depth of the pond ranged from 1.2 to 2.1 meters. The different fish species were cultured in these ponds. The stocking density and stocking size varied widely in these ponds. The stocking density varied from 33x103 to 87.5x10³/ha. In general, the small size fish were stocked in more numbers than the bigger size fish. The range of stocking size of the different fish, viz., rohu, catla, mrigal, silver carp, grass carp, and monopia varied from 6 to 65, 40 to 150, 3 to 70, 6 to 100, 30 to 100, and 3 to 10 g, respectively. The survivability of the fish ranged from 80 to 90 per cent. The culture period varied from 120 to 330 days. The average harvested size of the different fish, viz., rohu, catla, mrigal, silver carp, grass carp, and monopia ranged from 350 to 1250, 450 to 1500, 120 to 1000, 250 to 1250, 250 to 1250, and 100 to 160 g, respectively.
The farmers used these fishes in different ratios, but the majorities were Indian major carps, viz., rohu, catla and mrigal. They prepared their ponds using urea and single super phosphate (SSP) to produce the fish foods i.e. planktons. Then they used pelleted feed, mustard oil cake (MOC), rice bran and wheat flour in 1:1 ratio as fish feed. Once or twice, they used lime in their ponds. The average culture period was 120d. In this case, they used to get at least two crops in a year. These farmers used to sell small fish in the market in live condition and used to receive good prices. Their fish production levels become very high in a year in such culture practices. Only the farmer of Bankura used to culture the fishes for 330 d.
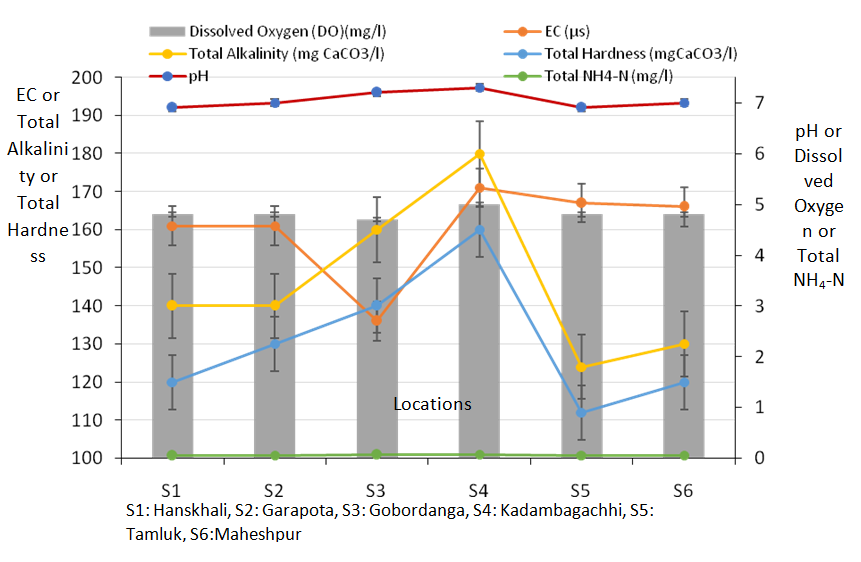
The physico-chemical properties of the pond water of different districts of West Bengal are given in Figure 1. The pH of the water varied from 6.9 to 7.3 with an average of 7.05±0.16, while the electrical conductivity ranged from 136 to 171µs/m with an average of 160±12 µs/m. The dissolved oxygen varied from 4.7 to 5.0 mg/l with a mean of 4.8±0.09 mg/l in these ponds. The total alkalinity of the water varied from 124 to 180 mg CaCO3/l with an average of 145±20 mg CaCO3/l and the total hardness ranged from 112 to 160 mg CaCO3/l with a mean of 130±17 mg CaCO3/l in the water of these ponds. The total ammonium-nitrogen of these pond waters varied from 0.05 to 0.08 mg/l with an average of 0.06±0.01 mg/l.
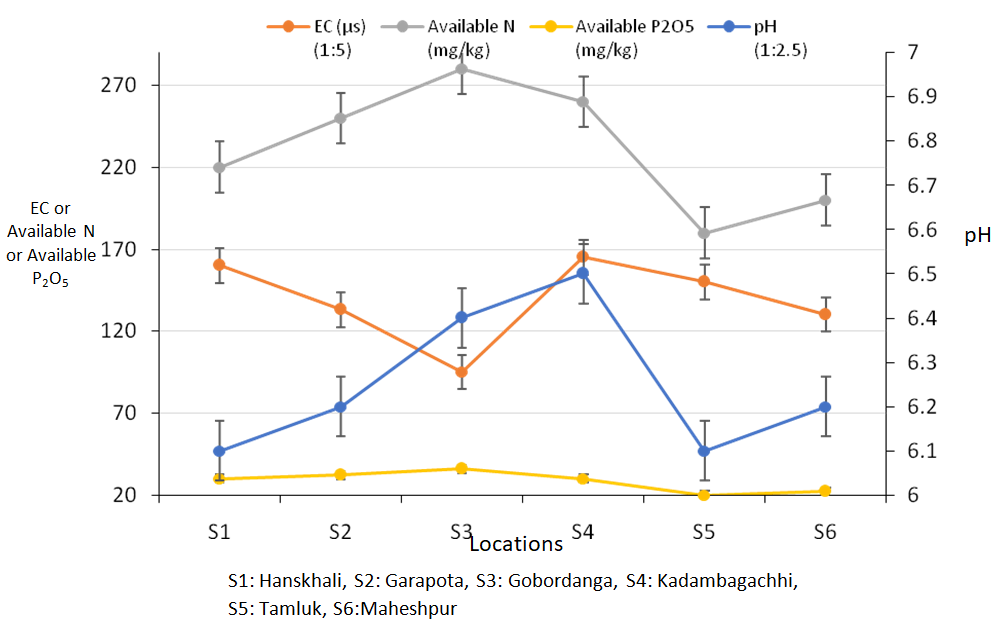
Some physico-chemical properties of the pond sediment of different districts of West Bengal are given in Figure 2. The pH of the sediments varied from 6.1 to 6.5 with an average of 6.25±0.16, while the electrical conductivity ranged from 95 to165 µs/m with an average of 138±25 µs/m. The available nitrogen and available phosphorus varied from 180 to 280 mg/kg with an average of 231±38 mg/kg and from 20 to 36 mg/kg with an average of 28±6 mg/kg, respectively.
Maintenance of a healthy aquatic environment and production of sufficient fish food organisms in ponds are two factors of primary importance for successful pond cultural operations. To keep the aquatic habitat favorable for existence, physical and chemical factors like temperature, turbidity, color, odor, pH, dissolved gases like oxygen, carbon dioxide and also reducing gases like hydrogen sulfide, methane working lethal on fish life, will exercise their influence individually or synergistically, while the nutrient status of water and soil play the most important role in governing the production of plankton organisms or primary production in fish ponds. Rating of fish ponds on the basis of these factors is a difficult problem because of the complexities influencing and governing these factors and also for the fact that it is not possible to study the effect of any individual factor under uniform optimal conditions [37].
In the present study, the water quality is very much congenial for the fish culture. The soil quality is also good for aquaculture practices. However, the bottom sediments were low to medium in available nitrogen, and low in available phosphorus. Hence, the farmers used urea and single super phosphate as fertilizers to produce planktons in the ponds. Moreover, the uneaten feed, and other feeding materials, like mustard oil cake, rice bran, and wheat flour sometimes helps in plankton production, if the nutrient ratios become proper in the water and sediment. Otherwise, the uneaten feed may create problem in the pond environment. The farmers also apply lime to make the pond environment good for fish culture practices, and it also helps to counteract the acidity develops in the ponds by the different fertilizers and feeding materials.
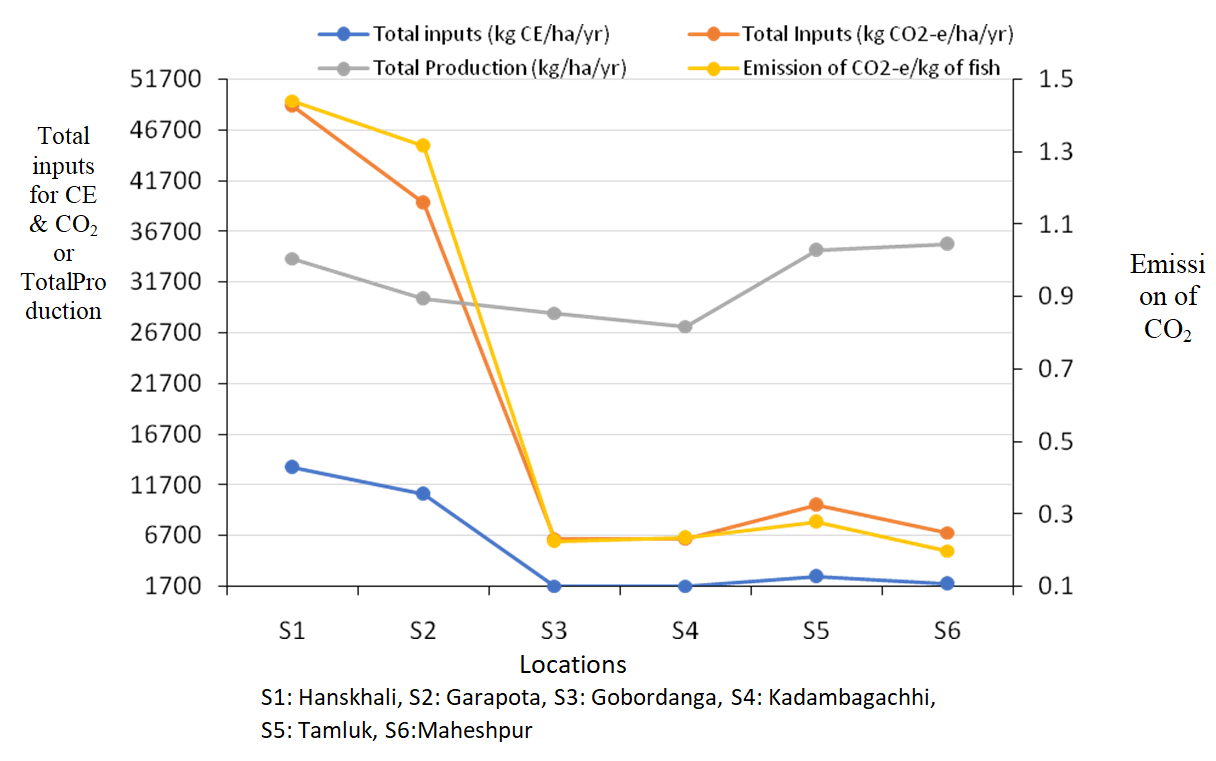
The carbon footprint of aquaculture ponds of different districts of West Bengal are shown in Figure 3. The fish production varied from 27300 to 35400 kg/ha with an average of 31690±3469kg/ha, while the inputs required for the culture of fishes as carbon equivalent (CE) ranged from 1745 to 13391 kg/ha with an average of 5370±5278 kg/ ha. The chance of emission of carbon-di-oxide equivalent (CO2-e) of these culture practices ranged from 0.198 to 1.441 kg CO2-e/kg fish with an average of 0.614±0.593 kg CO2-e/ kg fish.
It was reported that approximately 1,683 kg carbon dioxide/ha were released during the whole river prawn grow out cycle which was corresponded to 459.58 kg of carbon equivalent [38]. They also reported that total carbon di-oxide emission was 5.04 to 11.04 kg/ha/day while total methane emission was 0.21 to 0.50 kg/ha/day during grow out cycle of river prawn. They measured these emissions using diffusion chamber and canvas funnel with a submerged flask and measure the gases using specific gas-chromatic analysis. It was reported that 875 kg CO2-e/ha/yr and 0.21 kg CO2-e/kg fish will be emitted in a year for the production of 4000 kg fish in carp culture practices [39]. It was also reported about the carbon (C) footprint of different aquaculture production systems in India [40]. The total input (kg CE/ ha) in different cultures, respectively, was 1,811 to 4,144 for scampi, 4,417 to 5,913 for poly-culture, 4,090 to 8,873 for shrimp and 2,417 to 2,786 for carp. Of the total inputs, feed accounts for around 90% of carbon equivalent (CE), in all cultures. The output in different cultures, expressed on live weight basis (kg/ha) and on input basis (kg/kg), respectively, was 1,280 to 3,288 and 0.71 to 0.79 for scampi culture, 4,639 to 5,998 and 1.00 to 1.05 for poly-culture, 2,130 to 5,436 and 0.52 to 0.61 for shrimp culture, 4,100 to 4,160 and 1.49 to 1.70 for carp culture. On the basis of output: input ratio, the carp (three species of Indian major carp) culture was more sustainable followed by poly-culture (carp with scampi), scampi and shrimp culture, respectively. It was reported through life cycle analysis (LCA) that the average emissions from cradle to harvesting including the land use change were 2.12 kg CO2-e/kg Indian major carps in India, 1.81 kg CO2-e/ kg Nile tilapia in Bangladesh and 1.61 kg CO2-e/kg stripped catfish in Viet Nam, respectively [41].
However, in the present study, the chance of gas emission was lower because the inputs used only for the culture ponds have been considered. The chance of emission for the production of stocking size fish, ponds construction, filling of water in the pond have not been considered in the present study.
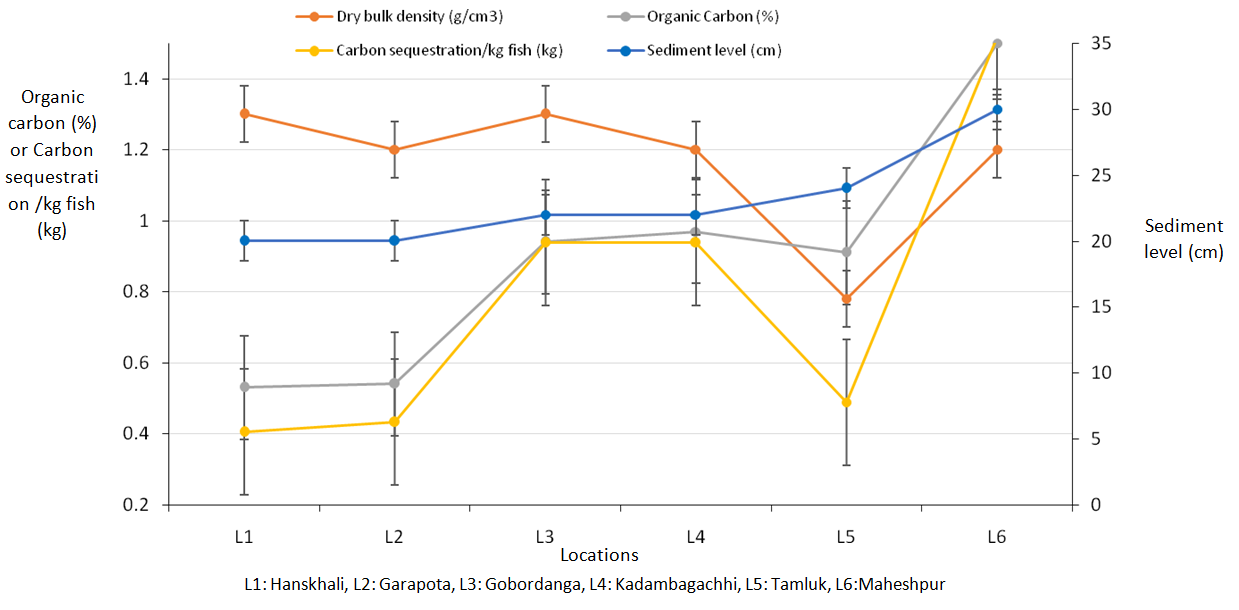
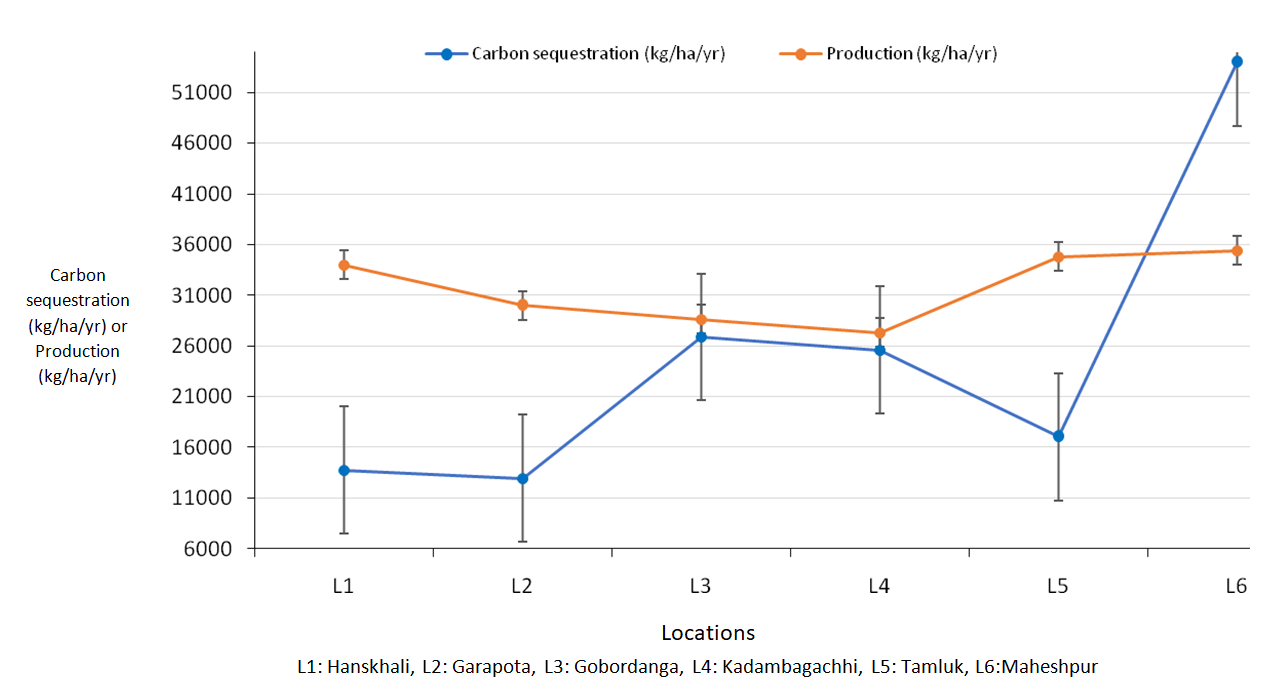
The sediment carbon storage of aquaculture ponds of different places of West Bengal are presented in Figure 4 & 5. The sediment level of these fish ponds varied from 20 to 30 cm with a mean of 23±3.74 cm. The dry bulk density of the pond sediments ranged from 0.78 to 1.30 g/cm3 with an average of 1.16±0.19 g/cm3. The organic carbon of these pond sediments varied from 0.53 to 1.50 per cent with an average of 0.89±0.35 per cent. The carbon sequestration in the sediments of these fish ponds ranged from 12960 to54000 kg/ha/yr with an average of 25044±15357 kg/ha/ yr. The carbon sequestration by the sediments of the fish ponds varied from 0.405 to 1.520 kg/kg fish with an average of 0.787±0.434 kg/kg fish.
The estimated, average annual C sequestration rate for aquaculture ponds monitored in the present study is lower than that of agricultural impoundments and large river reservoirs, but higher than that of natural lakes and inland seas [29]. Aquaculture ponds sequester less C than that by large reservoirs (160–280 Tg/yr) [3], and agricultural impoundments (163 Tg/yr) [42]. The aquaculture ponds sequester C at a lower rate than agricultural impoundments and large reservoirs because of lower input of external sediment and associated organic matter (OM) to aquaculture ponds than in other impoundments [28]. Moreover, aquaculture pond management minimizes OM accumulation. For example, ponds are dried at least once in three years to reduce the gaseous emissions from the bottom and also to flush out sediments by using pressurized water. This intervention is needed because a thick layer of the sediment reduces the productivity of the pond. Though aquaculture ponds sequester comparatively small amount of C, globally pond farming systems under different management practices could sequester a large amount in the long term.
From the present investigation, it is evident that aquaculture ponds could play a vital role to counteract the emission of greenhouse gases from the aquaculture practices by sequestering carbon in the sediments. Even if sometimes, the bottom sediments could remove from the pond to enhance the productivity, there will be every possibility of carbon sequestration by the bottom sediments, and it will not be able to come out in the atmosphere. Thus, more study is needed in this respect to generate more data so that carbon neutral aquaculture practices can be achieved.
References
-
Maslin M (2004) Global Warming: A Very Short Introduction_._ New York: Oxford University Press Inc.
-
IPCC (2007) “Summary for Policymakers.” In Climate Change 2007: The Physical Science Basis. Contribution of Working Group I to the Fourth Assessment Report of the Intergovernmental Panel on Climate Change, edited by Solomon S, Qin,D, Manning M, Chen Z, Marquis M, Averyt KB, Tignor M, and Miller HL Cambridge: Cambridge University Press.
-
Dean WE, Gorham E (1998) Magnitude and significance of carbon burial in lakes, reservoirs, and peat lands. Geology 26(6): 535-538.
-
Einsele G, Yan J, Hinderer M (2001) Atmospheric carbon burial in modern lake basins and its significance for the global carbon budget. Global Planet Change 30(3-4): 167-195.
-
Mullholland PJ, Elwood JW (1982) The role of lake and reservoir sediments as sinks in the perturbed global carbon cycle. Tellus 34(5): 490-499.
-
Stallard RF (1998) Terrestrial sedimentation and the C cycle: coupling weathering and erosion to carbon storage. Global Biogeochem. Cycles 12(2): 231-237.
-
Van Oost K, Quine TA, Govers G, De Gryze S, Six J, et al. (2007) The impact of agricultural soil erosion on the global carbon cycle. Science 318(5850): 626-629.
-
Duarte C., Middelburg JJ, Caraco N (2004). Major role of marine vegetation on the oceanic carbon cycle. Biogeosci Discuss 1: 659-679.
-
Sundquist ET (2003) The global carbon dioxide budget. Science 259: 934-935.
-
Kaladharan P, Veena S, Vivekanandan E (2009) Carbon Sequestration by a Few Marine Algae: Observation and Projection. Journal of the Marine Biological Association of India 51(1): 107-110.
-
Chung IK, Beardall J, Mehta S, Sahoo D, Stojkovic S (2011). Using Marine Macroalgae for Carbon Sequestration: A Critical Appraisal. J Appl Phycol 23: 877-886.
-
Erlania, Radiarta IN (2015) The use of seaweeds aquaculture for carbon sequestration: A strategy for climate change mitigation. Journal of Geodesy and Geomatics Engineering 2(2015): 109-115.
-
Meybeck M (1993) Riverine transport of atmospheric carbon: Sources, global typol-ogy and budget. Water Air Soil Pollut 70: 443-463.
-
Lal R (2003) Soil erosion and the global carbon budget. Environ Int 29(4): 437-450.
-
Probst JL (2002) The role of continental erosion and river transports in the global carbon cycle. Geochim. Cosmochim. Acta 69: A725-A2005.
-
Randerson JR, Chapin FS, Harden JW, Neff JC, Harmon ME (2002) Net ecosys-tem production: a comprehensive measure of net carbon accumulation by ecosystems. Ecol Appl 12(4): 93-947.
-
Bernal B, Mitsch WJ (2008) A comparison of soil carbon pools and profiles in wetlands in Costa Rica and Ohio. Ecol Eng 34(4): 311-323.
-
Nag SK, Nand SK, Roy K, Sarkar U, Das BK (2019) Carbon balance of a sewage-fed aquaculture wetland. Wetlands Ecology and Management 27: 311-322.
-
Lal R, Kimble JM, Follet RF, Cole CV (1998) The potential of US cropland to sequester carbon and mitigate the greenhouse effect. Chelsea: Ann Arbor Press 1: 128.
-
Robertson GP, Paul EA, Harwood RR (2000) Greenhouse gases intensive agriculture: contributions of individual gases to radiative warming of the atmosphere. Science 289(5486): 1922-1925.
-
Mitsch WJ, Tejada J, Nahlik AM, Kolmann B, Bernal B, et al. (2008) Tropical wetlands for climate change research, water quality management and conservation education on a university campus in Costa Rica. Ecol Eng 34(4): 276 -288.
-
Li Y, Wang L, Zhang W, Zhang S, Wang H, et al. (2010) Variability of soil carbon sequestration capability and microbial activity of different types of salt marsh soils at Chongming Dingtan. Ecol Eng 36(12): 175-1760.
-
Verdegem MCJ, Bosma RH (2009) Water withdrawal for brackish and inland aquaculture, and options to produce more fish in ponds with present water use. Water Policy 11: 52-68.
-
Boyd C, Tucker CS (1998) Pond Aquaculture Water Quality Management. Kluwer, Boston.
-
Boyd CE (1995) Bottom Soils, Sediment, and Pond Aquaculture. Chapman and Hall, New York.
-
Ayub M, Boyd CE, Teichert-Coddington D (1993) Effects of urea application, aeration, and drying on total carbon concentrations in pond bottom soils. Prog. Fish Cult 55: 210-213.
-
Munsiri P, Boyd CE, Hajek BF (1995) Physical and chemical characteristics of bottom soil profiles in ponds at Auburn, Alabama, USA, and a proposed method for describing pond soil horizons. J. World Aqua. Soc 26(4): 346-377.
-
Boyd C, Wood CW, Chaney PL, Queiroz JF (2010) Role of aquaculture pond sediments in sequestration of annual global carbon emissions. Environ Pollut 158(8): 2537- 2540.
-
Adhikari S, Lal R, Sahu BC (2012) Carbon sequestration in the bottom sediments of aquaculture ponds of Orissa, India. Ecological Engineering 47: 198-202.
-
APHA (1998) Standard methods for the examination of water and wastewater, 20th edn. American Public Health Association, Washington DC.
-
JacksonML (1973). Soil chemical Analysis. Prentice Hall of Englewood cliffs New Jersey, USA.
-
Subbiah BV, Asija GL (1956) A rapid procedure for the estimation of available nitrogen in soils. Current Sci 25: 259.
-
Bray RH, Kurtz LT (1945) Determination of total, organic, and available forms of phosphorus in soils. Soil Science 59(1): 39-46.
-
Lal R (2004). Carbon emission from farm operations. Environ Int 30(70): 981-990.
-
Doran JW, Mielke LN (1984) A rapid, low-cost method for determination of soil bulk density. Soil Science Society of America Journal 48(4): 717-719.
-
Walkley AJ, Black IA (1934) Estimation of soil organic carbon by the chromic acid titration method. Soil Sci 37: 29-38.
-
Banerjea SM (1967) Water Quality and Soil Condition of Fish Pond in Some States of India in Relation to Fish Production. Indian Journal of Fish 14(1): 115-144.
-
Preto BL, Henares MNP, Kimpara JM, Valenti WC. (2015). Greenhouse emissions from aquaculture. Global aquaculture advocate, January-February 2015.
-
Adhikari S (2019) Assessment of greenhouse gas (GHG) mission from aquatic systems. P. 280-282, _In_: Perspectives on climate change & Inland fisheries in India. UK Sarkar, BK Das, Mishal P, G.Karnatak (Eds.) ICAR-CIFRI, Barrackpore, pp: 312.
-
Adhikari S, Lal R, Sahu BC (2013) Carbon footprint of aquaculture in eastern India. Journal of Water and Climate Change 4(4): 410-421.
-
Robb DHF, MacLeod M, Hasan MR, Sot D (2017) Greenhouse gas emissions from aquaculture: a life cycle assessment of three Asian Systems. FAO Fisheries and Aquaculture Technical Paper No. 609, Rome, FAO 1-110.
-
Downing JA, Cole JJ, Middelburg JJ, Striegl RG, Durante CM, et al. (2008) Sediment organic carbon burial in agriculturally eutrophic impoundments over the last century. Global Biogeochem Cycles 22(1): 1-10.
- Natural Decline to Extinction of A New Zealand Rabbit Population
- Mitochondrial Bio-Logistics: Steering Co-Enzyme Q10 and Lycopene Synergies within the Science 4.0 Bio-OS Framework
- Hymenoptera Specimens from the Caño Negro Wetland, of the National Museum Collection, Costa Rica
- Science 4.0: Comprehensive Architecture of the Biological Operating System (Bio-OS) A Framework for Systemic Resilience and Industrialized Bio-Governance
- Rabbit on, or Hare Back? Understanding Climate Change
- Clinical Validation of Science 4.0: Flow Steering and Epigenetic Drift Inversion on a 76-Year-Old Hybrid System