Glyphosate Alters Redox Balance and Induces Histomorphological Alterations in the Testes of Fruit-Eating Bats (Artibeus lituratus)
We investigate the effects of Glyphosate (GLY) on the testes of fruit-eating bats (Artibeus lituratus). Our study aimed to evaluate the effects of short-time exposure to GLY herbicide on adult male bats testes. Adult male bats were exposed for three days: Control (fed fresh fruits) and GLY (fed 4 mL / 100 mL GLY-pulverized fruit). Animals fed with contaminated fruits showed a reduction in body mass. Antioxidant enzyme catalase (CAT) activity and carbonylated protein (PCN) levels increased in the teste’s GLY-exposed bats. Histomorphometry revealed an increase in the luminal parameters as well as in the epithelium tubule ratio, which is indicative of a reduction in epithelium area. There was also an increase in the percentage of macrophages and a decrease in the percentage and number of Leydig cells. The results indicate that short term exposure to GLY in frugivorous bats may cause oxidative stress of the tissue that possibly induces testicular morphological changes that may compromise the reproduction and maintenance of the species.
Introduction
Among the various herbicide groups, Glyphosate (GLY) has been used for over 40 years [1] and is currently most used worldwide [2]. Like ammonium or sodium salt, GLY is an organophosphate that is still cited as medially toxic, however there is evidence of its deleterious effects on the environment, wildlife and humans [3, 4, 5]. GLY residues and their metabolite, aminomethyl phosphonic acid, are found in the harvest of young foliage, in farm animals, soil and water [6, 3].
This herbicide is an endocrine disruptor, as it reduces testosterone synthesis, induces germ cell and Sertoli cell apoptosis, inhibits antioxidant defense systems promoting oxidative stress, and has high carcinogenic potential [3, 7, 8, 9]. Male germ cells are more susceptible to free radical action due to the high concentration of polyunsaturated fatty acids present in their cell membranes and their low antioxidant capacity [10]. These characteristics make this tissue more susceptible to oxidative stress, mainly due to the imbalance between the production of reactive oxygen species (ROS), nitrogen (RNS) and antioxidant defenses [11]. Antioxidant defenses may be enzymatic and non-enzymatic [12]. Among the enzymatic we can mention the superoxide dismutase (SOD), catalase (CAT) and Glutathione S-transferase (GST) [12], while the non-enzymatic are vitamins, carotenoids and flavonoids [13].
Despite being one of the most used in the world, there are no studies evaluating the effects of this herbicide on reproduction bats [2]. A recent study found 4505.2 pg/mg of GLY in bat’s hair pool, this pesticide was the most common in the bats among 8 others pesticides-2,4-D, Atrazine, Carbaryl, Clothianidin, Dicamba, Imidacloprid and Thiamethoxam [14]. The dispersal of seeds by fruit-eating animals is a crucial interaction for the dynamics of plant populations and the regeneration of degraded areas [15]. Fruit-eating bats are important seed dispersers participating in the regeneration of forest ecosystems [16]. This fruit-only diet can also make fruit bats such as Artibeus lituratus good indicators of the presence and magnitude of pesticide contamination [17].
Artibeus lituratus is a large bat (Phyllostomidae: Stenodermatinae) found throughout Neotropic [15]. This species forms polygamous groups that shelter in the tree tops. The reproductive period of the species may vary according to geographical distribution. In Brazil, for example, they may have a bimodal polystria pattern, which is characterized by continuous reproduction between seasons [18]. Herbicides and other chemical components can be transported by leaching, runoff, evaporation, erosion and through food, reaching regions far from application areas and impacting non-target organisms such as bats [19]. Changes such as oxidative stress, reduced energy reserves and histopathological changes have been observed in bats exposed to different environmental contaminants, especially testicular, hepatic and metabolic modifications [20, 21, 22, 23]. Based on the above, our study aimed to evaluate the effects of short-time exposure to GLY herbicide on adult male Artibeus lituratus testes.
Material and Methods
Animals
Male adult bats (Artibeus lituratus) (n = 13) were captured with mist nets near the campus of the Federal University of Viçosa (20° 45’S e 42° 52’ W) and identified with the identification key of Brazilian Bats [24]. Adult animals were identified based on the fusion of the epiphyseal cartilage of the fourth finger, at the metacarpal-phalangeal junction, according to Kunz TH, et al. [25].
The animals were housed in individual cages (45 × 22 cm) with temperature and natural light and dark cycles in the University Museum of Zoology João Moojen. The animals passed through three days of acclimatization and were then randomly separated in experimental groups: Control (n=7) received papaya (Carica papaya) in natura; GLY (Roundup Original DI®) (n=6) receiving the fruit contaminated with the commercial GLY formulation (C3H8NO5P) at the concentration of 4% (v/v) diluid in water. This concentration was chosen based on the commercial recommendation for the use of this herbicide. The fruits were sprinkled with GLY-containing syrup and then kept in suitable boxes until the pesticide layer dried. The fruits were then split, weighed and offered (200 g) to the animals, with the bark facing upwards, for 3 days at 6:00 p.m., and water ad libitum was offered. The leftovers were heavy in the morning. After treatment, the animals were weighed and then euthanized by cervical dislocation followed by decapitation. The testes were removed and weighed, the left one being for histomorphometric analyzes and the frozen right (-80ºC) for the evaluation of oxidative stress. The procedure was previously approved by the Brazilian Government (SISBIO, registration nº 55798-1) and Ethics Committee of Animal Use of the Federal University of Viçosa (CEUA/UFV 85/2016).
Analysis of Oxidative Markers and Antioxidant Enzymes
Oxidative Markers: Testes fragments for oxidative analysis were homogenized in 0.1M phosphate buffer, pH 7.4 and centrifuged at 4°C. Malondialdehyde (MDA) production, a lipidic peroxidation marker, were analyzed in the supernatant (homogenate). The homogenate was mixed with thiobarbituric acid and the formation of thiobarbituric acid reactive substance (TBARS) was mensured at 535nm, according to the protocol previously described by Buege JA, et al. (1978) [26]. The protein carbonyls assay was performed through the method based on carbonylation reaction of proteins with 2,4-dinitrophenylhydrazine (DNPH) forming dinitrophenylhydrazone [27]. The content of carbonylated proteins was calculated using the molar extinction coefficient (21 x 1031 mol cm). The results of TBARS and total proteins were normalized according to the total protein levels in the supernatant and expressed in (nmol/mg) of protein [28]. These analysis were measured in a microplate scanning spectrophotometer (Multiskan GO, Thermo Scientific).
Antioxidant Enzymes: The activity of superoxide dismutase (SOD) was determined based on the ability of this enzyme to catalyze the reaction of superoxide (O-2) to hydrogen peroxide, thereby reducing the auto- oxidation rate of pyrogallol [29], the reaction mixture was measured by absorbance at 570 nm in a microplate scanning spectrophotometer. The catalase (CAT) activity was evaluated according to the protocol described by Aebi H, et al. [30] in which the rate of decomposition of H2O2 is measured in 60 seconds. Glutathione S-transferase (GST) activity was assayed through the formation of glutathione-conjugated 2,4-dinitrochlorobenzene (CDNB) [31]. CAT and GST were measured in spectrophotometer (UV-Mini 1240, Shimadzu). The total protein dosage in the homogenates was performed by the method of Lowry [28]. The data were normalized according to the total protein levels in the supernatant and the results were expressed in U CAT/ SOD. The results of GST were expressed in µmol/min/g.
Testicular Histomorphometry
Tubular Histomorphometry: The left testes were fixed in Karnovsky solution (paraformaldehyde 4%, glutaraldehyde 4%, 1:1 in phosphate buffer 0.2 M, pH 7.3) for 24 h and transferred to 70% ethanol. Testicular fragments were dehydrated in a growing series of ethanol and embedded in glycol-methacrylate (Historesin®, Leica). Semi-serial sections (3μm) were made using a rotary microtome (RM 2255, Leica), with a minimum of 40μm between sections, and stained with toluidine blue/sodium borate 1%. Morphometry and stereology were performed using digital images captured with the light microscope (Olympus BX-60®, Tokyo, Japan) connected to a digital camera (Olympus QColor-3®, Tokyo, Japan), and analyzed using the Image-Pro Plus 4.5® software.
Both testes and the tunica albuginea were removed, weighed, and the albuginea weight was subtracted from the total testicle weight, providing the testicular parenchyma weight. The gonadosomatic index (GSI) was calculated by dividing the testicular weight by body weight and multiplied by 100.
The volumetric density of all seminiferous tubule’s components (tunica propria, seminiferous epithelium and lumen) and interstitium was estimated after counting 2,660 intersection points, per animal, in 10 square grids (266 intersections/points each), placed randomly over digital images (200x magnification). The volume of each component was estimated by multiplying its percentage within the testis by the testicular parenchyma volume and dividing the result by 100. Since the mammalian testis density is around 1 [32], its weight was considered as the same as the volume.
The tubule somatic index (TSI) was calculated to quantify the investment in seminiferous tubules in relation to body weight (BW) by the formula TSI = STV/BW × 100, where STV = seminiferous tubule volume [33].
The mean tubular diameter was obtained after measuring 30 random circular seminiferous tubules cross sections from each animal, regardless of the tubular stage (200x magnification). The seminiferous epithelium height was measured in the same tubular sections in which the tubule diameter was obtained (as the mean of two diametrically opposed measurements).
The tubular (STAr), luminal (LAr) and epithelial (EAr) areas were calculated according to the formulas: STAr = TR2, where TR = tubular radius; LAr = LR2, where LR = luminal radius; EAr = STAr – LAr. The tubule epithelium ratio (TER) was calculated by dividing STAr/EAr.
The seminiferous tubules length (STL), in meters, was calculated as described by Morais DB, et al. [34] using the formula STL = STV/πR2, where STV = seminiferous tubule volume, R2= transverse section area of the seminiferous tubule, and R= tubular diameter/2. The STL was divided by the testicular weight in order to calculate the seminiferous tubules length per gram of testis (STL/g).
The stages of the seminiferous epithelium cycle (SEC) were characterized according to the tubular morphology method [35]. The number of each cell type found at Stage 1 of the SEC was estimated by counting their nuclei (germ cell) or nucleoli (Sertoli cell) in 10 random tubular cross sections per animal. Thirty nuclear diameter of each germ cell type and nucleolar diameter of the Sertoli cell were measured for each animal. The results were corrected due to variations in the size of the cells and the section thickness as described by Amann RP [36]. The following indexes were calculated from the corrected numbers of germ and Sertoli cells: spermatogonial mitosis (mitotic index), meiotic index, spermatogenic yield, Sertoli cell index, and the total support capacity of the Sertoli cell [34]. The number of Sertoli cells (NSC) was determined as described by Morais DB, et al. [34], and the obtained results were divided by the testicular weight in order to calculate the number of Sertoli cells per gram of testis (NSC/g).
Intertubular Histomorphometry: One thousand coincident points over the intertubular components were recorded (400x magnification): nucleus and cytoplasm of Leydig cell, blood vessels, lymphatic space, and connective tissue, and the percentages of these components were estimated. The volume of each intertubular component in the testicular parenchyma was calculated by the following formula: (percentage of each component in the testis x gonadal weight) / 100.
The mean diameter of the Leydig cell nucleus was obtained after measuring 30 cells per animal and selecting those with the most spherical nuclei and evident nucleoli. The
nuclear volume was obtained by using the formula 4/3πR3, where R = nuclear diameter/2. The cytoplasmic volume was estimated by multiplying the percentage of cytoplasm by the nuclear volume, divided by the nuclear percentage. The single cell volume was estimated by adding the nuclear and cytoplasmatic volume.
The number of Leydig cells was estimated from the Leydig cell individual volumes and the total volume occupied by these cells in the testicular parenchyma [37]. The result was divided by the gonadal weight to estimate the number of Leydig cells per gram of testis, allowing comparisons between different species. The Leydigo somatic index (LSI), which quantifies the investment in Leydig cells related to body mass, was estimated by dividing the Leydig cell volume in the testicular parenchyma by the body weight and multiplying by 100.
Statistical Analysis
Results were reported as mean + standard error of the mean. Data distribution was determined by the Shapiro-Wilk test. The data were submitted to Student’s t test for multiple comparisons using the program GraphPad Prism (version 6.0, Graph Pad Software Inc., San Diego, CA, USA). Statistical significance was set at p≤ 0.05.
Results
Animals and Food Consumptive
The GLY-treated bats did show increase in weight loss (p=0.0006) (Table 1), but did not show difference in other parameters of consumption.
| Treatments | ||
|---|---|---|
| Control (n=7) | GLY (n=6) | |
| Papaya consumption (g/body mass/day) | 1.47±0.11 | 1.64 ±0.04 |
| Weight (g) preexposure | 66.00±2.91 | 76.50±5.97 |
| Weight (g) postexposure | 65.15±2.81 | 72.34±4.98 |
| Weight loss (%) | 0.85±0.07 | 4.16±0.76* |
| Testis weight (g) | 0.48 ± 0.04 | 0.41 ± 0.07 |
| Albuginea weight (g) | 0.15 ± 0.07 | 0.05 ± 0.01 |
| Parenchyma weight (g) | 0.33 ± 0.09 | 0.36 ± 0.06 |
| Gonadosomatic index (%) | 0.74 ± 0.07 | 0.56 ± 0.08 |
Table 1: Consumption of fruits, body and testis weight from A. lituratus exposed to GLY.
Data are expressed as mean ± SEM. * In the same line indicates difference (p ≤ 0.05). Table 1: Consumption of fruits, body and testis weight from A. lituratus exposed to GLY.
Oxidative Markes and Antioxidante Enzymes
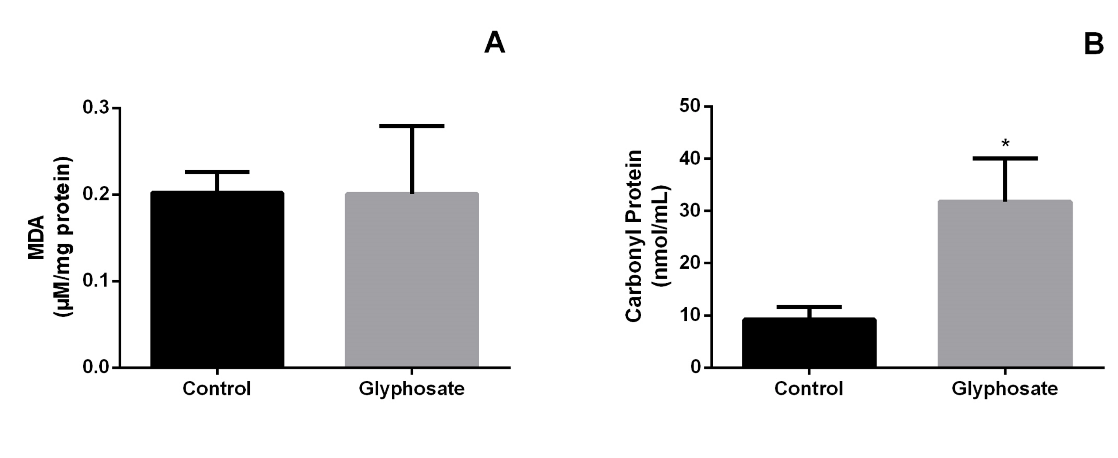
The testicles of GLY-treated bats did show increase in PCN levels (p=0.0158) in the herbicide treated group (Figure
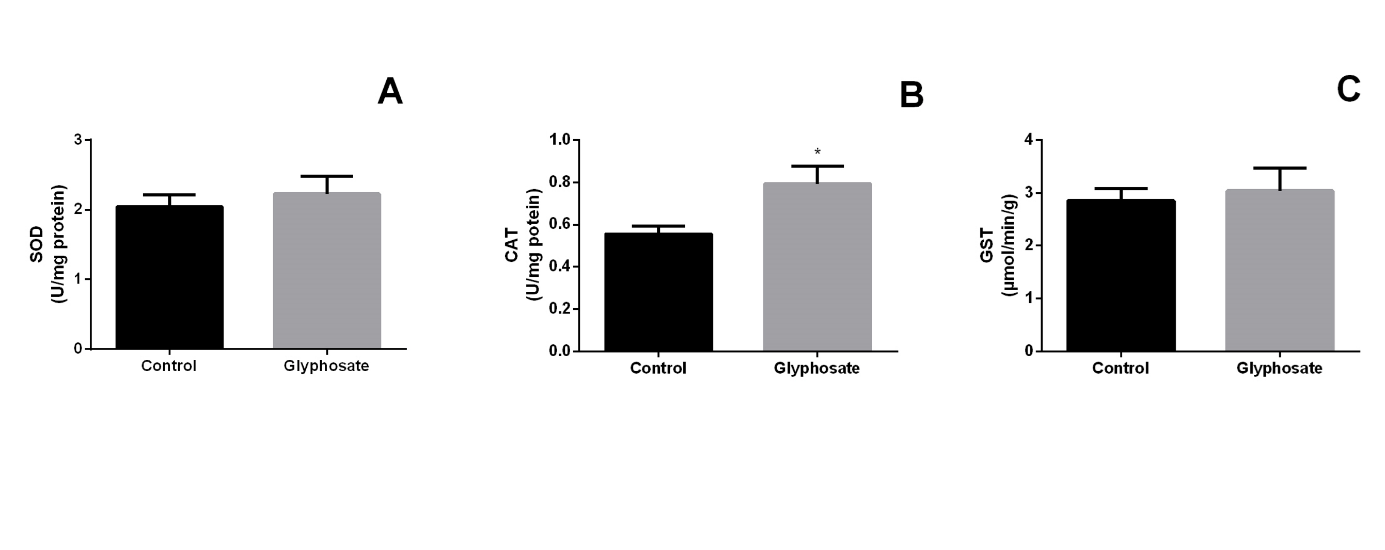
1B) CAT activity (p=0.0255) also increased in herbicide treated group (Figure 2B). The others biomarker did not show difference (Figure 1A, Figure 2A & 2C).
Testicular Histomorphometry
In the morphometric and stereological parameters, the testicles of GLY-treated bats shown increase in percentage of lumen (p=0.0443) and tunica propria (p=0.0013), also in area (p=0.0159) and diameter of lumen (p=0.0159). There was an increase in tubule epithelium ratio (p=0.0159) (Table 2). The others parameters did not show difference.
| Treatments | ||
|---|---|---|
| Control (n=7) | GLY (n=6) | |
| Seminiferous tubule (%) | 91.02 ± 1.05 | 88.73 ± 0.94 |
| Seminiferous epithelium (%) | 79.11 ± 0.88 | 77.59 ± 0.86 |
| Lumen (%) | 3.71 ± 0.98 | 6.59 ± 0.44* |
| Tunica propria (%) | 8.19 ± 0.57 | 4.56 ± 0.29* |
| Intertubular compartment (%) | 8.98 ± 1.05 | 11.27 ± 0.94 |
| Seminiferous tubule volume (mL) | 0.31 ± 0.08 | 0.32 ± 0.05 |
| Seminiferous epithelium volume (mL) | 0.27 ± 0.07 | 0.28 ± 0.04 |
| Lumen volume (mL) | 0.01 ± 0.01 | 0.02 ± 0.01 |
| Tunica propria volume (mL) | 0.03 ± 0.004 | 0.02 ± 0.004 |
| Intertubular compartment volume (mL) | 0.028 ± 0.017 | 0.041 ± 0.021 |
| Tubulessomatic index (%) | 0.47 ± 0.12 | 0.43 ± 0.06 |
| Seminiferous tubules diameter (μm) | 311.05 ± 14.93 | 337.05 ±9.75 |
| Height of seminiferous epithelium (μm) | 125.96 ±7.27 | 118.94 ±4.66 |
| Lumen diameter (μm) | 59.13 ± 4.96 | 99.17 ± 5.25* |
| Seminiferous tubule area (μm2) | 76648.83 ± 7164.50 | 89458.21 ± 5221.10 |
| Lumen area (μm2) | 2822.11 ± 509.90 | 7801.49 ± 791.25* |
| Epithelium area (μm2) | 73826.72 ±70433.19 | 81656.72 ±5046.14 |
| Tubule epithelium ratio | 1.24 ± 0.02 | 1.42 ± 0.03* |
| Seminiferous tubules length (m) | 3.79 ± 0.90 | 3.51 ± 0.42 |
| Seminiferous tubule length/g of testis (m) | 7.82 ± 1.83 | 8.79 ± 0.48 |
| Control (n=7) | GLY (n=6) | |
| Type A Spermatogonia | 3.33 ± 0.83 | 1.79 ± 0.26* |
| Pre-leptotene/leptotene Spermatocytes | 2.97 ± 0.25 | 1.73 ± 0.60* |
| Pachytene Spermatocytes | 11.35 ± 3.00 | 9.85 ± 2.48 |
| Round Spermatids | 18.27 ± 2.19 | 15.03 ± 6.52 |
| Sertoli cell | 58.40 ± 7.96 | 42.01 ± 4.16* |
| Mitotic index (%) | 0.90 ± 0.25 | 0.95 ± 0.24 |
| Meiotic index (%) | 1.64 ± 0.36 | 1.49 ± 0.25 |
| Spermatogenic Yield | 5,64 ± 1,85 | 8,63 ± 4,66 |
| Sertoli cell index (%) | 0.31 ± 0.01 | 0.36 ± 0.14 |
| Total support capacity of the Sertoli cell | 0.61 ± 0.04 | 0.68 ± 0.17 |
| Number of Sertoli cells (x105) | 7.6 ± 4.5 | 4.9 ± 1.7 |
| Number of Sertoli cells per gram of testis (x105) | 21.00 ± 20.00 | 12.00 ± 20.00 |
Table 2: Morphometric and stereological parameters of the testes of A. lituratus exposed to GLY.
Data are expressed as mean ± SEM. * In the same line indicates difference (p ≤ 0.05). Table 2: Morphometric and stereological parameters of the testes of A. lituratus exposed to GLY.
In the number of germ cells per tubule cross section at Stage I, there was a decrease in Type A Spermatogonia, Pre-leptotene/leptotene Spermatocytes (p=0.0687) and Sertoli cells (Table 3). The others parameters did not show difference.
Data are expressed as mean ± SEM. * In the same line indicates difference (p ≤ 0.05). Table 3: Corrected number of germ cells per tubule cross section at Stage I of the seminiferous epithelium cycle, efficiency of spermatogenesis, and Sertoli cell index in A. lituratus exposed to GLY.
Regarding intertubular and leydig cell morphometry, there was an increase in percentage of lymphatic space (p=0.1934), macrophages (p=0.0008), connective tissue volume (p<0.0001) and number of leydig cells per gram of testis (p=0.0147). Also, it was a decrease in percentage of leydig cells (p<0.0001) and lymphatic space volume (p=0.0344) (Table 4). The others parameters did not show difference.
| Treatments | ||
|---|---|---|
| Control (n=7) | GLY (n=6) | |
| Intertubule | ||
| Lymphatic space (%) | 0.220 ± 0.150 | 0.500 ± 0.130* |
| Connective tissue (%) | 1.17 ± 0.12 | 1.01 ± 0.09 |
| Macrophages (%) | 0.31 ± 0.12 | 1.02 ± 0.09* |
| Blood vessels (%) | 0.43 ± 0.08 | 0.32 ± 0.10 |
| Leydig cells (%) | 6.58 ± 0.86 | 1.01 ± 0.9* |
| Lymphatic space volume (mL) | 0.013 ± 0.0005 | 0.006 ± 0.0031* |
| Connective tissue volume (x103 mL) | 0.004 ± 0.0013 | 0.03 ± 0.0031* |
| Macrophages volume (x103 mL) | 0.0009 ± 0.0003 | 0.003 ± 0.0002 |
| Blood vessels volume (mL) | 0.001 ± 0.00003 | 0.0041 ± 0.00005 |
| Leydig cells volume (mL) | 0.002 ± 0.005 | 0.03 ± 0.008 |
| Leydig Morphometry | ||
| Nuclear diameter (μm) | 6.43 ± 0.27 | 6.31 ± 0.11 |
| Nuclear volume (μm3) | 142.01 ± 19.39 | 131.97 ± 6.77 |
| Cytoplasmic volume (μm3) | 441.99 ± 58.80 | 327.63 ± 10.80 |
| Leydig cell volume (μm3) | 584.00 ± 76.97 | 459.60 ± 11.15 |
| Number of Leydig cells (x107) | 4.87 ± 1.58 | 9.76 ± 2.80 |
| Number of Leydig cells per gram of testis (x107) | 9.91 ± 3.09 | 22.33 ± 2.92* |
| Leydigossomatic Index (%) | 0.003 ± 0.009 | 0.006 ± 0.010 |
Table 3: Intertubular and Leydig cell morphometry in A. lituratus exposed to GLY.
Data are expressed as mean ± SEM. * In the same line indicates difference (p ≤ 0.05). Table 4: Intertubular and Leydig cell morphometry in A. lituratus exposed to GLY.
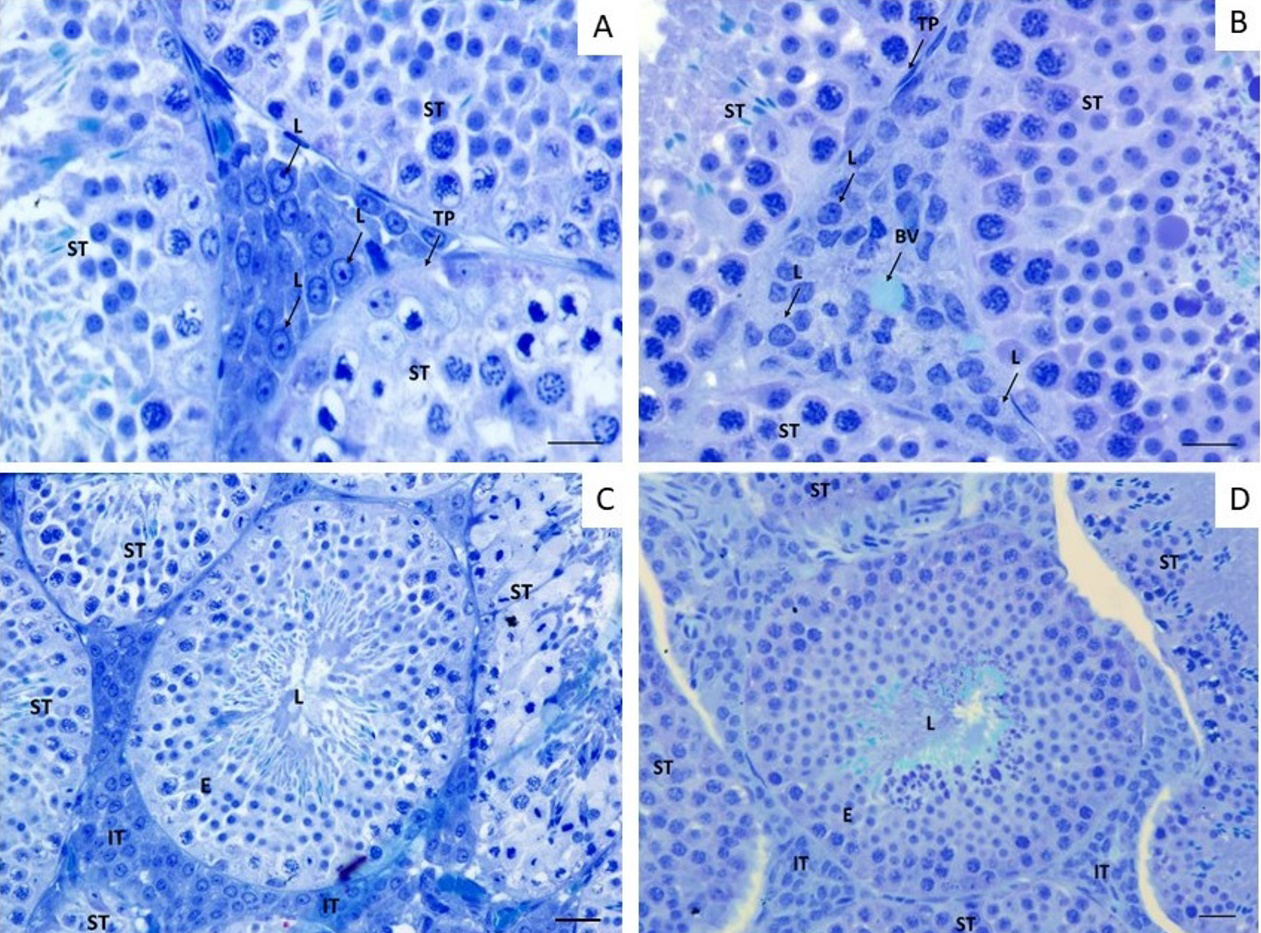
Figure 3: Intertubular and Tubular compartment in A. lituratus testis following 3 days exposure to GLY. a Intertubular compartment of control bats; b Tubular compartment of control bats; c Tubular compartment of bats exposed a 4 mL/ 100 mL of GLY; d Tubular compartment of bats exposed a 4mL / 100 mL of GLY. BV Blood vein; L Leydig Cell, IT Intertubular compartment; TB Tubular compartment; L Lumen; TP Tunica propria; E Epithelium. Toluidine blue. Scale bar = 20 µm.
Discussion
Animals exposed to GLY showed a reduction in final body mass compared to animals in the control group (Table 1). Similar results were found in bats exposed to lindane organochlorine for three days and pyrethroid deltamethrin for seven days [38, 39]. Possibly these findings may be justified by the metabolic stress caused by exposure to pesticides such as organochlorines and organophosphates. In addition, these compounds induce greater consumption of body energy reserves with consequent loss of body mass [40]. In addition to loss in body mass, changes in target organs such as glands, nervous and liver tissue are common [21, 41, 42].
This is because many pesticides cause disturbance in the cognitive and reproductive capacity of mammals due to their characteristic endocrine disruption [43, 44]. In our study, no significant changes in testis weight and gonadosomatic index were observed after pesticide exposure (Table 1), possibly due to short-term exposure which generally promotes microstructural changes in tissues that are macroscopically perceived later.
Regarding the oxidative profile, our findings showed that the testicles of GLY-treated bats did not show changes in MDA levels. However, PCN levels were increased in the herbicide treated groups (Figure 1A & 1B). MDA is the main marker of cell lipid peroxidation, especially membrane triglycerides [45]. High concentrations of this marker indicate that free radicals are acting and promoting lipid oxidation, compromising the cell’s electrolyte balance [45]. Despite the high amount of this marker inside the cell, there was no significant difference between the groups, possibly due to the increase of the antioxidant enzyme CAT that acts by accelerating the passage of electrons and consequently preventing the action of these radicals in cell membranes. As more free radicals and ROS are produced in the tissue, greater the oxidative stress and, consequently, the greater cellular and tissue damage [46]. To try to eliminate these highly reactive compounds, cells increase the expression of antioxidant enzymes to protect tissues from the devastating action of these molecules [47].
However, only the protective action of the CAT enzyme was not sufficient to prevent damage to intra and extracellular proteins in the testicular tissue as the amount of carbonylated proteins (PCN) increased after GLY exposure (Figure 1B). The increase in PCN is directly linked to protein oxidation and consequently its denaturation, compromising important processes within the cell such as gene translation and transcription, as well as altering all cellular metabolism [48]. These findings show the negative effects of GLY on maintaining the redox balance of the cell indicating toxicity and detrimental ability in testicular tissue. Similar results were found by Astiz M, et al. [49] who analyzed the effect of pesticide GLY on liver tissue concentrations 1/50 and 1/250 and observed increased MDA and PCN after exposure compared to animals receiving water alone.
The role of these enzymes is critical in maintaining the redox balance of cells and maintaining their functionality. The enzyme SOD catalyzes the transformation reaction of the superoxide radical (O2 -) into hydrogen peroxide (H2O2) and CAT catalyzes the reaction of transforming H2O2 to water and molecular oxygen, decreasing the oxidizing action of superoxide ion and H2O2, regulating the cellular homeostasis [50]. GST is responsible for the second phase biotransformation, i.e. detoxifying toxic compounds and / or the metabolites produced in the SOD and CAT phase I biotransformation [51]. In our study, CAT enzyme activity was higher in the treated group than in the control group (Figure 2A), protecting against oxidative damage, and the levels of the SOD and GST antioxidant enzymes in the treated group did not differ from control (Figures 2B & 2C), probably due to the short exposure time to the GLY for bats. Possibly the detrimental effect of GLY is associated with fast cell penetrating surfactant compounds which increase the influx of the enzyme lactate dehydrogenase (LDH) and the release of Ca2+. The Ca2+ ions are considered one of the greatest mitochondrial ROS stimulants, so excess of intracellular Ca2+ causes overload and disruption of mitochondrial membranes and decreased synthesis of ATP, altering redox balance, causing disturbances in signaling pathways and consequently cell death in the cells that make up the testicular tissue [52, 53].
Testis of bats exposed to GLY showed changes in histomorphometric parameters (Figure 3). Parameters such as diameter and luminal area increased in pesticide- exposed bats when compared to control (Table 2). Increased lumen may be associated with fluid accumulation following aggression by Sertoli cells. Sertoli cells participate in the formation of the occlusion junctions that make up the blood-testicular barrier, in addition to secreting fluid into the tubular lumen [9]. Although no significant changes in tubule diameter and epithelium height were observed, in the group receiving GLY the tubule diameter was larger and the epithelium height was smaller, resulting in a significant lumen increase. The tubule epithelium ratio (TER) showed a significant increase (Table 2) in animals exposed to GLY. The closer to 1 the value of TER is the greater the area of the seminiferous epithelium. Therefore, GLY treatment resulted in a smaller area of the epithelium in relation to the tubular area, probably due to the endocrine disrupting effect of this herbicide. Similar results were found in rats receiving GLY doses of 5, 50 and 250mg / kg during the prepubertal period. The authors reported increased luminal diameter and reduced germinal epithelium due to the anti-androgenic effect of this herbicide [9].
In the testicles of bats exposed to herbicide there was a reduction in the number of type A spermatogonia, primary pre-leptotene / leptotene spermatocytes and Sertoli cells (Table 3). However, the reduction in cell count of the initial spermatogenic lineage did not change the spermatogenic indices (mitotic, meiotic and general yield) and Sertoli indices evaluated. Probably this reduction is related to the location of these cells in the basal environment of the seminiferous epithelium, below the hematotesticular barrier, being more exposed to xenobiotic contamination. Sertoli cells, when mature, participate in primary spermatocyte proliferation, maintenance of spermatogenic lineage cells, and hematotesticular barrier formation [54]. Similar results were presented by nonylphenol surfactant, a contaminant present in the commercial formulation of GLY, which also drastically altered the morphology of Sertoli cells leading to apoptosis of this cell, in addition to altering the homeostasis of Sertoli Ca2+ and hydroelectrolytic balance in rats [55]. In our study, there were no changes in the most advanced spermatogenesis cell lines or changes in the overall spermatogenic process yield, probably due to the exposure time of only 3 days. Chronic GLY exposure has been shown to promote significant morphological changes in all spermatogenic germ line cells [56]. Based on this and considering that the animal may be exposed to these contaminants daily in its natural habitat, it is believed that the effects of chronic exposure could be more severe and affect all cell lines. Regarding the intertubular parameters, there was an increase in the percentage of macrophages, percentage and volume of lymphatic space and decrease in the percentage and number of Leydig cells per gram of testis in animals exposed to GLY (Table 4). The increase in macrophage percentage may have been the result of a proinflammatory process caused by the increase in GLY-induced EROS. The increase in EROS stimulates the release of proinflammatory by macrophages and may cause a decrease in the proportion of Leydig cells, as observed in our study [57, 58]. The decrease in Leydig cell number also can be associated with possible changes caused by GLY in proteins involved in the cell cycle. GLY exposure is known to inhibit cell cycle check proteins [7]. In general, changes in this group of proteins cause an increase in cell duplication and consequently cell numbers, but decrease their metabolic function [59]. GLY-exposed animals show up to 35% drop in plasma testosterone concentrations [60, 61, 62]. This herbicide can mimic the function of a natural hormone in living things or inhibit the normal activity of the hormone itself [63]. Low testosterone levels promote drop in epithelium height and lumen diameter, directly affecting epididymis, seminal vesicle and maintenance of sperm nutrition. These changes may result in damage to the male reproductive system including malformations and epigenetic changes in future offspring [9, 64].
Conclusion
After evaluating the effects of GLY exposure on Artibeus lituratus fruit-eating bats for three days, there was presence of testicular histomorphometric changes, such as lumen enlargement, reduction of initial spermatogenic cells and Sertoli cells, and percentage increase and Leydig cell number. We believe that these findings are directly linked to the free radical generation capacity of this pesticide and consequently its high damaging power to and cellular proteins. The increase of the oxidative marker PCN accompanied by the increase of the antioxidant enzyme CAT shows that GLY causes testicular oxidative stress. However, further studies, especially dose response, are needed to identify the minimum dose of exposure to this pesticide capable of promoting significant morphological changes during short-term exposure. Thus, it can be concluded that acute exposure to GLY herbicide is enough to induce cellular, morphological and imbalance redox changes in the testicles of fruit-eating bats and, in the long run, may cause damage to the reproduction and maintenance of the species.
References
-
Duke SO (2017) The history and current status of glyphosate. Pest Manag Sci 74(5): 1027-1034.
-
Torquetti CG, Guimarães ATB, Soto-Blanco B (2021) Exposure to pesticides in bats. Sci Total Environ 755(1): 142509.
-
Bruggen Van AH, MM He, Shin K, Mai V, Jeong KC, et al. (2018) Environmental and health effects of the herbicide glyphosate. Sci Total Environ 617: 255-268.
-
Gill JPK, Sethi N, Mohan A, Datta S, Girdhar M, et al. (2018) Glyphosate toxicity for animals. Environ Chem Lett 16: 401-426.
-
Richmond ME (2018) Glyphosate : A review of its global use, environmental impact , and potential health effects on humans and other species. Journal of Environmental Studies and Sciences 50(8): 416-434.
-
Osten JR, Dzul-Caamal R (2017) Glyphosate Residues in Groundwater, Drinking Water and Urine of Subsistence Farmers from Intensive Agriculture Localities : A Survey in Hopelchén, Campeche, Mexico. Environ Res Public Heal 14(6): 595.
-
Marc J, Belle R, Morales J (2004) Formulated Glyphosate Activates the DNA-Response Checkpoint of the Cell Cycle Leading to the Prevention of G2 / M Transition. Toxicol Sci 82(2): 436-442.
-
Sanin L, Carrasquilla G, Solomon KR, Donald CC, Marshell EPJ, et al. (2009) Regional Differences in Time to Pregnancy Among Fertile Women from Five Colombian Regions with Different use of Glyphosate. Journal of Toxicology and Environmental Health, Part A 72(15-16): 949-960.
-
Romano RM, Romano MA, Bernardi MM, Furtado PV, Oliveira CA, et al. (2010) Prepubertal exposure to commercial formulation of the herbicide glyphosate alters testosterone levels and testicular morphology. Reprod Toxicol 84: 309-317.
-
Vernet P, Aitken RJ, Drevet JR (2004) Antioxidant strategies in the epididymis. Mol Cell Endocrinol 216(1- 2): 31-39.
-
Halliwell B, Whiteman M (2004) Measuring reactive species and oxidative damage in vivo and in cell culture: How should you do it and what do the results mean?. Br J Pharmacol 142(2): 231-255.
-
Wu H, Liu Y, Zhang X, Zhang J, Enbo M, et al. (2019) Antioxidant defenses at enzymatic and transcriptional levels in response to acute lead administration in Oxya chinensis. Ecotoxicol Environ Saf 168: 27-34.
-
Avilez IM, Silvestre T, Hori F, Hackbarth A, Moraes G, et al. (2008) Effects of phenol in antioxidant metabolism in matrinxã , Brycon amazonicus (Teleostei ; Characidae). Comp Biochem Physiol Part C 148(2): 136-142.
-
Hooper SE, Amelon SK, Lin CH (2022) Development of an LC-MS/MS Method for Non-Invasive Biomonitoring of Neonicotinoid and Systemic Herbicide Pesticide Residues in Bat Hair. Toxics 10(2): 73.
-
Laurindo RDS, Vizentin-Bugoni J (2020) Diversity of fruits in Artibeus lituratus diet in urban and natural habitats in Brazil: A review. J Trop Ecol 36(2): 65-71.
-
Oliveira JM, Lima GDA, Destro ALF, Condessa S, Freitas MB, et al. (2021) Short-term intake of deltamethrin- contaminated fruit, even at low concentrations, induces testicular damage in fruit-eating bats (Artibeus lituratus). Chemosphere 278: 130423.
-
Valdespino C, Sosa VJ (2017) Effect of landscape tree cover, sex and season on the bioaccumulation of persistent organochlorine pesticides in fruit bats of riparian corridors in eastern Mexico. Chemosphere 175: 373-382.
-
Notini AA, Farias TO, Talamoni SA, Godinho HP (2015) Annual male reproductive activity and stages of the seminiferous epithelium cycle of the large fruit-eating Artibeus lituratus (Chiroptera : Phyllostomidae). Zoologia 32(3): 195-200.
-
Carvalho FP (2017) Pesticides, environment, and food safety. Food Energy Secur 6(2): 48-60.
-
Brinati A, Oliveira JM, Oliveira VS, Mirlaine SB, Mariella BF, et al. (2016) Low, Chronic Exposure to Endosulfan Induces Bioaccumulation and Decreased Carcass Total Fatty Acids in Neotropical Fruit Bats. Bull Environ Contam Toxicol 97: 626-631.
-
Faita MR, Oliveira EDM, Júnior VVA, Afonso IO, Nodari RO, et al. (2018) Changes in hypopharyngeal glands of nurse bees ( Apis mellifera ) induced by pollen-containing sublethal doses of the herbicide. Chemosphere 211: 566-572.
-
Oliveira JM, Destro ALF, Freitas MB, Oliveira LL (2021) How do pesticides affect bats?-a brief review of recent publications. Brazilian J Biol 81(2): 499-507.
-
Machado-Neves M, Neto MJO, Miranda DC, Castro MM, Sertorio MN, et al. (2018) Dietary Exposure to Tebuconazole Affects Testicular and Epididymal Histomorphometry in Frugivorous Bats. Bull Environ Contam Toxicol 101: 197-204.
-
Vizotto LD, Taddei VA (1973) Key for determination of Brazilian Chiroptera. Rev Fac Filos Cien Letr S José R Preto Bolm Cienc.
-
Kunz TH, Anthony EL (1982) Age estimation and post- natal growth in the bat Myotis lucifugus. J Mammal 63(1): 23-32.
-
Buege JA, Aust SD (1978) Microsomal lipid peroxidation. Methods Enzymol 52: 302-310.
-
Levine RL, Garland D, Oliver CN, Amici A, Climent I, et al. (1990) Determination of carbonyl content in oxidatively modified proteins. Methods Enzymol 186: 464-478.
-
Lowry OH, Rosebrough NJ, Farr AL, Randall RJ (1951) Protein measurement with the Folin phenol reagent. J Biol Chem 193(1): 265-275.
-
Dieterich S, Bieligk U, Beulich K, Hasenfuss G, Prestle J, et al. (2000) Gene expression of antioxidative enzymes in the human heart-Increased expression of catalase in the end-stage failing heart. Circulation 101(1): 33-39.
-
Aebi H (1984) Catalase in vitro. Methods Enzymol 105: 121-126.
-
Habig WH, Pabst MJ, Jakoby WB (1974) Glutathione S-Tranferases: The first enzymatic step in mercapturic and formation. J Biol Chem 249(22): 7130-7140.
-
Johnson L, Neaves W (1981) Age-related changes in the Leydig cell population, seminiferous tubules, and sperm production in stallions. Biol Reprod 24(3): 703-712.
-
Balarini MK, Antônio T, Paula R De, Peixoto JV, Czermak AC, et al. (2012) Stages and duration of the cycle of the seminiferous epithelium in oncilla (Leopardus tigrinus, Schreber, 1775). Theriogenology 77(5): 873-880.
-
Morais DB, Cupertino MC, Goulart LS (2013) Histomorphometric evaluation of the molossus molossus (Chiroptera, Molossidae) testis: The tubular compartment and indices of sperm production. Anim Reprod Sci 140(3-4): 268-278.
-
Berndston WE (1977) Methods for Quantifying Mammalian Spermatogenesis: a Review. J Anim Sci 44(5): 818-833.
-
Amann RP, Almquist JO (1962) Reproductive Capacity of Dairy Bulls. VIII. Direct and Indirect Measurement of Testicular Sperm Production. J Dairy Sci 45(6): 774-781.
-
Mori H, Christensen AK (1980) Morphometric analysis of Leydig cells in the normal rat testis. J Cell Biol 84(2): 340-354.
-
Swanepoel RE, Racey PA, Shore RF, Speakman JR (1999) Energetic e € ects of sublethal exposure to lindane on pipistrelle bats (Pipistrellus pipistrellus). Environmental Pollution 104(2): 169-177.
-
Oliveira JM, Losano NF, Condessa SS, Cardoso SA, Freitas MB, et al. (2018) Exposure to deltamethrin induces oxidative stress and decreases of energy reserve in tissues of the Neotropical fruit-eating bat Artibeus lituratus. Ecotoxicol Environ Saf 148: 684-692.
-
Dheyongera G, Grzebyk K, Rudolf AM, Sadowska ET, Koteja P, et al. (2016) The effect of chlorpyrifos on thermogenic capacity of bank voles selected for increased aerobic exercise metabolism. Chemosphere 149: 383-390.
-
Scollon EJ, Starr JM, Crofton KM, Wolansky MJ, DeVito MJ, et al. (2011) Correlation of tissue concentrations of the pyrethroid bifenthrin with neurotoxicity in the rat. Toxicology 290(1): 1-6.
-
Oliveira JM, Brinati A, Miranda LDL, Morais DB, Zanuncio JC, et al. (2017) Exposure to the insecticide endosulfan induces liver morphology alterations and oxidative stress in fruit-eating bats (Artibeus lituratus). Int J Exp Pathol 98(1): 17-25.
-
Bila DM, Dezotti M (2007) Endocrine disruptors in the environment: effects and consequences. Quim Nova 30(3): 651-666.
-
Ewence A, Brescia S, Johnson I, Rumsby PC (2015) An approach to the identification and regulation of endocrine disrupting pesticides. Food Chem Toxicol 78: 214-220.
-
Ayala A, Muñoz MF, Argüelles S (2014) Lipid Peroxidation : Production, Metabolism and Signaling Mechanisms of Malondialdehyde and 4-Hydroxy-2-Nonenal. Oxidative Medicine and Cellular Longevity 2014: 1-31.
-
Bhat AH, Bashir K, Anees S, Masood A, Manzoor AS, et al. (2015) Oxidative stress , mitochondrial dysfunction and neurodegenerative diseases ; a mechanistic insight. Biomed Pharmacother 74: 101-110.
-
Birben E, Sahiner UM, Sackesen C, Erzurum S, Kalayci O, et al. (2012) Oxidative Stress and Antioxidant Defense. World Allergy Organ J 5(1): 9-19.
-
Dalle-Donne I, Aldini G, Carini M, Colombo R, Ranieri R, et al. (2006) Protein carbonylation, cellular dysfunction, and disease progression. J Cell Mol Med 10(2): 389-406.
-
Astiz M, Alaniz MJT De, Marra CA (2009) The impact of simultaneous intoxication with agrochemicals on the antioxidant defense system in rat. Pestic Biochem Physiol 94(2-3): 93-99.
-
Droge W (2002) Free radicals in the physiological control of cell function. Physiol Rev 82(1): 47-95.
-
Oost D, Beyer J, Vermeulen NPE (2003) Fish bioaccumulation and biomarkers in en v ironmental risk assessment : a review. Environ Toxicol Pharmacol 13(2): 57-149.
-
Gehin A, Guyon C, Nicod L (2006) Glyphosate-induced antioxidant imbalance in HaCaT: The protective effect of Vitamins C and E. Environ Toxicol Pharmacol 22(1): 27-34.
-
Cavalli VL, Oliveira DL, Cattani D, Carla Elise HR, Zamoner A, et al. (2013) Roundup disrupts male reproductive functions by triggering calcium-mediated cell death in rat testis and Sertoli cells. Free Radic Biol Med 65: 335- 346.
-
Hess R, Vogl A (2015) Sertoli cell anatomy and cytoskeleton. Sertoli Cell Biology 2015: 1-55.
-
Gong Y, Wu J, Huang Y, Shen S, Xiaodong H, et al. (2009) Nonylphenol induces apoptosis in rat testicular Sertoli cells via endoplasmic reticulum stress. Toxicol Lett 186(2): 84-95.
-
Pham TH, Derian L, Kervarrec C, Jégou B, Smagulova F, et al. (2019) Perinatal Exposure to Glyphosate and a Glyphosate- Based Herbicide Affect Spermatogenesis in Mice. Toxicol Sci 169(1): 260-271.
-
Payne AH, Hardy MP (2007) The Leydig cell in health and disease. Humana Press pp: 1-471.
-
Souza Predes F, Monteiro JC, Matta SLP, Márcia CG, Dolder H, et al. (2011) Testicular Histomorphometry and Ultrastructure of Rats Treated with Cadmium and Ginkgo biloba. Biol Trace Elem Res 140(3): 330-341.
-
Berra CM, Menk CFM, Mascio P Di (2006) Oxidative stress, genome damage and signaling processes in cell cycle control. Quim Nova 29(6): 1340-1344.
-
Romano RM (2008) Exposure to glyphosate-Roundup causes delay in the onset of puberty in male rats. Brazilian Journal of Veterinary Research and Animal Science 45(6): 481-487.
-
Benachour N, Séralini G (2009) Glyphosate Formulations Induce Apoptosis and Necrosis in Human Umbilical, Embryonic, and Placental Cells. Chem Res Toxicol 22(1): 97-105.
-
Clair É, Mesnage R, Travert C, Séralini G-éric (2012) A glyphosate-based herbicide induces necrosis and apoptosis in mature rat testicular cells in vitro, and testosterone decrease at lower levels. Toxicol In Vitro 26(2): 269-279.
-
Johansson HK, Schwartz CL, Nielsen LN, Boberg J, Svingen T, et al. (2018) Exposure to a glyphosate-based herbicide formulation , but not glyphosate alone, has only minor e ff ects on adult rat testis. Reprod Toxicol 82: 25-31.
-
Romano MA, Romano RM, Dalazen L, Bernardi MM, Viau P, et al. (2012) Glyphosate impairs male offspring reproductive development by disrupting gonadotropin expression. Reprod Toxicol 86(4): 663-673.
- California Red-Legged Frog and Non-Listed Amphibians Response to Non-Native Fish Removal
- Industrial Standardization of the Bio-OS: Algorithmic Codification of Resilience Engineering Guidelines and Version V8 Architecture
- Climate Variability and the Sustainability of Snail Farming in Nigeria: Past Trends, Present Challenges and Potential Outlook
- The Evaluation of the Surveillance System of Anthrax in Gilgit-Baltistan, Pakistan, 2018
- Natural Decline to Extinction of A New Zealand Rabbit Population
- Mitochondrial Bio-Logistics: Steering Co-Enzyme Q10 and Lycopene Synergies within the Science 4.0 Bio-OS Framework