Diet Specific Protein Deposition of Black Soldier Fly Larvae
This study investigated the protein deposition efficiency of black soldier fly (BSF) larvae. Five-day-old larvae of BSF were fed with pig feed or coconut meal. First, feed restriction was determined by comparing larval weight, the digested feed conversion efficiency (ECD), and the feed conversion ratio (FCR) of larvae fed with different amount of feed (e.g., 100%, 80%, and 60%). Second, three feeding strategies were compared: the free feeding group (e.g., F, 100%), the low restricted group (e.g., L, 60%), and the high restricted group (e.g., H, 20%). The survival rate, the larval fresh weight, ECD, FCR, the apparent digestibility of proteins, and the larval protein content were analyzed. The regression equations of protein intake and body protein content were established. The results showed that there were no significant differences in the survival rate and ECD among group F, L and H on both pig feed and coconut meal. The larval fresh weight and FCR were lower with less feed provided. The protein deposition efficiency was higher in pig feed than coconut meal. These findings contribute to optimizing protein supplementation for BSF larvae, enhancing their potential as a sustainable protein source and waste converter.
Chujun Li1,2*†, Xiaoqing Kuang3† and Zeshuo Liu1
†Equally contributed towards this article.
Keywords: Black Soldier Fly; Diet; Protein Deposition
Introduction
The Black Soldier Fly, Hermetia illucens (L.) (Diptera: Stratiomyidae), with a life-cycle spanning approximately 45 days, encompasses six larval instars. Its short rearing cycle, omnivorous diet, substantial feeding capacity, and rich nutritional content of protein and fat have garnered significant attention in recent years [1]. The black soldier fly larvae can convert organic waste into the high-quality nutritional components, which serving as excellent edible and feed-stock materials. Consequently, the black soldier fly industry has grown rapidly [2].
By consuming organic waste, black soldier fly larvae transform nitrogen and carbon sources into their own proteins, fats, and other nutrients. The nutritional composition of the larvae varies depending on the type of organic waste fed to them. For instance, larvae reared on pig manure exhibit slightly higher crude protein levels compared to those fed on cow manure, whereas larvae fed on cow manure have higher crude fat and ash contents [3]. Sheppard, Newton [4], among one of the earliest, reported the nutrient of larvae, which containing 42-43% dry matter, with 42-44% crude protein, 31-35% crude fat, 11-15% ash, 4.8-5.1% calcium, and 0.60-0.63% phosphorus in their dry matter.
The black soldier fly represents a promising candidate for edible insect. As the global population is projected to reach 8.6 billion by 2030 [5], the pressure on food and feed resources caused by population growth poses a significant challenge. As a high-protein and high-fat insect, black soldier flies reared on clean and edible organic waste such as vegetable leaves can be directly utilized as edible materials [6]. Compared to livestock and poultry farming, black soldier fly production requires significantly less land per kilogram of edible product, making it a land-efficient alternative [7]. Moreover, utilizing organic waste such as livestock manure to rear black soldier flies can provide high-quality feedstock, alleviating the pressure on fish meal production and reducing feed costs [8].
In the rearing process of black soldier fly (BSF) larvae, an excessive protein content in their feed can lead to feed waste. Proteins unutilized are decomposed by other microorganisms, generating ammonia, which elevates the ammonia concentration in BSF farms and adversely affects the breeding environment [9]. Research on the protein requirements for BSF larval growth is scarce in contrast to the abundance of studies conducted on livestock and aquaculture species such as pigs, cattle, sheep, and shrimp. As pork, beef, and mutton are staple meat sources, studying their protein requirements is crucial, especially when feed resources are limited [10, 11]. By investigating the relationship between feed protein and protein deposition in these animals, we can optimize feed utilization, reduce costs, and mitigate environmental pollution [12].
As black soldier fly has the potential to serve as a high- quality protein-rich feed ingredient, studying its protein deposition and protein requirements is imperative. This research is vital for obtaining high-quality BSF larvae and facilitating large-scale breeding. Protein is a critical nutrient for BSF larval growth and an essential source of protein accumulation. Thus, investigating the protein requirements during the larval stage can ensure optimal larval growth while minimizing feed costs for large-scale breeding operations.
Materials and Methods
Experiment 1: Determination of Dry Feed Input Quantity
The feed ingredients selected for this experiment were pig feed and coconut meal. Based on the diet specific FCR obtained from previous experimental experience, the maximum dry feed input quantity was set as the control group (100% group). Subsequently, 80% and 60% of this maximum quantity were chosen as the experimental groups (80% group and 60% group), with three replicates for each group. Since one time feeding promote microbes growth, multiple time feeding strategy was used in this experiment. Five-day-old BSF larvae were used for the feeding trial. Each plastic box (15cm x 10cm x 6cm) was inoculated with 200 larvae, and the experimental temperature was maintained at 26-32°C with a feed moisture content ranging from 60% to 70%. The specific dry feed input quantities for each feeding session are detailed as follows Tables 1 & 2.
| Treatments | Dry weight added per time (g) |
|---|---|
| 100% | 10.0 |
| 80% | 8.0 |
| 60% | 6.0 |
Table 1: Pig feed input per time.
| Treatments | Dry weight added per time (g) |
|---|---|
| 100% | 12.0 |
| 80% | 9.6 |
| 60% | 7.2 |
Table 2: Coconut meal input per time.
After the initial feeding, the BSF larvae were allowed to grow until they reached 9 days old, signifying their entry into the rapid growth phase. From this point on, they were fed every two days until the first prepupa emerged. Upon the appearance of the first prepupa, the following parameters were recorded and calculated for each group: the number of live larvae, fresh weight of larvae, dry weight of larvae, conversion rate, and FCR. Larval fresh weight: After collection, the larvae were soaked in water for 12 hours. The water on their surface was then blotted dry before weighing. Larval dry weight: The fresh larvae were placed in an oven at 60°C and dried until they reached a constant weight (approximately 12 hours). They were then removed from the oven and weighed as soon as possible.
- ECD = Larval dry weight / (Feed dry weight- residue dry weight)
- FCR = Feed dry weight / Larval fresh weight Data analysis was conducted using SPSS 22.0 to compare the results. If no significant differences were observed in the fresh weight of BSF larvae but significant differences were noted in the FCR, it would indicate that the dry feed input quantity for each group exceeded the requirement of the BSF larvae. In such cases, the dry feed input quantity for each feeding session across all groups should be adjusted downwards.
Experiment 2: Protein Deposition Experiment
Each type of feed (e.g., pig feed or coconut meal) was divided into three groups: the free feeding group, the low restriction group, and the high restriction group. Based on experiment 1, the 100% was chosen as free feeding group, the 60% was chosen as low restriction group since the 80% group did not meet the feed restriction criteria. Therefore, the low restriction group received 60% of the dry feed input quantity of the free feeding group, while the high restriction group received 20%. Six replicates were set up for each group. The larvae used were all five-day-old, and the experimental environment was maintained at a temperature of 26-32°C with a feed moisture content ranging from 60% to 70%. The specific dry feed input quantity for each feeding session in each experimental group is as follows Tables 3 & 4.
| Treatments | Dry weight added per time (g) |
|---|---|
| free feeding group | 10.0 |
| low restriction group | 6.0 |
| high restriction group | 2.0 |
Table 3: Pig feed input per time.
| Treatments | Dry weight added per time (g) |
|---|---|
| free feeding group | 12.0 |
| low restriction group | 7.2 |
| high restriction group | 2.4 |
Table 4: Coconut meal input per time.
Water was added in multiple batches and in appropriate amounts to adjust the moisture content of the feed, aiming for approximately 65% moisture in the pig feed group and 70% in the coconut meal group, resulting in a porridge-like consistency. Each group was inoculated with 200 five-day-old BSF larvae and then situated in a climate-controlled chamber maintained at 26-32°C. When the feed in the free feeding group was consumed (approximately when the BSF larvae reached 9 days old), additional feed was provided, with the same dry feed input quantity as the initial feeding, and the moisture content was adjusted accordingly. Subsequent feedings were carried out based on the consumption rate of the BSF larvae (approximately every 2-3 days) until the first prepupa emerged. Upon the appearance of the first prepupa, the experimental materials were collected by separating the BSF larvae from the residual feed in each group. The larvae were soaked in water to evacuate their guts and dry with paper tower, and the number of live larvae, fresh weight of larvae, and residual feed weight were recorded and weighed separately. The larvae and residue were then dried in an oven at 60°C until they reached a constant weight, and their dry weights were recorded. Finally, the dried BSF larvae and residual were ground into powder, which were sealed in bags, labeled, and stored in a refrigerator at 8°C for later protein content determination.
Experiment 3: Protein Content Determination
Using an analytical balance, accurately weigh 0.1 g of dried BSF larva samples and 0.2 g of residue samples (containing 5-80 mg of nitrogen) per portion, respectively. Place them into digestion tubes. Add 6.4 g of mixed catalyst (consisting of 0.4 g of anhydrous copper sulfate and 6 g of sodium sulfate) and 12 mL of sulfuric acid (98%, nitrogen- free , chemically pure) to each tube. Place the tubes on a digestion furnace and gradually increase the temperature settings (e.g., 100°C, 200°C, 300°C, to 420°C), maintaining the final temperature of 420°C for 1 hour. After digestion, remove the tubes and allow them to cool. Then, add distilled water to each tube to bring the volume up to 100 mL, preparing the digested sample solutions, which are stored in conical flasks. From each conical flask, transfer 50 mL of the sample solution into a digestion tube. Add 50 mL of sodium hydroxide solution (40% w/v) to the tube and attach it to the distillation unit of the Kjeldahl nitrogen analyzer. Use 25 mL of boric acid solution (2% w/v) as the absorbing solution, into which 2 drops of a mixed indicator (prepared fresh by mixing equal volumes of 0.1% methyl red in ethanol and 0.5% bromocresol green in ethanol) are added. Ensure that the end of the condenser tube of the distillation unit is immersed in the conical flask containing the absorbing solution during distillation. Distill until the volume of the absorbing solution reaches 100 mL (approximately 4-5 minutes). After the reaction is complete, lower the conical flask and rinse the end of the condenser tube with 10 mL of distilled water, ensuring that all rinse water flows into the conical flask. Titrate the absorbing solution with a 0.1 mol/L standard hydrochloric acid solution until the solution changes from blue-green to grayish-red, indicating the endpoint. Record the volume of standard hydrochloric acid solution consumed. Blank determination: weigh 0.5g of sucrose and follow the same steps as described above for protein content determination, recording the volume of standard hydrochloric acid solution consumed.
Data Analysis
All the experiments were repeated six times. The experimental data were organized using Excel, and statistical analyses were performed using SPSS version 22.0. Prior to any statistical analysis, the Kolmogorov-Smirnov goodness- of-fit test was employed to examine whether the variables followed a normal distribution. For variables that conformed to a normal distribution, a one-way ANOVA (Analysis of Variance) was directly applied to test for significant differences, with Turkey’s test for multiple comparisons. A P-value less than 0.05 (P < 0.05) indicated statistical significance, whereas a P-value greater than 0.05 (P > 0.05) indicated no significant difference. For variables that did not follow a normal distribution, non-parametric tests were utilized for analysis. Results were presented as mean ± standard deviation (mean ± SD). Scatter plots were created in Excel, and linear regression equations were established.
Before the experiment commenced, all feed samples were submitted for testing, revealing a protein content of 15.92% for pig feed and 19.71% for coconut meal. The total ingested protein content by the BSF was calculated based on the total amount of dry feed delivery.
Through the digestion and metabolism trials, the protein content of the dry feed samples and residue samples was measured, enabling the calculation of the apparent protein digestibility (APD):
APD (%) = (Ingested Protein − Residual Protein) / Ingested Protein *100%
Based on the results from the protein deposition experiments, a linear regression model was developed to correlate the protein content in the BSF bodies (RN) with the protein intake (NI). RN= a+b×NI
Results
Determination of Dry Feed Input Quantity
In both the pig feed fed group and the coconut meal fed group, the larval fresh weight in the 100% group was significantly higher than that in the 60% group. However, no significant differences were observed in the ECD and FCR among the three treatments within both the pig feed fed and coconut meal fed groups. The selection of the 100% feed delivery as the free feeding group in the later protein deposition experiment aimed to ensure sufficient protein provision for BSF larvae in the free feeding group, while also creating a significant difference in larval fresh weight compared to the low restriction group (e.g., 60% of the free feeding group ) and the high restriction group (e.g., 20% of the free feeding group) (Table 5).
| Treatments | Larval fresh weight (g) | ECD | FCR |
|---|---|---|---|
| 100% | 35.79±2.176a | 0.29±0.004a | 1.55±0.892a |
| 80% | 30.89±2.100a | 0.30±0.006a | 1.44±0.105a |
| 60% | 21.85±0.625b | 0.29±0.002a | 1.51±0.042a |
Table 5: Larval performance on pig feed.
*Different letters indicate statistical significance (p < 0.05) Table 5: Larval performance on pig feed.
Based on Table 5, the larval fresh weight in the 100% group was 35.79 ± 2.176 g, while that in the 80% group was 30.89 ± 2.100 g. However, the difference between these two groups was not significant (p > 0.05). In contrast, the larval fresh weight in the 60% group, which was 21.85 ± 0.625 g, was significantly different from both the 100% and 80% groups (p = 0.004 and p = 0.027, respectively). Regarding the ECD, the 100% group had a rate of 0.29 ± 0.004, the 80% group had 0.30 ± 0.006, and the 60% group had 0.29 ± 0.002. No significant difference in ECD was observed among the three groups (p > 0.05). The FCR were 1.55 ± 0.892 for the 100% group, 1.44 ± 0.105 for the 80% group, and 1.51 ± 0.042 for the 60% group, with no significant differences among the three groups (p > 0.05). These results indicate that the feeding conditions for all three groups were in accordance with the experimental design, ensuring that the total amount of dry feed provided was completely consumed by the black soldier fly larvae, and significant differences in larval fresh weight were observed as intended (Table 6).
| Treatments | Larval fresh weight (g) | ECD | FCR |
|---|---|---|---|
| 100% | 22.91±1.473a | 0.18±0.016a | 2.73±0.185a |
| 80% | 20.92±0.335a | 0.18±0.003a | 2.30±0.037a |
| 60% | 13.82±0.983b | 0.17±0.004a | 2.63±0.202a |
Table 6: Larval performance on coconut meal.
*Different letters indicate statistical significance (p < 0.05) Table 6: Larval performance on coconut meal.
The data in Table 6 indicates that within the coconut meal fed group, the difference in live weight between the 100% group (22.91 ± 1.473 g) and the 80% group (20.92 ±
0.335 g) was not significant (p > 0.05), although numerically, the larval fresh weight of the 100% group was greater than that of the 80% group. Significant differences were observed between the 100% group and the 60% group (13.82 ± 0.983 g) (p = 0.003), as well as between the 80% group and the 60% group (p = 0.007), with both the 100% and 80% groups exhibiting greater larval fresh weight than the 60% group. Regarding ECD, the 100% group had a rate of 0.18 ± 0.016, the 80% group had 0.18 ± 0.003, and the 60% group had 0.17 ± 0.004, with no significant differences among the three groups (p > 0.05). Similarly, the FCR were 2.73 ± 0.185 for the 100% group, 2.30 ± 0.037 for the 80% group, and 2.63 ± 0.202 for the 60% group, showing no significant differences (p > 0.05). These results suggest that the consumption of the dry feed was consistent across all groups, validating the dry feed delivery volume at 12g for the 100% group with coconut meal.
Protein Deposition Experiment
In both the pig feed fed group and the coconut meal fed group, the difference in the number of survival between the free feeding group and the low restriction and high restriction groups was not pronounced. However, the larval fresh weight in the free feeding group was significantly greater than that in both the high restriction and low restriction groups, with clear and significant differences observed among the three groups. While the conversion rates did not differ significantly, the FCR exhibited significant differences.
As evident from Table 7, the number of survival in the free feeding group, low restriction, and high restriction groups was 181.83 ± 2.372, 175.00 ± 2.129, and 173.17 ± 4.915, respectively, with no significant difference among the three groups (p > 0.05). However, the larval fresh weight varied significantly among the groups (p < 0.000). Specifically, the live weight of the free feeding group (24.37 ± 0.500 g) was significantly different from that of the low restriction group (17.44 ± 0.427 g) (p < 0.000), and the low restriction group differed significantly from the high restriction group (7.19 ± 0.444 g) (p < 0.000). Notably, the larval fresh weight of the free feeding group was 3.4 times greater than that of the high restriction group and 1.4 times that of the low restriction group. The ECD among the three groups were not significantly different (p > 0.05), with values of 0.25 ± 0.003 for the free feeding group, 0.25 ± 0.003 for the low restriction group, and 0.26 ± 0.006 for the high restriction group. However, the FCR showed significant differences among the groups (p < 0.000). The FCR of the free feeding group (1.79 ± 0.043) was significantly different from that of the low restriction group (1.47 ± 0.035) (p = 0.002) and the high restriction group (1.18 ± 0.075) (p < 0.000). Additionally, the difference between the low restriction and high restriction groups was also significant (p = 0.005) (Table 8).
| Treatment | Number of survival | Larval fresh weight (g) | ECD | FCR |
|---|---|---|---|---|
| free feeding group | 181.83±2.372a | 24.37±0.500a | 0.25±0.003a | 1.79±0.043a |
| low restriction group | 175.00±2.129a | 17.44±0.427b | 0.25±0.003a | 1.47±0.035b |
| high restriction group | 173.17±4.915a | 7.19±0.444c | 0.26±0.006a | 1.18±0.075c |
Table 7: Larval performance on pig feed.
*Different letters indicate statistical significance (p < 0.05) Table 7: Larval performance on pig feed.
| Treatment | Number of survival | Larval fresh weight (g) | ECD | FCR |
|---|---|---|---|---|
| free feeding group | 184.83±2.056a | 25.29±0.468a | 0.26±0.004a | 2.11±0.038a |
| low restriction group | 179.67±3.667a | 17.52±0.676b | 0.28±0.005a | 1.75±0.046b |
| high restriction group | 178.00±4.539a | 6.33±0.403c | 0.27±0.016a | 1.59±0.007b |
Table 8: Larval performance on coconut meal.
*Different letters indicate statistical significance (p < 0.05) Table 8: Larval performance on coconut meal.
In the coconut meal fed group, the number of survival in the free feeding group (184.83 ± 2.056), low restriction (179.67 ± 3.667), and high restriction (178.00 ± 4.539) groups did not differ significantly (p > 0.05). The larval fresh weight showed significant differences among the three groups (p < 0.000). Specifically, the larval fresh weight of the free feeding group (25.29 ± 0.468 g) was significantly different from that of the low restriction group (17.52 ± 0.676 g) (p < 0.000) and the high restriction group (6.33 ± 0.403 g) (p < 0.000). Additionally, the difference between the low restriction and high restriction groups was also significant (p < 0.000). Numerically, thelarval fresh weight of the free feeding group was approximately 4 times that of the high restriction group and 1.4 times that of the low restriction group. The ECD of the free feeding, low restriction, and high restriction groups were 0.26 ± 0.004, 0.28 ± 0.005, and 0.27 ± 0.016, respectively, with no significant differences among the groups (p > 0.05). The FCR was 2.11 ± 0.038 for the free feeding group and 1.75 ± 0.046 for the low restriction group, showing a significant difference between the two (p = 0.001). Moreover, the FCR of the free feeding group differed significantly from that of the high restriction group (1.59 ± 0.007) (p < 0.000), but the difference between the low restriction and high restriction groups was not significant (p > 0.05).
Apparent Protein Digestibility and Deposition
In both the pig feed fed group and the coconut meal fed group, the low restriction group exhibited the numerically highest apparent protein digestibility, although the differences among the three groups were not pronounced in the coconut meal fed group. Within the pig feed fed group, the apparent digestibility of the low restriction group was significantly different from that of the free feeding group. Significant differences were observed in the body protein content among the three groups. Numerically, the high restriction group had the highest protein percentage. In the pig feed fed group, the differences in protein percentage among the three groups were not significant. However, in the coconut meal fed group, the protein percentage of the high restriction group was significantly different from that of the other two groups (Table 9).
| Treatment | Apparent protein digestibility (%) | Larval protein content (%) |
|---|---|---|
| free feeding group | 0.76±0.019a | 44.54±0.874a |
| low restriction group | 0.84±0.012b | 46.78±2.180a |
| high restriction group | 0.77±0.028ab | 53.21±4.039a |
Table 9: Apparent protein digestibility and deposition with pig feed.
*Different letters indicate statistical significance (p < 0.05) Table 9: Apparent protein digestibility and deposition with pig feed.
The apparent protein digestibility in the pig feed fed group varied significantly among the free feeding group (0.76 ± 0.019%), low restriction group (0.84 ± 0.012%), and high restriction group (0.77 ± 0.028%) (p = 0.022). Specifically, a significant difference was observed between the free feeding and low restriction groups (p = 0.029), while no significant differences were found between the low restriction and high restriction groups (p > 0.05), or between the free feeding and high restriction groups (p > 0.05). The highest apparent protein digestibility was observed in the low restriction group. The protein percentage did not differ significantly among the groups (p > 0.05), with values of 44.54 ± 0.874% for the free feeding group, 46.78 ± 2.180% for the low restriction group, and 53.21 ± 4.039% for the high restriction group, numerically the highest being in the high restriction group (Table 10).
| Treatment | Apparent protein digestibility (%) | Larval protein content (%) |
|---|---|---|
| free feeding group | 0.58±0.016a | 49.23±2.284a |
| low restriction group | 0.60±0.024a | 47.35±2.872a |
| high restriction group | 0.53±0.015a | 58.50±1.431b |
Table 10: Apparent protein digestibility and deposition with coconut meal.
*Different letters indicate statistical significance (p < 0.05) Table 10: Apparent protein digestibility and deposition with coconut meal.
Table 10 indicates that in the coconut meal fed group, the apparent protein digestibility was 0.58 ± 0.016% for the free feeding group, 0.60 ± 0.024% for the low restriction group, and 0.53 ± 0.015% for the high restriction group. However, the differences among the three groups were not significant (p > 0.05). Regarding protein percentage, the high restriction group had the highest value (58.50 ± 1.431%), which was significantly different from that of the free feeding group (49.23 ± 2.284%) and the low restriction group (47.35 ± 2.872%) (p = 0.029 and p = 0.009, respectively).
The Relationship between Protein Intake and Body Protein Content
The relationship between protein intake and body protein content in BSF larvae exhibits a linear correlation, with correlation coefficients greater than 0.9. In addition, the slope for the pig feed fed group is steeper than that for the coconut meal fed group, indicating that when the same amount of protein is ingested, the BSF larvae reared on pig feed have a higher body protein content compared to those reared on coconut meal. This suggests that different feed sources have different protein deposition efficiency in BSF larvae (Figure 1).
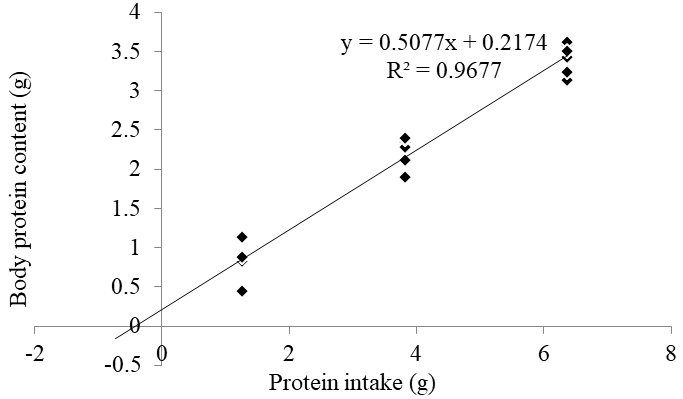
As depicted in Figure 1, a linear relationship exists between protein intake and body protein content in the pig feed fed group, with the regression equation being y = 0.5077x + 0.2174. The slope of 0.5077 represents the ratio of body protein content to protein intake, indicating that for every 1g of protein ingested from pig feed, the BSF larvae accumulate 0.5077g of body protein.
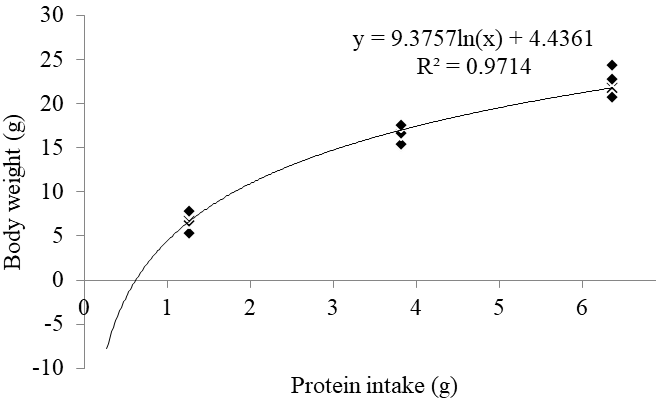
Figure 2 illustrates the linear relationship between protein intake and body protein content in the coconut meal fed group, with the regression equation given as y = 0.3418x + 0.0886. The slope of 0.3418 represents the ratio of body protein content to protein intake, indicating that for every 1g of protein ingested from coconut meal, the body protein of BSF larvae increases by 0.3418g.
The Relationship between the Body Weight and Protein Intake
The relationship between the body weight (degutted) and protein intake of BSF larvae in both the pig feed fed group and the coconut meal fed group exhibits a logarithmic correlation, with correlation coefficients greater than 0.97. This indicates that as protein intake increases, the rate of increase in the larval body weight diminishes.
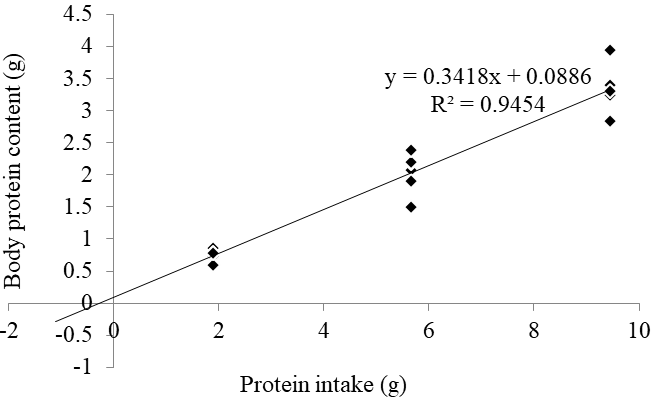
Figure 3 demonstrates a logarithmic correlation between protein intake and larval body weight reared on pig feed, with the logarithmic equation given as y = 9.3757ln(x) + 4.4361 and a correlation coefficient of 0.9714. This equation allows for the estimation of the final body weight of BSF larvae based on the protein intake from pig feed.
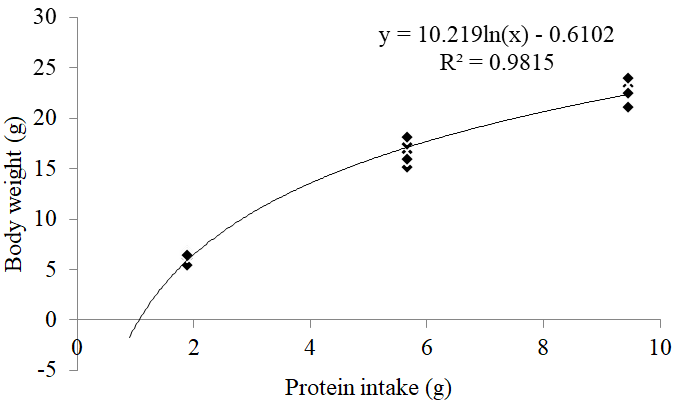
Figure 4 indicates a logarithmic correlation between protein intake and evacuated body weight in BSF larvae reared on coconut meal, with the logarithmic equation given as y = 10.219ln(x) - 0.6102 and a correlation coefficient of 0.9815. This equation enables the prediction of the final evacuated body weight of BSF larvae based on the protein intake from coconut meal.
Discussion
Limiting the feeding amount of BSF larvae to restrict their protein intake had no significant effect on larval survival rate but had a significant difference in the fresh weight of BSF larvae. In this experiment, the protein intake of the low restriction group was set to 60% of the free feeding group, while that of the high restriction group was 20% of the free feeding group. The results were consistent between the pig feed fed group and the coconut meal fed group, with the number of survivals in the free feeding group being greater than that in the low restriction group, and the lowest number in the high restriction group. However, the differences among the three groups were not statistically significant, indicating that under suitable conditions of feed moisture and temperature, a high restriction on protein intake did not significantly affect the survival of BSF larvae. Therefore, the size and fresh weight of BSF larvae is controllable, and by ensuring appropriate temperature and humidity, different sizes and fresh weights of BSF larvae can be obtained by limiting their protein intake. In this experiment, the relationship between protein intake and body weight for BSF larvae reared on pig feed was y = 9.3757ln(x) + 4.4361, with protein intake (g) as the horizontal axis and body weight (g) as the vertical axis. For BSF larvae reared on coconut meal, the relationship was y = 10.219ln(x) - 0.6102, with same axes. These equations can be used for rough estimations when rearing BSF larvae on other feed sources.
During the larval stage of BSF, a low-level restriction on the amount of feed can be implemented to achieve economic benefits by conserving feed without compromising the characteristics of the BSF larvae. The FCR in the coconut meal fed group was consistently greater than that of the pig feed fed group, both in the free feeding and restriction groups. The FCR for the coconut meal group ranged from 1.59 to 2.11, while for the pig feed group, it was between 1.18 and 1.79. Compared to the FCRs of BSF larvae reared on other feeds, for example, Gainesville diet with an FCR of 3.43, apple pulp with an FCR of 8.90, chicken manure with an FCR of 2.00, and food waste with an FCR of 1.58 [13]. Through comparison, the FCRs of BSF larvae reared on pig feed and coconut meal are relatively closer to 1, indicating higher feed utilization efficiency. Among the free feeding, low restriction, and high restriction groups, there was no significant difference in the ECD of BSF larvae between the pig feed fed and coconut meal fed groups, but there were significant differences in FCR. Specifically, the FCR was the highest in the free feeding group, intermediate in the low restriction group (where dry feed was 60% of the free feeding group), and lowest (close to 1) in the high restriction group. The lack of significant differences in ECD suggests that the utilization efficiency of feed by BSF larvae in each group was similar, but the free feeding group, with more dry feed, consumed more feed per gram of larval weight gain. As the low restriction group had only 60% of the dry feed of the free feeding group yet maintained the same ECD, it can be inferred that implementing a low-level restriction on dry feed can save feed costs without compromising the quality of BSF larvae, thereby enhancing economic benefits.
The apparent protein digestibility (APD) of BSF larvae in the pig feed fed group showed significant differences between the free feeding, low restriction, and high restriction groups. However, in the coconut meal fed group, there were no significant differences in APD among the three groups, although numerically, the low restriction group consistently exhibited the highest APD on both of the two diets. This suggests a trend where the low restriction group may have higher APD than both the free feeding and high restriction groups. Regarding the protein percentage of BSF larvae, the coconut meal fed group showed significant differences between the free feeding, low restriction, and high restriction groups, whereas the differences in the pig feed fed group were not as pronounced. Nevertheless, across all groups, the high restriction group consistently had the numerically highest protein percentage in the larvae. Combining the data on the larval fresh weight, FCR, ECD, apparent protein digestibility, and protein percentage of BSF larvae from this experiment, it can be concluded that the free feeding method is not the most economical, leading to feed waste. Instead, implementing a low-level restriction on dry feed intake can save economic costs in rearing. Similarly, in the poultry industry, restricting feed intake in meat chickens, as practiced by Sahraei [14], can help ensure meat quality while enhancing reproductive capacity and reducing costs.
The purpose of this experiment was to determine the protein requirement during the larval stage of BSF. The maintenance protein requirement can be derived from the linear regression equation between protein intake and body protein content. For the pig feed fed group, the equation was y = 0.5077x + 0.2174 (where x is protein intake and y are body protein content). For the coconut meal fed group, the equation was y = 0.3418x + 0.0886. Although both regression equations had correlation coefficients close to 1, the intersection points with the x-axis were less than 0, indicating negative maintenance protein requirements, which was due towhich are clearly unreasonable. Upon reviewing the experimental procedures and data, it was discovered that the initial weight (protein content) of the five-day-old BSF larvae used in the experiment were not accounted.had been overlooked.The average five-day-old larval weight is around 0.005-0.01 g in general, which often being neglected compared to the average final larval weight (i.e., ~0.2 g) during weight gain calculation. We can correct it by adding the initial protein content back in the equation. Drawing on the research by Liu C, et al. [15] on the nutritional composition throughout the life cycle of BSF, a rough estimation of the maintenance protein requirement for this experiment can be made. According to the literature, five-day-old BSF larvae weigh approximately 2.5 mg and have a protein content percentage of around 54.2%. With 200 five-day-old larvae per group in the experiment, the original protein content can be calculated as 0.271 g. By shifting the two linear regression equations downwards to account for this initial protein content, new equations are obtained: y = 0.5077x - 0.0536 for the pig feed fed group (where y now represents protein deposition), and y = 0.3418x - 0.1824 for the coconut meal fed group. The x-intercepts of these new equations are 0.1056 g and 0.5336 g, respectively. Further calculations (e.g., divided by 200 larvae) yield an estimated range of maintenance protein content per BSF larva of 0.528 mg to 2.668 mg for pig feed and coconut meal, respectively. It should be noted that this estimation carries some uncertainty due to several factors. Firstly, the reference values for the fresh body weight and protein content percentage of five- day-old BSF larvae, which were obtained from larvae fed on chicken feed (21.0% protein content), differ from the feeds used in this experiment. Secondly, even though the larvae were all initially five days old, the final linear regression equations between protein intake and body protein content had different slopes for the two feed groups, contributing to some deviation in the estimated maintenance protein requirements.
Conclusion
In conclusion, the present study demonstrated that the survival rate of black soldier fly larvae remained unaffected under conditions of highly restricted dry feed allowance, provided that optimal temperature and humidity were maintained. Furthermore, variations in protein intake led to differential protein deposition in the larvae, with a linear relationship observed between protein intake and protein deposition, resulting in significantly heavier larvae with higher protein content. However, the increase in larval weight slowed down as protein intake escalated, suggesting a logarithmic correlation. The estimated maintenance protein requirement for individual BSF larvae ranged between 0.528 mg and 2.668 mg per larva depended on the type of feed provided. Future experiments should explore the manipulation of various feeding conditions, including moisture content, pH, and microbial growth, to regulate nitrogen excretion and consequently mitigate ammonia levels in BSF farms, enhancing the overall rearing environment. Notably, the inability to measure initial protein content in this study limited the accuracy of maintaining protein requirement calculations, emphasizing the need for further research considering potential variations in maintenance protein content across different feed formulations.
Conflict of Interest
The authors declare no conflict of interest.
References
-
Harnden LM, Tomberlin JK (2016) Effects of temperature and diet on black soldier fly, _Hermetia illucens_ (L.) (Diptera: Stratiomyidae), development. Forensic Sci Int 266: 109-116.
-
Siddiqui SA, Ristow B, Rahayu T, Putra NS, Yuwono NW, et al. (2022) Black soldier fly larvae (BSFL) and their affinity for organic waste processing. Waste Manage 140: 1-13.
-
Oonincx D, Huis AV, Loon JL (2015) Nutrient utilisation by black soldier flies fed with chicken, pig, or cow manure. J Insects as Food Feed 1(2): 131-139.
-
Sheppard DC, Newton GL, Thompson SA, Savage S (1994) A value added manure management system using the black soldier fly. Bioresour Technol 50(3): 275-279.
-
Bruinsma J (2017) World agriculture: towards 2015/2030: an FAO study. Routledge.
-
Wang YS, Shelomi M (2017) Review of black soldier fly (Hermetia illucens) as animal feed and human food. Foods 6(10): 91.
-
Müller A, Wolf D, Gutzeit HO (2017) The black soldier fly, Hermetia illucens–a promising source for sustainable production of proteins, lipids and bioactive substances. Z. Naturforsch C J Biosci 72(9-10): 351-363.
-
Barragan-Fonseca KB, Dicke M, Loon JJV (2017) Nutritional value of the black soldier fly (_Hermetia_ _illucens_ L.) and its suitability as animal feed–a review. J Insects as Food Feed 3(2): 105-120.
-
Parodi, A., Loon JJV, Bolhuis JE, Heetkamp MJW, Schelt JV, et al. (2020) Bioconversion efficiencies, greenhouse gas and ammonia emissions during black soldier fly rearing–A mass balance approach. J Clean Prod 271: 122488.
-
Wu G, Li P (2022) The “ideal protein” concept is not ideal in animal nutrition. Exp Biol Med 247(13): 1191-1201.
-
Teles AO, Couto A, Enes P, Peres H (2022) Dietary protein requirements of fish–a meta‐analysis. Rev Aquac 12(3): 1445-1477.
-
Chrystal PV, Greenhalgh S, Selle PH, Liu SY (2020) Facilitating the acceptance of tangibly reduced-crude protein diets for chicken-meat production. Anim Nutr 6(3): 247-257.
-
Broeckx L, Frooninckx L, Slegers L, Berrens S, Noyens I, et al. (2021) Growth of black soldier fly larvae reared on organic side-streams. Sustainability 13(23): 12953.
-
Sahraei M (2012) Feed restriction in broiler chickens production. Biotechnol 28(2): 333-352.
-
Liu X, Chen X, Wang H, Yang Q, Rehman K, et al. (2017) Dynamic changes of nutrient composition throughout the entire life cycle of black soldier fly. PloS one 12(8): e0182601.
- California Red-Legged Frog and Non-Listed Amphibians Response to Non-Native Fish Removal
- Industrial Standardization of the Bio-OS: Algorithmic Codification of Resilience Engineering Guidelines and Version V8 Architecture
- Climate Variability and the Sustainability of Snail Farming in Nigeria: Past Trends, Present Challenges and Potential Outlook
- The Evaluation of the Surveillance System of Anthrax in Gilgit-Baltistan, Pakistan, 2018
- Natural Decline to Extinction of A New Zealand Rabbit Population
- Mitochondrial Bio-Logistics: Steering Co-Enzyme Q10 and Lycopene Synergies within the Science 4.0 Bio-OS Framework