An Ecological Assessment of Insect Diversity at Rawakeeb Semi- Arid Land in Sudan
Sudan boasts diverse ecological zones with unique biodiversity. Some of these zones were subjected to degradation due to climate change and humanintervention. Several attempts and sometimes serious efforts have been made to mitigate such degradation, includingthe formulation of legislative rules to regulate their use and the development of pilot projects to adopt and recommend appropriate conservation methods. Insects are considered as main components of the ecosystem biodiversity. They gain this importance via their vital role in providing ecological processes that sustain ecosystems such as nutrient cycling, plant growth and productivity, and soil and water conservation. Despite their vital role, they receive little attention from many ecologists in Sudan. Thus, this paper was aimed to undertake an ecological assessment for the insect fauna at Rawakeeb semiarid land (lat.15 ͦ 2͘ &15 ͦ36N, long. 32 ͦ 0& 32 ͦ 10E). A general survey was done to collect insects using direct and butterfly netting collection methods. The ecological assessment was carried out by classifying encountered insects and identifying their biodiversity value using the Simpson. Diversity Index and counting the relative abundance of the insect species. The impact of the prevailing climatic conditions of soiland air temperatures and relative humidity on insect was evaluated using Pearson's correlation co-efficient. Results: Obtained indicated the collection of 672 insect specimens identified into 6 orders, 8 families, and 9 species. Insect orders included Hemiptera, Blattodea, Coleoptera, Orthoptera, Diptera, and Bacillidae.The encountered insects showed a high diversity index of 0.87. The relative abundance value of the collected insect specimens varied from 22.32% in Microtermes sp, 10.42 % in Spilostethus sp, and 1.48 % in Clonaria aegyptiaca. Person correlation coefficient values indicated positive correlations of all insect species to soil and air temperature and relative humidity. These results could be ascribed to the suitability of the prevailing climatic and other habitat conditions for the proliferation of the encountered insects.
Maha Abdellatif A¹* and Abdel Gadir MA²
¹Environment and Natural Resources and Desertification Research Institute, National Center for Research, Sudan ²Integrated Agricultural Pests Management Research Centre, Agricultural Research Corporation, Wad Medani, Sudan Keywords: Sudan; Semiarid; Insects; Biodiversity; Relative Abundance
Introduction
Sudan ecological zones include arid, semi-arid, low and high rainfall savannah, mountain and costal zones with their unique biodiversity. It is known as one the most countries affected by climate change and its consequences represented in high temperature values, erratic rain fall, repeated drought cycles and socio economic effects, Abdellatif, et al. [1]. Several attempts were done to mitigate these consequences including strengthening legislative rule for natural resources use, improving water management technologies, adoption of climate resilient crops, and empower environmental awareness on environmental and biological recourses use and conservation, Khalid, et al. [2]. Among these biological resources; insects represented an important group of animal resources that contribute significantly to the functioning of their ecosystem. They play key role in keeping ecosystem balance through their role in nutrient cycling via decomposition process, crop production as pollinators and natural enemies forother insect plant pest Verma, et al. [3]. Their ecological function are greatly affected by their population density and abundance which in turn are factors of the prevailing climatic conditions, Knopetal [4].
Despite the sebenefits; insects are subjected to threats leading to its extension. These threats result from habitat change due from human intervention which may lead to reduction in insect diversity , abundance and eventually insect extension, Hausmann, et al. [5]. Monitoring insect diversity in Sudan began before independence in 1956; since then, intensive field surveys have been conducted to cover all ecological zones of the country. It began when Welcome Tropical Research Laboratories in Khartoum has carried outa national insect collection and identification efforts in 1902. Although this national insect collection concentrates on insect species of agricultural and medical importance, it is considered as one of the largest and oldest insect collections in Africa. During these surveys; they came toidentify 15 orders, 248 families and over 4000 species, Abdellatif, et al. [6]. Recently field surveys were carried out in Sudan semi dry land by the National Center for Research in collaboration with the Insect Collection unit in the Agricultural Research Corporation during the period (2019-2024). During these surveys X orders, X families and X species were identified. The present study gives an account on insects diversity as collected from El Rawakeeb dry land ecosystem. The objectives include identification of insect fauna and determine their functional groups to through some light on the ecological role that could be played by them.
Materials and Methods
Study Area
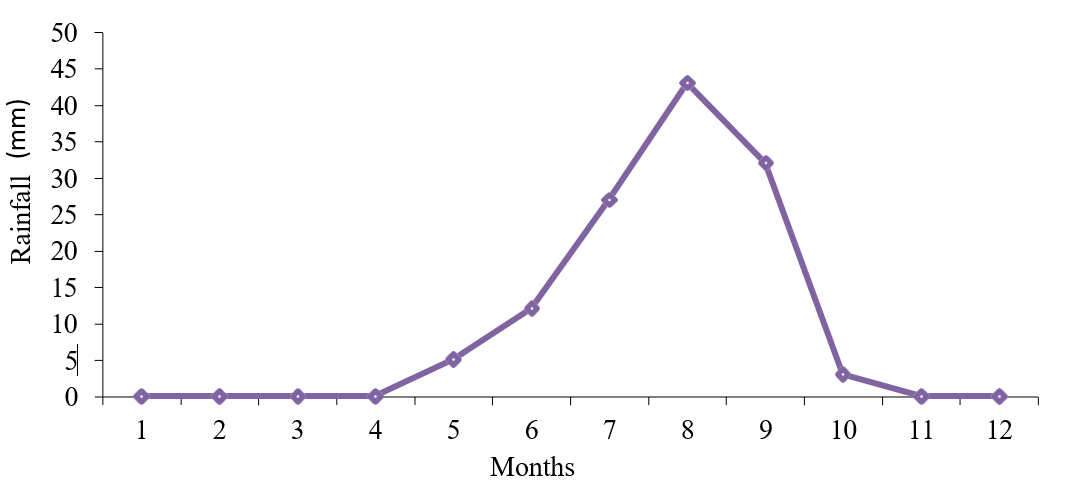
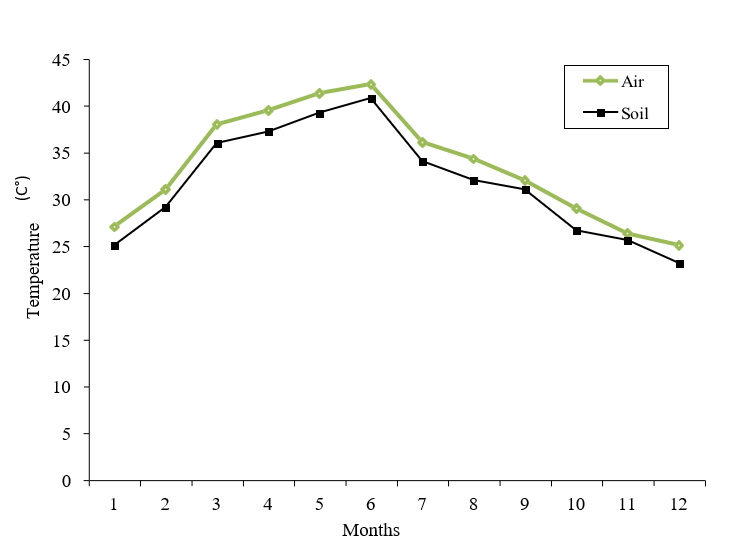
Rawakeeb semi arid land (15˚-2´and 15˚-36-N. and longitudes 32˚-0´and 32-10´ E), lies within the tropical semi- arid region of the Sudan, and its climate is characterized by a short rainy season (July- October) with peak in August (Figure 1). According to Abdellatif, et al. [7] the average rain fallis 100-180mm and the evaporation potential was 1800mm, and thus the relative humidity is low. The summer season usually extends fora long period witha maximum temperature of 43.0ºC during May (Figure 2). The soil temperature is lower than the ambient temperature throughout the year. The geological formation of the area is mainly basement complex over lain by superficial deposits of the Nubian Sandstone. The soil is generally characterized by sandy texture, poor organic nitrogen and carbon, moderate bicarbonate and potassium and high sodium, calcium and chloride contents. The natural vegetation of Rawakeeb area is composed mainly of Acacia spp. (e.g., Vachellia tortilis) and different grasses (e.g., Aristida spp.). This natural vegetationis replaced inthe cultivated sites bysome cereals, e.g., Sorghumbi color and few legumes, e.g., Cajanus cajan. The system of land use is mainly pastoral except in low land where traditional agriculture is practiced.
Methods
Insects were Collected Using the Following Methods
Insects specimens were collected and preserved as described by Sattiand, et al. [8]. The semethods include direct collection and Butter fly netting methods. Insect specimens obtained were grouped according to their body thickness, where, insects of tiny smooth bodies were preserved in 70% ethyl alcohol and other insects were placed into killing jars and were then kept in insect box for further identification. Insects classification:
Insect specimens obtained were classified and functionally grouped in Insect Museum at the Agricultural Research Corporation (ARC), Wad Medani, Sudan.
Ecological assessment Relative abundance According to Hubbell [9], the relative abundance is calculated using the following formula:
Relative Abundance (%)= Isi/∑NsiX100 Where: Isi = Total Number of individual spp. ∑Nsi= Total Number of species population. The relative abundance was graphically represented using a rank abundance curve or Whittaker plot which ranks the species according to their value of their relative abundance in log values Simpson’ diversity index.
Simpson’s Diversity Index (SDI), as mentioned by Krebs [10]. was calculated by the following formula:
( ( ) ( ) − = − − ∑
1 1 1 n ni D N N
Where: n: The number of organisms that belong to species. N: The total number of organisms.
The value of Dranges between 0 and 1. With this index , 1 represents infinite diversity and 0, no diversity, i.e. high D scores indicates high diversity. Pearson Correlation Coefficient The Pearson correlation measures the strength of the linear relationship between two variables. It has a value between -1 to 1, with a value of -1 meaning a total negative linear correlation, 0 being no correlation, and + 1 meaning a totalpositive correlation.
Results
Identification of Insects Collected from Rawakeeb
A total of 672 insect specimenswhich comprised 9 species, 8 families and 6 orders were collected from Rawakeeb semiarid land during the study period as shown in Table 1. In term of insect dominance; order Hemiptera accounted for the largest number of individual (222) thus making up 33.04% of the entire insect collection (Table 2).
Hemiptera was represented by three families Aphididae (96), Lygaeidae, (70) and Lygaeidae (56). Hemiptera is followed by Blattodea which accounted for a total of (150)22.32% and distributed in one family Termitidae (Table 2). Diptera and Bacillidae showed the least individual number of (66and10) 9.82 and 1.48% of the total catch respectively. The remaining taxonomic group of insects occurred in twoorders: Coleoptera113 (16.82%) and Orthoptera 111 (16.52 %), (Table 2).
| Scientificname | Family | Order | Commonname |
|---|---|---|---|
| Microtermes sp | Termitidae | Blattodea | Termites |
| Ahid sp. | Aphididae | Hemiptera | Greenandblack flies |
| Spilostethus sp | Lygaeidae | Hemiptera | Seedbug |
| Lygaeus sp | Lygaeidae | Hemiptera | Blackandredbugs |
| Chrotogonus sp | Acrididae | Orthoptera | Grasshoppers |
| Epicauta sp | Meliodae | Coleoptera | Blisterbeetle |
| Prionothecacoronata | Teneberionidae | Coleoptera | Darklingbeetle |
| Bactrocera sp | Tephritidae | Diptera | Fruit fly |
| Clonaria aegyptiaca (Gray, 1835) | Phasmatoidea | Bacillidae | Stickinsects |
Table 1: Taxonomiclist of insects collected from Rawakeeb semi aridland.
| Insect species | Family | Order | Individual number/ species | Individual number/ order | Individual number% per order |
|---|---|---|---|---|---|
| Microtermes sp | Termitidae | Blattodea | 150 | 150 | 22.32 |
| Ahid sp. | Aphididae | Hemiptera | 96 | ||
| Spilostethus sp | Lygaeidae | Hemiptera | 70 | 222 | |
| Lygaeus sp | Lygaeidae | Hemiptera | 56 | ||
| Chrotogonus sp | Acrididae | Orthoptera | 111 | 111 | 16.52 |
| Epicauta sp | Meliodae | Coleoptera | 86 | 16.82 | |
| Prionotheca coronata | Teneberionidae | Coleoptera | 27 | 113 | |
| Bactrocera sp | Tephritidae | Diptera | 66 | 66 | 9.82 |
| Clonaria aegyptiaca (Gray, 1835) | Phasmatoidea | Bacillidae | 10 | 10 | 1.48 |
Table 2: Dominance of insects collected from Rawakeeb semi aridland.
Relative Abundance of the Encountered Insects Species
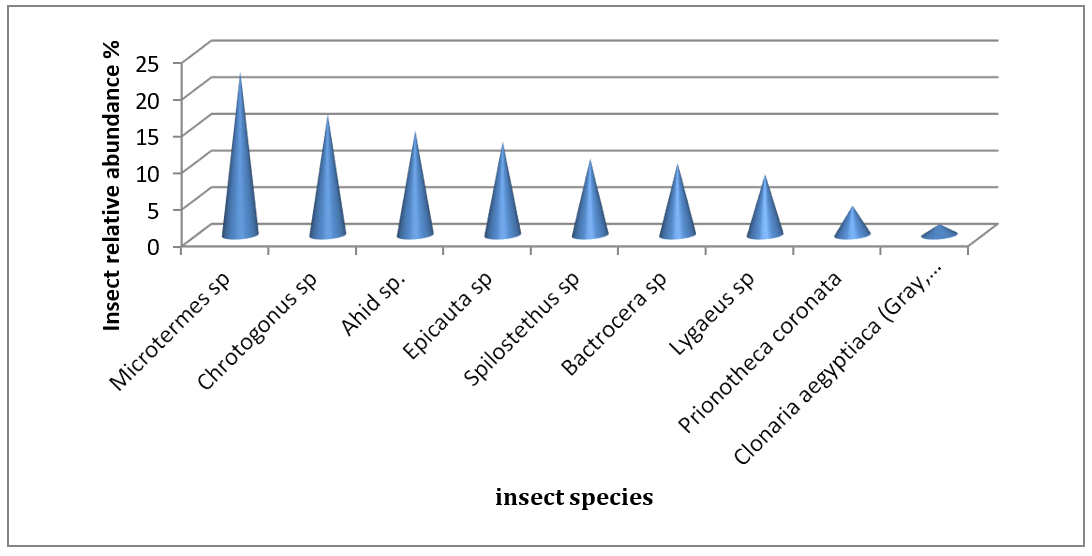
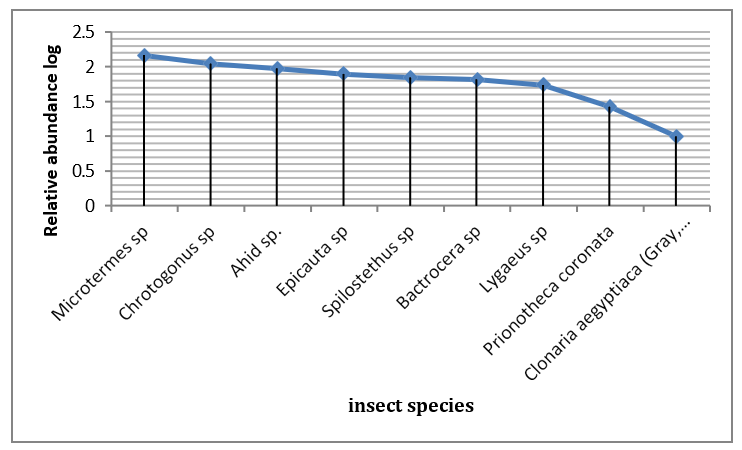
Figure 3, illustrated that Microtermes sp, has the largest abundance of all insect species collected of (150) 22.32%, follwed by Chrotogonus sp (111) 16.52%, but least abundant species were exhibited in Clonaria aegyptiaca (10), 1.48%. The other species are represented in different percentages as shown in Figure 3. The relative abundance rank or Wittker plotused to rank the obtained species according to the log value of their representative numbers and the results are shown in Table 3 and Figure 4. The figure shows that the sespecies are arranged in descending order as follows: decreasing order of Microtermes sp >Chrotogonus sp > Ahid sp >Epicauta sp >Spilostethus sp>Bactrocera sp>Lygaeus sp>Prionotheca coronata>Clonaria aegyptiaca.
| Insect Species | Insect Number | % of Total Count | log |
|---|---|---|---|
| Microtermes sp | 150 | 22.32 | 2.17 |
| Chrotogonus sp | 111 | 16.52 | 2.05 |
| Ahid sp. | 96 | 14.28 | 1.98 |
| Epicauta sp | 86 | 12.79 | 1.9 |
| Spilostethus sp | 70 | 10.43 | 1.85 |
| Bactrocera sp | 66 | 9.82 | 1.82 |
| Lygaeus sp | 56 | 8.33 | 1.74 |
| Prionotheca coronata | 27 | 4.03 | 1.43 |
| Clonaria aegyptiaca | 10 | 1.48 | 1 |
| Total | 672 | 100% |
Table 3: Relative abundance of the encountered insects species.
Diversity of Insects Collected from Rawakeeb
High Simpson Diversity Index (D) isobtained for the encountered insects as given in Table 4. This table indicted that D = 0.8672601305798027.
- Insectspecies
- N (n-1) n(n-1)
- Microtermes sp
- 150
- 149
- 22350
- Ahid sp.
- 96
- 95
- 9120
- Bactrocera sp
- 66
- 65
- 4290
- Prionothecacoronata
- 27
- 26
- 702
- Spilostethus sp
- 70
- 69
- 702
- Lygaeus sp
- 56
- 55
- 3080
- Chrotogonus sp
- 111
- 110
- 12210
- Epicauta sp
- 86
- 85
- 7310
- Clonaria aegyptiaca
- 10
- 9
- 90
- Total
- N=672 ∑N(N-1)=672(672-1)=1672*671=450912
- ∑n(n-1)= 59854
- D=1- (Σn(ni-1)/N(N-1)
- D=1-0.1327398694201973=0.8672601305798027
Table 4: Simpson’diversity index for insects collected from Rawakeeb dry land.
Effect of Temperature and Relative Humidity on Insects
Pearson correlation coefficient was calculated for the effect of temperature and relative humidity values on insects species collected from Rawakeeb land. Results indicated a positivehigh linear correlation of soil and air temperature on Microtermes sp (1.00 and 0.989 respectively) and also Epicauta sp (0.900, 1.00 respectively). Weak positive linear correlation to soil or air temperature were observed regarding Spilostethus sp, Bactrocera sp, Lygaeus sp, Prionotheca coronata, Clonaria aegyptiaca (Table 5). High positive linear correlation was observed between rlative humidity and individual numbers of Lygaeus sp or Clonaria aegyptiaca(1.00 , 0.890respectively). Table 5 also, showed moderate to weak positive linear correlations of relative humidity to the remaining insect species.
| Insect species | Soil Temperature (°C) | Air Temperature (°C) | Relative Humidity(%) |
|---|---|---|---|
| Microtermes sp | 1 | .989** | 0.226 |
| Chrotogonus sp | 0.471 | 0 | 0.479 |
| Ahid sp. | 0 | 1 | 0.531 |
| Epicauta sp | 0.900** | 1 | 0.201 |
| Spilostethus sp | 0.163 | 0.274 | 0.369 |
| Bactrocera sp | 0.222 | 0.24 | 0.368 |
| Lygaeus sp | 0.226 | 0.201 | 1 |
| Prionotheca coronata | 0.22 | 0.275 | 0.36 |
| Clonaria aegyptiaca | 0.357 | 0.279 | 0.890** |
Table 5: Pearson correlation coefficient for impact of temperature and relative humidity on insect species collected from Rawakee
Discussion
Insects Collected from Rawakeeb
At order level; the order Hemiptera dominated the entire insect collection followed by order Blattodea whereas, the order Bacillidae showed leastdominance. Hemiptera are major classified as phytophagous andpotential plant pest,d espitesomeothersarepredatorsandusedasabiologicalcontrol agent. This mode of dominance could be ascribed to the habitat characteristic that may suit some insect proliferation and reproduction more than others. Hemiptera is followed by Blattodea that live in a wide variety ofhabitats and feed as omnivores or detritivores. Coleoptera and Orthoptera showed intermediate dominance within the entire insect collection. Coleoptera are found in aquatic or terrestrial habitats and feed on wide range of diet. Likewise, Orthoptera are cosmopolitan and are phytophagous. Alzahrani, et al [11] reported insect abundance and diversity in an arid ecosystemKingdom Saudi Arabia. They correlate their findings to insect functional group and habitat characteristics that favored insect feeding habit and reproduction giving that insects resembling any othereach biota might significantly inproliferatein a habitat that provides requiredlife needs. At species level; the greatest collected specimen areMicrotermes sp followed by Chrotogonus spbut least number of insect specimens are found to be Clonaria aegyptiaca . Microtermes spdominance might be due to theavailability of food source and suitability of some a biotic factor e.g. soil moisture. Pratiknyo, et al. [12], related abundance and distribution of Microtermesto environmental factors Clonaria aegyptiaca.
Diversity of Rawakeeb Insects
The encountered insect fauna showedhigh diversity index. This could be ascribed to the suitability of Rawakeeb as a habitat for insect proliferation expressed in provision of food, shelter and reproductive conditions. It may also reflect the ability of insect species to adapt to prevailing ecological conditions and can withstandchangingconditions ofclimate orhabitatdisturbances. Landmann, et al. [13], specified that insect diversity correlated to theirhabitat diversity and its suitability for insect reproduction and proliferation. Relative Abundance of the Encountered Insects Orders The relative abundance of the encountered insects belong to the order Hemiptera followed Blattodea , Coleoptera, Orthoptera Diptera and least Bacillidae and followed the same rank according to Wittker plot rank. Kumar, et al. [14] reported that certain insects exhibit greater abundance due to their extended evolutionary history, which allows them to diversify and adapt to a broader arrayof ecological niches. Furthermore, elements such as size, reproductive potential, and the capacity to utilize various food sources enhance the success of specific species. Environmental factors, including temperature, humidity, and the availability of food, are also vital in influencing which insects prosper in a given region.
Effect of Temperature and Relative Humidity on Insects
The study analyzed the relationship between temperature, relative humidity, and insect populations in Rawakeeb, revealing varying correlations. Microtermes sp. and Epicauta sp. exhibited a strong positive linear relationship with both soil and air temperature. In contrast, Spilostethus sp., Bactrocera sp., Lygaeus sp., Prototheca coronata, and Clonaria aegyptiaca showed a weak positive correlation with temperature. A strong positive linear correlation was found between relative humidity and the number of Lygaeus sp. and Clonaria aegyptiaca, while other insect species showed moderate to weak positive correlations with relative humidity. The key finding showed high positive correlation of Microtermes sp. and Epicauta sp. with both soil and air temperature. Weak positive correlation of Spilostethus sp., Bactrocera sp., Lygaeus sp., Prototheca coronata, and Clonaria aegyptiaca with soil and air temperature. The relative Humidity indicted high positive correlation in Lygaeus sp. and Clonaria aegyptiaca. Moderate to weak positive correlation to other insects pecies. Fluctuations in temperature can affect various physiological processes, including metabolism, respiration, immunity, and reproduction, ultimately influencing insect behavior, distribution, and population dynamics. Biber- Freudenberger, et al. [15], generalized those insects as temperature variables proliferate and fluctuate differently with temperature. These observations are in conformity with the findings of Saha, et al. [16] who indicated varied positive and negative impact of temperature on six species of cucurbits Karar, et al. [17], indicated that temperature is one ofthe most critical environmental factors influencing rate of insect growth and development, colonization, distribution, abundance, behavior, life history and fitness. Specific relative humidity preferences vary among insect species, with some preferring low humidity for survival and reproduction, while others thrive in higher humidity Jaworski, et al. [18, 19].
References
-
Abdellatif MA, Dafaelseed AM, Abdal I, Hla Mohammed AI, Safi AI, et al. (2023) Aspects of Biodiversity in Sudan, Experience of the National Center For Research with particular collaboration with the National Insect Collection /ARC/ Sudan. Published by BP international pp: 142-144.
-
Khalid S, Stepanyan D, Wiebelt M, Grethe H, Zhu T (2020) Climate change and agriculture in the Sudan: Impact pathways beyond changes in mean rain fall and temperature. Ecological Economics 169: 106566.
-
Verma K, Chandra R, Abdul Waseem M, Sharma N, Bharathi K, et al. (2023) The Role ofInsects in Ecosystems, an in- Depth Review of Entomological Research. International Journal of Environment and Climate Change 13(10): 4340-4348.
-
Knop E, Grimm ML, Korner-Nievergelt F (2023) Patterns of high-flying insect abundance are shaped by landscape type and abiotic conditions. Sci Rep 13: 15114.
-
Hausmann A, Ulrich W, Segerer AH (2022) Fluctuating insect diversity, abundance and biomass across agricultural landscapes. Sci Rep 12: 17706.
-
Abdellatif MA , Abdellah AM, ElAgaab EA, Safi AA, Abdalla IH (2024) First Report of the Bee Fly Eurycarenus dichopticus Bezzi (Diptera: Bombyliidae)in North Kordo fan State, Sudan. Advances in entomology 12(4): 275- 282.
-
Abdellatif MA, Elhag MM (2015) Combating Desertification in Sudan. In: Environment and Ecology at the Beginning of the 21st Century. In: Carmen B, Cürebaland Gulnara I, et al. (Eds.), ISBN 978- 954-07-3999-1. Publisher St. KlimentOhridskiUniversityPublishing, Sofia, Bulgaria, pp: 256-266.
-
Satti AA, Bilal NAA (2012) The major predators associated with Lucerne crop at El-gorair Scheme in Northern Sudan. International Journal of Science Innovations and Discoveries 2(6): 567-572.
-
Hubbell S (2001) The Unified Neutral Theory of Biodiversity and Biogeography. pp: 448.
-
Krebs CJ (1985) Ecology: The Experimental Analysis of Distribution and Abundance. In: Harper, Row 6th (Edn.), New York, USA, pp: 653.
-
Alzahrani AS, Kehail MA, Almannaa SA, Alkhalifa AH, Alqahtani AM, et al. (2025) Seasonal Occurrence and Biodiversity of Insects in an Arid Ecosystem: An Ecological StudyoftheKing Abdulaziz RoyalReserve. Saudi Arabia Biology 14: 254.
-
Pratiknyo H, Ahmad I, Budianto B (2018) Diversity and abundance of termites along altitudinal gradient andslopes in Mount Slamet, Central Java, Indonesia. Biodiversitas 19(5): 1649-1658.
-
Landmann T, Schmitt M, Ekim B (2023) Insect diversity is a good indicator of biodiversity status in Africa. Commun Earth Environ 4: 234.
-
Kumar H, Verma S, Sagar D, Balikai R (2024) Physiological adaptive mechanisms of insects in different habitats. In book: Animal Diversity: Taxonomical and Physiological Aspects Publisher: M/S Academic Publishers & Distributors, Lucknow.
-
Biber-Freudenberger L, Ziemacki J, Tonnang H, Borgemeister C (2016) Future risks of pest species under changing climatic conditions. PLoS One.
-
Saha Chandran T, Kumar NS, Kumari K (2018) Effect of weather parameters on incidence of insect pests of cucumber in eastern Bihar. Journal of Agro meteorology 20(1): 57-61.
- Industrial Standardization of the Bio-OS: Algorithmic Codification of Resilience Engineering Guidelines and Version V8 Architecture
- Climate Variability and the Sustainability of Snail Farming in Nigeria: Past Trends, Present Challenges and Potential Outlook
- The Evaluation of the Surveillance System of Anthrax in Gilgit-Baltistan, Pakistan, 2018
- Natural Decline to Extinction of A New Zealand Rabbit Population
- Mitochondrial Bio-Logistics: Steering Co-Enzyme Q10 and Lycopene Synergies within the Science 4.0 Bio-OS Framework
- Hymenoptera Specimens from the Caño Negro Wetland, of the National Museum Collection, Costa Rica