The Value of Higher Order Aberrations Generated by the Lens in Three Groups of Patients Qualified for Lens Removal
Purpose: to determine if Higher Order Aberrations generated by the lens can influence on the visual acuity, in eyes qualified to lens removal. Methods: Three groups of patients (171 eyes) who were qualified to lens removal because of diagnosed cataract, untolerated refractive error, or not yet diagnosed Congenital Lens Dysfunction were examined preoperatively for the values of Higher Order Aberrations generated by the lenses. Each patient was examined using iTrace analyser, which allows for the separation of aberrations generated by the cornea from those generated by the inside of the eye. Results: The average values were statistically the lowest in the group of patients qualified for refractive lens exchange (85 eyes), reaching the level of 0.170 μm. In this group, the natural lens was completely transparent. In the group with cataract (59 eyes) the values were statistically higher, reaching an average value of 0.350μm. In the third group with the so-called Congenital Lens Dysfunction (27 eyes) the values were the highest, reaching an average level of 1.020μm. Conclusions: As the value of aberrations generated by the inside of the eye (mainly lens) increased, visual acuity to far distances, assessed preoperatively and with best correction, deteriorated statistically
Introduction
The value of higher order aberrations (HOA) generated by the lens is a parameter not normally assessed. There seem to be several reasons. The lack of access to devices enabling the separation of HOAs generated by the cornea from HOAs generated by the lens and the lack of need to perform such an analysis seem to be the main reasons for this state of affairs. Most devices that assess the value of HOAs generated by the optical system of the eyeball focus on the assessment of HOAs generated by the cornea. Knowledge of this parameter is useful in many situations, e.g. in the qualification process for refractive surgery, assessment of the causes of poor visual acuity, but also in the case of the desire to perform appropriate qualification for the implantation of intraocular lenses with a complex structure [1, 2, 3, 4]. The iTrace analyser is a device that allows for the separation of HOAs generated by the cornea and HOAs generated mainly by the lens. In addition to the above separation, the device allows for graphical simulation of how the value of HOAs generated by individual elements of the eye’s optical system affects the quality of vision of letter “E” [5, 6]. Below an example result using module “Dysfunctional Lens Patient Display” by iTrace (Figure 1).
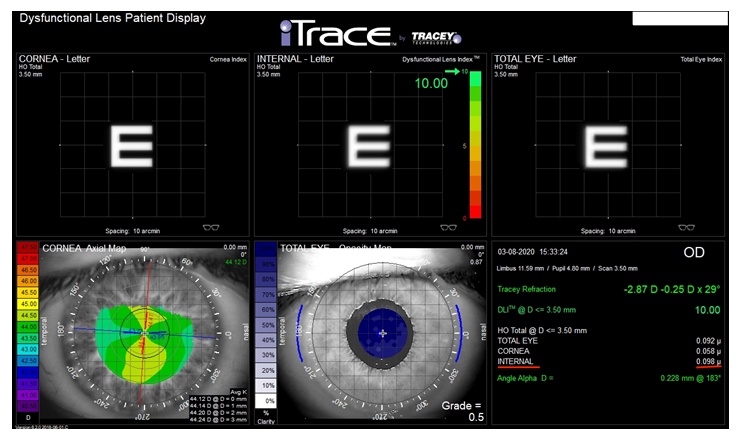
Figure 1: An example test result using one of the modules available in the iTrace analyser - Dysfunctional Lens Patient Display. It graphically shows how individual elements of the optical system, i.e. the cornea (top left) and the lens (top centre) and both elements together (top right) reproduce the quality of letter “E”, taking into account the HOA values generated by these structures. The HOA values are shown in numerical form below (bottom right). The value of HOA Internal generated by the lens is marked with a red line.
This extremely useful simulation can be used in several situations. Increased values of HOA generated by the lens are observed in patients with cataract [7]. In the process of qualifying for cataract removal, a graphic presentation of how the opaque lens adversely affects the quality of vision may be a factor motivating the patient to have it removed. In some cases, when a patient with diagnosed cataract, despite having good vision to far distances, e.g. at the level of 0.2-0.3 log Mar, states that his/her vision is poor, this test allows for the confirmation or exclusion of lens opacity as the cause of this state of affairs (Figure 2).
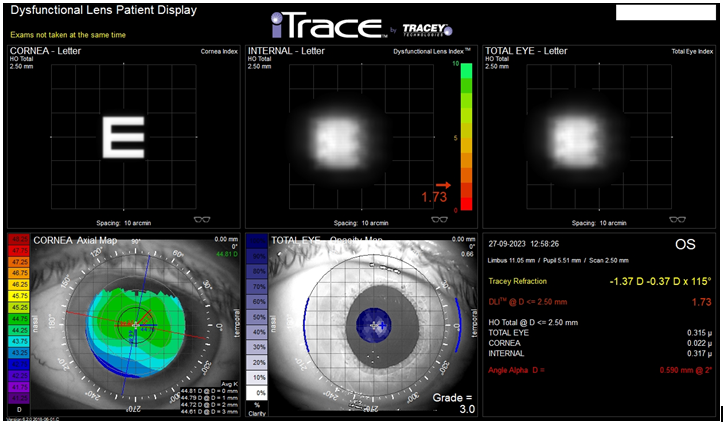
Figure 2: An example of the result using Dysfunctional Lens Patient Display module. This examination was made in the eye of 62y.o male, who started to complain with poor quality of vision in his left eye. BCVA to far distances reached 0,2 logMar, so he was disqualified to cataract removal. This examination shows how the cornea (top left panel) like also the lens (top middle panel) can influence on the quality of vision of the “E” letter. The HOA generated by the cornea reached 0,022 µm, by the Internal (lens) 0,317 µm. The final quality of vision, named as TOTAL EYE (top right panel) shows how probably a quality of vision of the patient is’s left eye. Values of HOA generated by the cornea, the entire of the eye, mainly the lens (Internal) and total HOA generated by both elements (TOTAL EYE) are seen in the bottom right panel.
Excluding the impact of the structure of the lens on the unclear cause of decreased visual acuity is another important reason why it is worth performing this test (author’s note). Knowing that the values of HOA generated by the lens are increased in eyes with diagnosed cataract, it can be assumed that the presence of a transparent, crystalline lens is associated with low HOA Internal values, and therefore, its low values will be found in eyes with good visual acuity. Such comparative studies have not been published yet.
The above assumption seems logical, but it becomes groundless in the case of the so-called Congenital Lens Dysfunction. The condition in which the completely transparent crystalline lens, with no structural abnormalities visible during slit lamp examination, generates abnormally high HOA values has been described by the authors of this article, drawing attention to the presence of an additional cause of eye defect, which has not been taken into account so far [6, 8]. The second of those articles was entitled “Congenital lens dysfunction as a new, undiagnosed cause of decreased visual acuity based on observation over a period of 3 years”.
Objective
Comparison of values of HOA generated by the natural lens in three groups of patients qualified for lens removal. The reasons for lens removal included: presence of cataract, desire to get rid of an existing refractive error (Refractive Lens Exchange - RLE) and the so-called Congenital Lens Dysfunction (CLD) not being diagnosed so far. The next goals are to determine whether there is a correlation between the preoperative visual acuity to far and near distances obtained with best correction and the values of HOA generated by the lens, as well as between the scope and type of the preoperative defect, pupil size and eyeball length.
Material and Methods
The study included 3 groups of patients with diagnosed cataract and those qualified for RLE. The third group consisted of patients with suspected CLD.
Inclusion Criteria
Values of HOA generated by the cornea were no greater than 0.200μm in all groups. No pathology in the cornea, vitreous body, the macula or optic nerve was diagnosed. Cataract group determination of the presence of lens opacity. Visual acuity to far distances with best correction (BCVA) ≥ 0.3 logMar. RLE group. No presence of lens opacity. Patients with any eye defect. BCVA ≤ 0.1 logMar.
Group CLD Decreased visual acuity to far distances and quality of vision, which does not improve despite best correction of the existing error, while maintaining full visual acuity to near distances, which was practically already detected in childhood. There are no detected or visible pathologies within all eye structures, including the cornea, lens (no opacification, spherophakia or lenticonus), retina, optic nerve and diseases outside the visual system found in the brain. The presence of mixed myopia, i.e. axial and refractive myopia accompanied by astigmatism. The value of astigmatism generated by the cornea is lower than the value generated by the optical system of the eye.
Exclusion Criteria
The presence of pathologies in the structure of the eye that may affect visual acuity. Amblyopia, Glaucoma, General diseases, including diabetes. The presence of lens opacity excluded the inclusion of the eye in the CLD group.
Examination Technique
The iTrace analyser was used to assess HOAs generated separately by the cornea (HOA corneal) and the lens (HOA Internal). The examination was repeated three times at short intervals of several minutes, without dilating the pupil, and the average value was analysed.
All above examinations were made in private medical centre Silesian Eye Treatment Centre from Zory (Poland) Statistical tests used The level of significance was p = 0.05. The level of significance is the maximum allowable probability of error consisting in rejecting the true null hypothesis H0, which assumes that the studied groups do not differ in terms of the feature of interest. Therefore, it is the level of requirements at which a decision is made to reject or accept the hypothesis. According to the above, results of p < 0.05 will mean the presence of significant correlations between variables. Non-parametric tests (Mann-Whitney U test or Kruskall-Walis test) were used to analyse quantitative variables presented by group. In order to examine the existence of a correlation between variables, Spearman’s rank correlation coefficient was used.
The Hypotheses here are as Follows
- H0: there is no significant correlation between the variables.
- H1 (alternative): there is a significant correlation between the variables.
- The tests were selected based on the distribution of variables, which was verified with the Shapiro-Wilk test. The calculations were performed in the R statistical environment ver. 3.6.0, PSPP and MS Office 2019.
Results
The characteristics of the study group included in the analysis, in terms of gender, number of eyes and the type of diagnosed preoperative defect, are presented in Table 1.
| Group | |||||
|---|---|---|---|---|---|
| Cataract RLE | CLD | ||||
| Sex | female | N | 30 | 47 | 14 |
| Sex | female | % | 48.40% | 55.30% | 48.30% |
| Sex | male | N | 32 | 38 | 15 |
| Sex | male | % | 51.60% | 44.70% | 51.70% |
| Eye Effect | myopia | N | 39 | 29 | 2 |
| Eye Effect | myopia | % | 62.90% | 34.10% | 6.90% |
| Eye Effect | hyperopia | N | 16 | 41 | 0 |
| Eye Effect | hyperopia | % | 25.80% | 48.20% | 0.00% |
| Eye Effect | myopic astigmatism | N | 2 | 6 | 23 |
| Eye Effect | myopic astigmatism | % | 3.20% | 7.10% | 79.30% |
| Eye Effect | hyperopic astigmatism | N | 1 | 3 | 4 |
| Eye Effect | hyperopic astigmatism | % | 1.60% | 3.50% | 13.80% |
| Eye Effect | astigmatism | N | 4 | 6 | 0 |
| Eye Effect | astigmatism | % | 6.50% | 7.10% | 0.00% |
Table 1: Characteristics of the group by type of procedure.
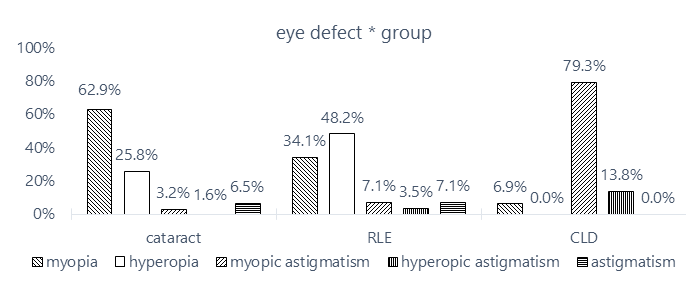
The analysis included 62 eyes with diagnosed cataract and 85 eyes undergoing RLE. The smallest group were patients with diagnosed Congenital Lens Dysfunction (CLD) - 29 eyes.
Myopia predominated in the cataract group and hyperopia in the RLE group. Patients with suspected CLD were mainly diagnosed with myopic astigmatism. Eyes with diagnosed hyperopic astigmatism, despite being included in this group, were ultimately removed from it due to the inability to determine a clear cause of reduced visual acuity to far distances.
The distribution of eye defects by type of procedure is presented in the form of Figure 3.
Descriptive Statistics
Descriptive statistics are included in Table 2.
| Group | N | M | SD | Min | Max | Me | |
|---|---|---|---|---|---|---|---|
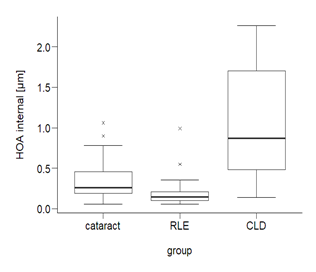
| HOA Internal [μm] | cataract | 59 | 0.35 | 0.22 | 0.06 | 1.06 | 0.26 |
| HOA Internal [μm] | RLE | 85 | 0.17 | 0.12 | 0.06 | 0.99 | 0.15 |
| HOA Internal [μm] | CLD | 27 | 1.02 | 0.67 | 0.14 | 2.26 | 0.87 |
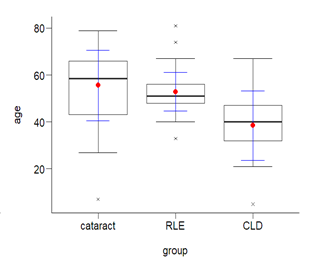
| Age | cataract | 62 | 55.63 | 15 | 7 | 79 | 58.5 |
| Age | RLE | 85 | 52.86 | 8.2 | 33 | 81 | 51 |
| Age | CLD | 29 | 38.48 | 14.8 | 5 | 67 | 40 |
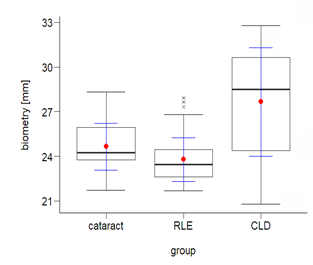
| Biometry [mm] | cataract | 60 | 24.65 | 1.58 | 21.73 | 28.3 | 24.2 |
| Biometry [mm] | RLE | 82 | 23.78 | 1.45 | 21.69 | 27.9 | 23.5 |
| Biometry [mm] | CLD | 29 | 27.65 | 3.63 | 20.79 | 32.8 | 28.5 |
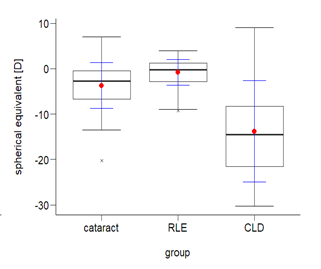
| Spherical Equivalent [D] | cataract | 62 | -3.71 | 5.08 | -20.3 | 7 | -2.7 |
| Spherical Equivalent [D] | RLE | 85 | -0.85 | 2.85 | -9.25 | 4 | -0.3 |
| Spherical Equivalent [D] | CLD | 29 | -13.78 | 11.1 | -30.3 | 9 | -15 |
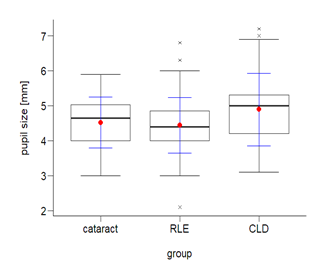
| Pupil Size [mm] | cataract | 56 | 4.52 | 0.72 | 3 | 5.9 | 4.65 |
| Pupil Size [mm] | RLE | 83 | 4.44 | 0.79 | 2.1 | 6.8 | 4.4 |
| Pupil Size [mm] | CLD | 29 | 4.89 | 1.04 | 3.1 | 7.2 | 5 |
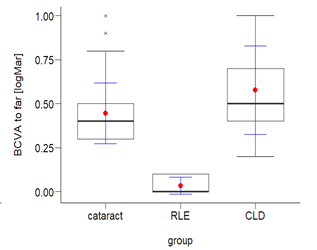
| BCVA to far [logMar] | cataract | 60 | 0.45 | 0.17 | 0.3 | 1 | 0.4 |
| BCVA to far [logMar] | RLE | 83 | 0.03 | 0.05 | 0 | 0.1 | 0 |
| BCVA to far [logMar] | CLD | 26 | 0.58 | 0.25 | 0.2 | 1 | 0.5 |
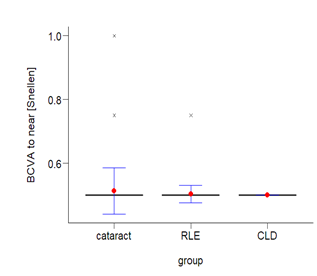
| BCVA to near [Snellen] | cataract | 59 | 0.51 | 0.07 | 0.5 | 1 | 0.5 |
| BCVA to near [Snellen] | RLE | 85 | 0.5 | 0.03 | 0.5 | 0.75 | 0.5 |
| BCVA to near [Snellen] | CLD | 28 | 0.5 | 0 | 0.5 | 0.5 | 0.5 |
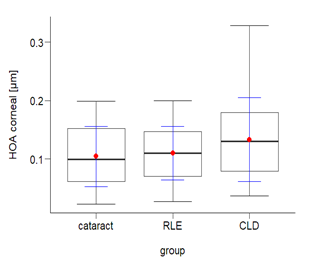
| HOA corneal [μm] | cataract | 58 | 0.1 | 0.05 | 0.02 | 0.2 | 0.1 |
| HOA corneal [μm] | RLE | 85 | 0.11 | 0.05 | 0.03 | 0.2 | 0.11 |
| HOA corneal [μm] | CLD | 29 | 0.13 | 0.07 | 0.04 | 0.33 | 0.13 |
| N - number; M - mean; SD - standard deviation; Min - minimum; Maks - maximum; Me - median | |||||||
Table 2: Descriptive statistics by type of procedure.
Below is an illustration of the variables on Figures 4-11.
| Group | χ² | df | p | Min | Maks | Me | |
|---|---|---|---|---|---|---|---|
| HOA internal [μm] | cataract | 69 | 2 | < 0.001 | 0.06 | 1.06 | 0.26 |
| HOA internal [μm] | RLE | 69 | 2 | < 0.001 | 0.06 | 0.99 | 0.15 |
| HOA internal [μm] | CLD | 69 | 2 | < 0.001 | 0.14 | 2.26 | 0.87 |
| χ² - test statistics; df - degrees of freedom; p - statistical significance; Min - minimum result; Max - maximum result; Me - median | |||||||
Table 3: Test of the dependence of the HOA internal value on the type of procedure.
| Group | χ² | df | p | Min | Maks | Me | |
|---|---|---|---|---|---|---|---|
| HOA internal [μm] | cataract | 69 | 2 | < 0.001 | 0.06 | 1.06 | 0.26 |
| HOA internal [μm] | RLE | 69 | 2 | < 0.001 | 0.06 | 0.99 | 0.15 |
| HOA internal [μm] | CLD | 69 | 2 | < 0.001 | 0.14 | 2.26 | 0.87 |
| χ² – test statistics; df – degrees of freedom; p – statistical significance; Min – minimum result; Max – maximum result; Me – median | |||||||
| In terms of HOA internal, the groups selected according to the type of procedure differ statistically significantly (p < 0.05). To precisely determine between which groups the differences were significant, a post hoc Bonferroni test was performed - pairwise comparison. Its results are presented in the Table 4. | |||||||
| HOA internal [μm] | group | p | |||||
| HOA internal [μm] | cataract | RLE | 0.004 | ** | |||
| HOA internal [μm] | cataract | CLD | < 0.001 | *** | |||
| HOA internal [μm] | RLE | CLD | < 0.001 | *** | |||
| * p < 0.05; p < 0.01; * p < 0.001; p – statistical significance | |||||||
Table 4: Test of the dependence of the HOA internal value on the type of procedure-pairwise comparison.
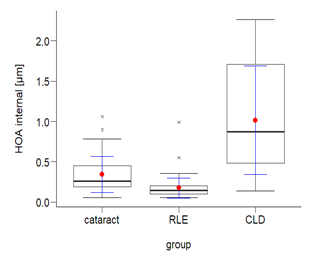
There were significant statistical differences (p < 0.05) between patients with CLD, patients with cataract and patients undergoing RLE. Among half of the patients with cataract, the HOA value was not greater than Me = 0.26 (among the other half, this value was not less than Me = 0.26). Among half of the patients undergoing refractive lens exchange, the HOA value was not greater than Me = 0.15 (among the other half, it was not less than Me = 0.15). Among half of the patients with congenital lens dysfunction, the HOA value was not less than Me = 0.87 (among the other half, it was not greater than Me = 0.87).
The test showed that the HOA internal value in the group of patients with cataract was statistically significantly (p < 0.05) higher than in the group of patients undergoing refractive lens exchange, and in the group of patients with congenital defects it was significantly higher than in the other groups. In other words, the HOA value was the highest among patients with congenital lens defects and the lowest among patients who underwent refractive lens exchange.
The assumed hypothesis was positively verified, which allowed it to be accepted - the type of procedure significantly differentiates the values of HOA internal. The distribution of variables is illustrated below (Figure 12).
Hypothesis 2
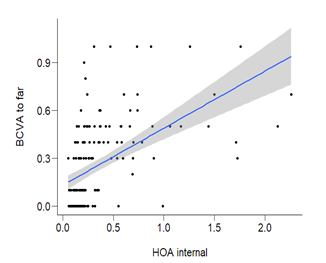
There is a significant correlation between the HOA internal value and best-corrected visual acuity to far and near distances.
The analysed variables were quantitative, therefore the correlation coefficient was used. The type of coefficient used was determined by the nature of the distribution of variables, which was verified with the Shapiro Wilk test (Table 5).
| BCVA to far [logMar] | BCVA to near [Snellen] | |||
| HOA internal [μm] | rho | 0.618 | *** | -0.127 |
| HOA internal [μm] | p | <0.001 | 0.102 | |
| rho-Spearman's correlation coefficient; p-significance, | ||||
|---|---|---|---|---|
| *p<0.05;p<0.01;*p<0.001 | ||||
Table 5: Test of the correlation between HOA internal and best-corrected visual acuity to far and near distances.
There was a statistically significant correlation (p < 0.05) between HOA internal and best-corrected visual acuity to far distances. The correlation was strong, as evidenced by the value of the rho coefficient <= 0.7. It was a positive correlation, which means that the greater the HOA internal, the significantly worse visual acuity (higher logMar values). The hypothesis was accepted in this regard. The distribution of variables is presented below (Figure 13).
There was no statistically significant correlation (p > 0.05) between HOA internal and best-corrected visual acuity to near distances. The hypothesis was negatively verified in this respect, which resulted in its rejection.
Hypothesis 3
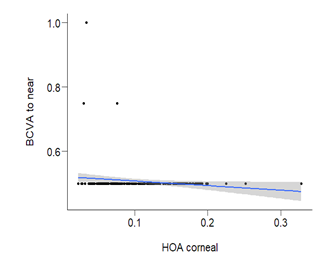
There is a significant correlation between corneal HOA and best-corrected visual acuity to far and near distances (Table 6).
| BCVA to far [logMar] | BCVA to near [Snellen] | |||
|---|---|---|---|---|
| HOA corneal [μm] | rho | 0.066 | -0.177 | $\cdot$ |
| HOA corneal [μm] | p | 0.399 | 0.022 | |
| rho - Spearman’s correlation coefficient; p - significance, | ||||
| * p<0.05; p<0.01; * p<0.001 | ||||
There was a statistically significant correlation (p < 0.05) between the corneal HOA value and visual acuity to near distances. The correlation was weak, as evidenced by the value of the rho coefficient <= 0.3. It was a negative correlation, which means that the higher the corneal HOA values, the worse the best-corrected visual acuity to near distances. In this respect, the hypothesis was accepted. However, there was no statistically significant correlation (p > 0.05) between the corneal HOA value and best-corrected visual acuity to far distances (Figure 14). The hypothesis in this respect was rejected.
Hypothesis 4
The eye defect significantly differentiates the HOA internal value. For the purposes of the study, the myopia category was merged with the myopic astigmatism category, and the hyperopia category was merged with the hyperopic astigmatism category. The astigmatism category was completely excluded from the study. After checking the assumptions of normality of distribution, it was justified to use the non-parametric Mann-Whitney U test, comparing the medians of the dependent variable in individual groups. The results of the Mann-Whitney U test for independent samples are presented in the Table 7.
| Descriptive statistics | ||||||
|---|---|---|---|---|---|---|
| U | p | Min | Max | Me | ||
| eye defect | HOA internal [μm] | 1846.5 | < 0.001 | |||
| eye defect | myopia | 0.06 | 2.26 | 0.29 | ||
| eye defect | hyperopia | 0.06 | 0.99 | 0.17 | ||
| U – test statistics; p – statistical significance; Me – median; Min – minimum result; Max – maximum result | ||||||
Table 7: Study of the correlation between HOA internal and eye defect.
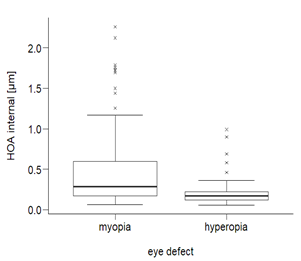
Among half of the patients with myopia, the HOA internal value was not less than Me = 0.29. The lowest result in this group was Min = 0.06, and the highest Max = 2.26. Among half of the patients with hyperopia, the HOA value was no greater than Me = 0.17. The lowest result was Min = 0.06, the highest Max = 0.99. Patients with myopia were characterized by statistically significantly (p < 0.05) higher HOA internal values than patients with hyperopia (Figure 15).
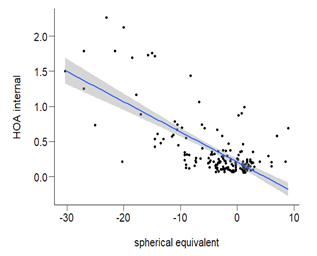
Hypothesis 5: There is a significant correlation between spherical equivalent and HOA internal value (Table 8).
| HOA internal [μm] | |||
|---|---|---|---|
| spherical equivalent [D] | rho | -0.496 | *** |
| spherical equivalent [D] | p | < 0.001 | |
| rho - Spearman’s correlation coefficient; p - significance, | |||
| * p<0.05; p<0.01; * p<0.001 | |||
Table 8: Test of the correlation between the spherical equivalent and HOA internal.
There was a statistically significant correlation (p < 0.05) between the spherical equivalent and the HOA internal value. The correlation was negative and moderately strong, as evidenced by the value of the rho coefficient <= 0.5.
This means that the higher the spherical equivalent values were, the significantly lower the HOA internal values. The hypothesis was accepted (Figure 16).
Hypothesis 6: There is a significant correlation between pupil size and HOA internal. There was a statistically significant correlation (p < 0.05) between the pupil size and the HOA internal value. The correlation was positive and weak. Therefore, the larger the pupil size, the significantly higher the HOA internal values. The hypothesis was accepted (Figure 17, Table 9).
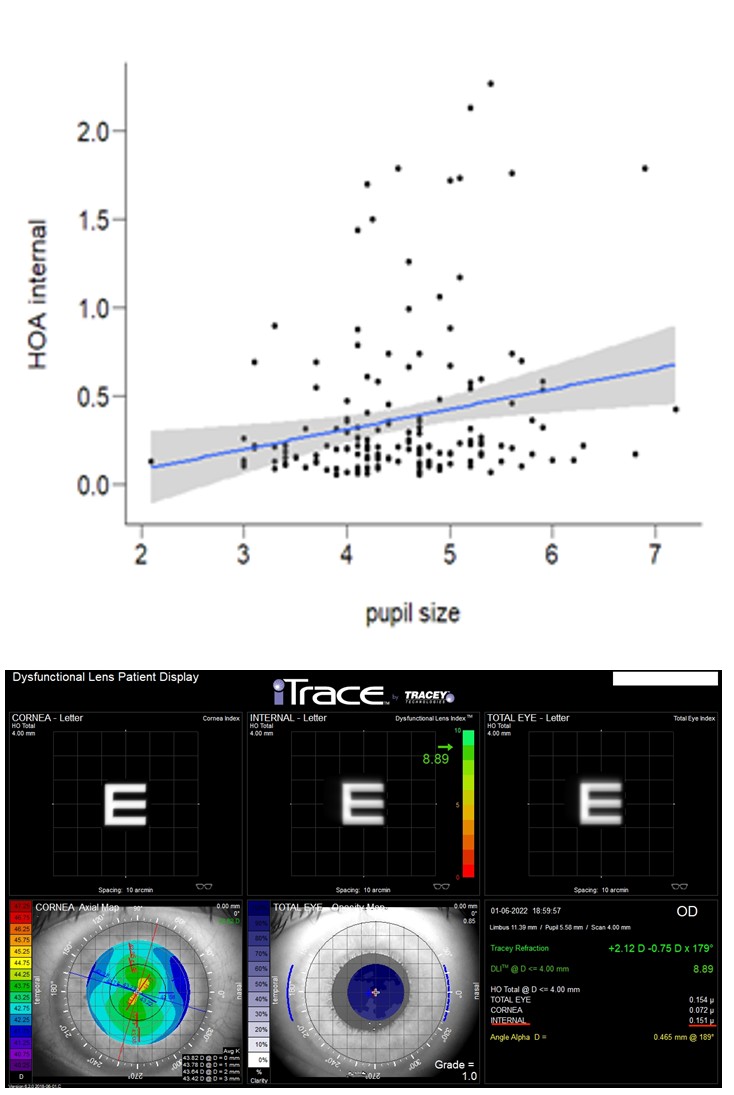
| HOA internal [μm] | |||
|---|---|---|---|
| pupil size [mm] | rho | 0.213 | $\cdot$ |
| pupil size [mm] | p | 0.006 | |
| rho - Spearman’s correlation coefficient; p - significance, | |||
| * p < 0.05; p < 0.01; * p < 0.001 | |||
Table 9: Test of the correlation between pupil size and HOA internal.
Examples of results obtained in all groups in terms of HOA values generated by the lens and cornea, as well as their impact on the quality of vision, showed graphically, are presented below in Figures 18a-c.
Figure 18a: Test result using the Dysfunctional Lens Patient Display module, iTrace analyser. The patient was qualified for the RLE procedure. The red line shows the HOA INTERNAL value generated by the lens (0.151 µm). A low HOA INTERNAL value corresponds to the graphical representation of letter “E” (middle, top panel).
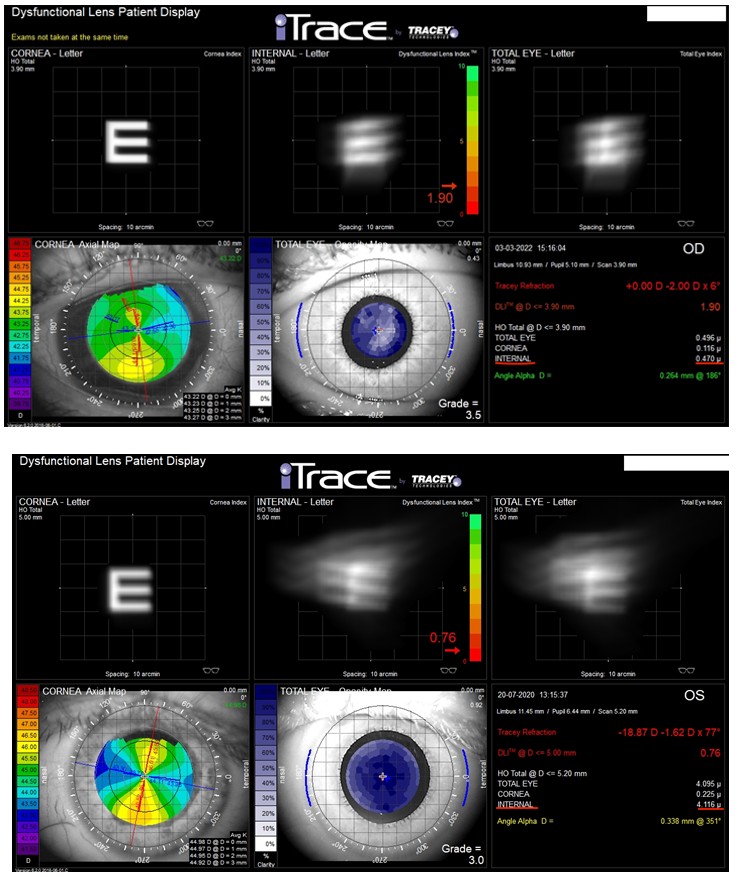
Figure 18b: The patient was qualified for cataract removal. The red line shows the HOA INTERNAL value generated by the lens (0.470 µm). A high, abnormal HOA INTERNAL value corresponds to the graphical representation of significantly blurred “E” (middle, upper panel), which reflects poor quality of vision due to the presence of cataract.
Figure 18c: The patient was scheduled for removal of the lens from the left eye due to its CLD. The red line shows the HOA INTERNAL value generated by the lens (4.116µm). The very high, incorrect HOA INTERNAL value corresponds to the graphical representation of virtually unrecognizable letter “E” (top middle panel). The result suggests the presence of mature cataract (Dysfunctional Lens Index™, top medium), despite the presence of a completely transparent lens, free from opacity and other visible pathologies. This is a characteristic feature of congenital lens dysfunction. Preoperative BCVA is far = 0.7 logMar, postoperative = 0.5 logMar.
Discussion
What was the purpose of assessing the value of HOAs generated by the lens in these three groups of patients? Most of all, drawing attention to the fact that high HOA values are associated not only with a decrease in the quality of vision, but also in deterioration of visual acuity to far distances.
What do these three groups have in common and how do they differ?
The lack of visible pathologies during speculum examination of the lens is a common feature of the RLE and CLD groups. The above groups differ with the value of HOAs generated by the lens.
High, abnormal HOA values generated by the lens constitute a common feature of the cataract and CLD groups. What differs these groups is the lack of visible opacity and other pathologies in the lens of patients with CLD, as opposed to the cataract group.
The lowest HOA values were obtained in the RLE group, with an average value of 0.17 μm, and an average preoperative BCVA value to far distances of 0.03 logMar. The highest HOA values were obtained in the CLD group, at the level of 1.02 μm, with an average BCVA value to far distances of 0.58 logMar, but no visible signs of lens pathology. This creates an apparent contradiction that can, however, be explained.
Analysing the results of studies conducted by other authors, no statistical differences in pre- and postoperative visual acuity to far distances were found in the RLE group [10, 11]. In the CLD group, visual acuity to far distances improved postoperatively, but did not reach normal values, as in eyes after cataract removal [11, 12]. How is this possible?
CLD is a previously undiagnosed cause of deterioration of the quality of vision and visual acuity to far distances, in which the only cause of this state of affairs are very high HOA Internal values generated mainly by the lens. The highest values generated in this group exceeded 2.200 μm, despite the presence of a transparent crystalline lens without visible pathologies. Such high values are accompanied by deterioration of visual acuity to far distances and a significant impairment in the quality of vision [8].
To make a diagnosis of CLD (Congenital Lens Dysfunction), several of the following symptoms must be present:
- Poor quality of vision and reduced BCVA to far distances, while maintaining good vision to near distances, despite the use of best correction of the existing refractive error. From an early age, it is difficult to choose the right correction for such patients, and doctors look for other causes of abnormal vision than the lens.
- The presence of severe or moderate myopia with accompanying astigmatism, with myopia most often of a mixed nature, i.e. axial-refractive, and astigmatism of the optical system differs in value and axis from corneal astigmatism.
- No pathology in other eye structures apart from the generation of abnormally high HOA values by a lens that is normal during speculum examination (iTrace examination).
- Removal of the dysfunctional lens results in improvement in the quality of vision and visual acuity to far distances, but normal values cannot be expected, as is the case with cataract removal, in eyes that had normal visual acuity before the opacity appeared [11, 12]. The presence of a dysfunctional lens (abnormally high HOA values generated by the lens) causes inability to develop normal vision to far distances (amblyopia).
Conclusions
The statistical analysis performed showed that the HOA Internal value was the highest among patients with Congenital Lens Dysfunction and the lowest among patients who underwent refractive lens exchange. The greater the HOA Internal, the significantly worse the best-corrected visual acuity to far distances. There was no significant correlation between the HOA internal value and visual acuity to near distances. Patients with myopia were characterized by significantly higher HOA internal values than patients with hyperopia. The higher the spherical equivalent values, the significantly lower the HOA internal values. The larger the pupil size, the significantly higher the HOA internal values (Table 9).
References
-
Mirzajani A, Aghataheri S, Ghoreishi M, Jafarzadepour E, Mohammadinia M (2016) Evaluation of corneal higher order aberrations in normal topographic patterns. J Curr Ophthalmol 28(2): 75-80.
-
Sawides L, Gracia PD, Dorronsoro C, Webster M, Marcos S (2011) Adapting to blur produced by ocular high-order aberrations. J Vis 11(7): 10.
-
Cywinski A, Bloch D, Lubczyk A (2022) Visual Function after Implantation of Multifocal Lens ACUNEX® VARIOMAX, Positioned in Two Variants, according to the Axis of Angle Kappa. J Ophthalmol 7(1): 000240.
-
Cywinski A, Bloch D, Lubczyk A (2022) Assessment of the Value of Astigmatism Generated by Two Models of Spherical Multifocal Lenses: Panoptix® by Alcon® and Acunex® Variomax® by Teleon® using the Toric Alignment Check Module of the Itrace Analyser. J Ophthalmol 7(2): 000244.
-
Gurnani, Bharat, Kaur, Kirandeep (2021) iTrace aberrometry - Identifying occult imperfections in the visual system. Kerala Journal of Ophthalmology 33(3): 373-383.
-
Cywinski A (2020) Usefulness of itrace in Diagnosing Unclear Cases of the Deterioration in Visual Acuity. Congenital Lens Dysfunction as a New Disease Entity. Preliminary Reports. Journal of Bioscience & Biomedical Engineering 1(3): 12.
-
Lee J, Kim MJ, Tchah H (2008) Higher-order aberrations induced by nuclear cataract. J Cataract Refract Surg 34(12): 2104-2109.
-
Cywinski A, Michulec M, Bloch D, Lubczyk A (2023) Congenital lens dysfunction as a new, undiagnosed cause of decreased visual acuity based on observation over a period of 3 years. JOJ Ophthalmol 10(1): 555777.
-
Alió JL, Grzybowski A, Romaniuk D (2014) Refractive lens exchange in modern practice: when and when not to do it? Eye Vis 1: 10.
-
Schallhorn SC, Schallhorn JM, Pelouskova M, Venter JA, Hettinger KA, et al. (2017) Refractive lens exchange in younger and older presbyopes: comparison of complication rates, 3 months clinical and patient- reported outcomes. Clin Ophthalmol 28(11): 1569-1581.
-
Ahsan S, Memon MS, Bukhari S, Mahmood T, Fahim MF, et al. (2021) Visual outcomes of cataract surgery: An observational study of ten years from a tertiary eye care hospital in Pakistan. Pak J Med Sci 37(7): 1775-1781.
-
Han X, Zhang J, Liu Z, Tan X, Jin G, et al. (2023) Real- world visual outcomes of cataract surgery based on population-based studies: a systematic review. Br J Ophthalmol 107(8): 1056-1065.
- Screening of Hospital Staff During World Glaucoma Week in a Tertiary Eye Care Centre
- Angioid Streaks with Macular Neovascularization: Clinical Insights from Two Cases
- Giant Kissing Naevus: An Oculoplastic Challenge
- Why Freedom of Vision Should Not Cost the Freedom of Feeling - LASIK in the Climate of Change
- Asymmetric Optic Nerve with Small Disc and Large Cup: A Rare and Challenging Case of Unilateral Optic Nerve Hypoplasia
- Large Angle Exotropia in a Child: A Case Report