Dolphin (Globicephala Macrorhynchus) Middle Ear: Can Ossicle Asymmetry Aid Locating the Source of Incoming Sounds?
The survival of biological organisms depends upon their ability to nourish, reproduce and find shelter. Nourishment for a predator depends on finding prey. In the absence of sight (e.g., underwater; at night), sound has been evolutionarily favored as a means of remote-detecting prey. This may include echolocation, resembling the man-made sonar under water, turning a mute prey into a sounding object. Cetaceans (dolphins and whales) use acoustic cues, including active sounding in the ultrasonic range, to determine the locations and identities of environmental stimuli in their underwater habitats. Dolphins (Odontoceti) have evolved unique auditory systems for spatially differentiating ultrasonic signals. The aim of this paper is to find out whether directional asymmetry that may support location exists in the dolphin middle ear, and if so, whether it is age or sex linked. We measured the auditory ossicles of 34 pairs of the peripheral hearing organ of Globicephala macrorhynchus: On both sides, the weights and lengths of each of the three ossicles, the area of the stapes footplate, and the angle between incus and stapes; and computed a ratio between ossicle mass and stapedial footplate area. The left-side ossicles were on average heavier, and the angle between the incus and stapes greater in the left ear. We found no significant age- or sex-linked differences with respect to these asymmetries. We propose how the asymmetries may help the animal locate its prey, especially in the vertical plane.
Introduction
The survival of biological organisms depends upon their ability to nourish, reproduce and find shelter.
Nourishment for a predator depends on finding its prey. In the absence of sight (for example, deep under water or at night), sound has been evolutionarily favored as a means of remote-detecting prey. This may involve active echolocation, similar to the human-made sonar under water, or the biological sonar used by bats, turning a mute prey into a sounding object. Cetaceans (dolphins and whales) are aquatic mammals, totally adapted to life in water, and use acoustic cues to determine the locations and identities of environmental stimuli in their underwater habitats. Dolphins (Odontoceti) have evolved unique auditory systems for spatially differentiating ultrasonic signals [1].
Their middle ear anatomy has radically specialized for hearing in water. Thus, the tympanic and periotic bones are synostosed into one unit, the tympano-periotic complex, TPC, which encloses the middle ear cavity and the ossicles [2, 3, 4] as well as the cochlea.
This TPC is well isolated acoustically from the rest of the skull, with air sinuses and fatty tissue surrounding it [5, 6]. In this way, the ears are protected from interference from skull vibrations, thus enabling binaural hearing, which is essential for echolocation as well as locating the source of any incoming acoustic waves. Sensitive ears, coupled with a massive auditory central nervous system, are fundamental to the dolphins’ extensive use of sound for communication and echolocation [7]. Most odontocete species have fine-scale frequency discrimination abilities: They can process sounds rapidly, compensating for both the faster underwater sound speed (approx. 5 times higher than the speed of sound in air), as well as enabling and providing the complex requirements for echolocation. Furthermore, odontocetes have developed a novel mechanism to receive sounds through specialized acoustic fats associated with their lower jaw.
The aim of this paper is to find out whether directional asymmetry exists in the middle ears of Globicephala macrorhynchus (the short-finned pilot whale), and whether it is age or sex linked or both.
Asymmetry is defined as the deviation of an organ or organism from perfect symmetry with respect to a given plane, and can be grouped into three categories [8]. (1) Directional Asymmetry: This occurs whenever there is normally a greater development of a character on one side of the plane of symmetry than on the other, for example the human heart. (2) Fluctuating Asymmetry [9]: This is the asymmetry which results from the inability of an organism to develop in precisely determined paths. (3) Antisymmetry: which refers to the apparently less common situation where asymmetry is normally present but it is variable which side has greater development. A familiar example would be a human population with right- and left-handed, and a few ambidextrous, individuals. An example of directional asymmetry in the auditory system of a land-dwelling vertebrate is in the location of the external ear opening on the skull of the barn owl (Tyto alba) and boreal owl (Aegolius funereus) among other owls that, as best known in T. alba, provides the owl with azimuth-like information in the vertical plane about the location of its rustling prey [10].
Here we address the question whether left/right asymmetries also include the middle ears that transmit the auditory waves to the cochlea. We measured the following characters of the auditory ossicles in the peripheral hearing organ of Globicephala macrorhynchus: the weights and the lengths of all three ossicles, the area of the stapes footplate, and the angle between the incus and stapes; and we innovated a computed ratio between ossicle mass and stapedial footplate area. In some of these characters we found significant left/right differences. We propose how these may help to sort out spatial ambiguities of the source of sounds, especially in the vertical plane, with particular attention to echoes of the animal’s echolocation clicks.
More generally, we analyze how the differences between water and air affect the interaural cues commonly used in land mammals to locate the source of incoming sounds: the interaural time difference (ITD), intensity difference (IID) and phase difference (IPD). The speed of sound in water is five times greater than in air, and this alone makes location based on these cues more challenging.
Materials and Methods
Biological Material
Appendix 1 of this manuscript shortly the salient features of Globicephala macrorhyncus.
The study was carried out on both sides of thirty-four pairs of the peripheral hearing organ (TPC) of the short- finned pilot whale, Globicephala macrorhynchus, described in Appendix 1: Seven males, 21 females and six juveniles. For ethical considerations and for details on how fresh TPCs were legally obtained in Japan, preserved and prepared, see Tsur, et al. [11]. The structures were cleaned of all soft tissues (muscle and connective tissue remnants) and dried as described below.
Measurements
Weight of the Ossicles: The weights of the malleus, incus and stapes of both ears were measured with an electronic scale (Sartorius CP225D) up to six digits after the decimal point, in grams. The ossicles had been dried until they did not show a change of weight for three consecutive measurements, taken at least 10 days apart. Weighing was done three times for each ossicle in a closed chamber of the electronic scale. Length of the Ossicles: The lengths of the ossicles were measured with a digital caliper having a resolution of 0.01 mm. Each measurement was repeated three times and the average taken for calculation.
their age was determined from decalcified preparations as described in Tsur et al. [11]. Sex: For testing for differences between sexes we had seven males and twenty one females. Angles between the Ossicles: Measurements were made from images obtained with a CT scanner (General Electric) as illustrated in Figure 1. The ears were positioned in an exact upright angle, held on plasticine “blocks” and taken through the scanner. Looking at the resultant images through the computer, we chose the best three views, where all ossicles appeared on the screen in the same projection with respect to the surrounding tympanic and periotic bones. These images were then printed onto blank paper and the angle between the malleus-incus as a unit and the stapes (the incudo- stapedial angle) was measured as described by Skinner, et al. [13] for human ossicles (Figure 1).
The area of the stapes footplate viewed from top of the footplate: the axes were measured with the digital caliper (three measurements) and the area calculated as described by Hemilä, et al. [12]. A ratio defined by us [(mass of malleus+incus) / (area of stapes footplate)] and termed effective pressure (EP), was calculated for each individual from its average values and plotted Left vs. Right. Ageing: Teeth were extracted from each individual and
![Figure 1: The ears were positioned in an exact upright angle, held on plasticine “blocks” and taken through the scanner. Looking at the resultant images through the computer, we chose the best three views, where all ossicles appeared on the screen in the same projection with respect to the surrounding tympanic and periotic bones. These images were then printed onto blank paper and the angle between the malleus-incus as a unit and the stapes (the incudo- stapedial angle) was measured as described by Skinner, et al. [13] for human ossicles (Figure 1).](/fulltextimages/11421/fig_1.png)
Figure 1: Measurement of the Incudo-Stapedial Angle. A: Screenshot of a CT Image of a Peripheral Hearing Organ, with the Measuring Caliper of the CT Superimposed Over the Ossicles. The Millimetric Slices were Generated by the CT and A 3D Image was Produced, from which the Angle was Measured as Shown in Panels B-C; B: The Angle between the Incus and Stapes was Measured in the Intersection of the Lines Drawn Along them. This was done when both Ossicles came to a Full View. The Line of the Incus (on the Right) was Tangential to it, and that of the Stapes was the Longest Possible Through its Ends. The Angle here was 880. Three Measurements were Taken and Averaged for Each Ear. (Ear #110 Left); C: The Right Ear of the Same Individual (Ear #110 Right).
Statistics
The statistical analysis of the data is described in detail in Appendix 2.
Results
The data resulting from the measurements described above and their statistical analyses are summarized in Table 1 (for further details, Appendix 2). Due to some bona fide damage they derive from 34 right-left pairs of mallei, 33 pairs of incudes and stapedes, and 29 pairs of ears yielding uncompromised inter-ossicular angles (Figure 1).
In relation to our main question, the presence of bilateral asymmetry, additional to comparisons between the exact measures on the left and right (detailed in Appendix 2), a particularly useful comparison is the proportion of individual left-right pairs of ears where the character value is higher on one or the other side (values from the left ear denoted L, values from the right ear denoted R). In Table 1 column 3 shows that the proportions were almost without exception skewed towards the left. For all characters except stapes footplate area, the number of pairs with larger L was almost twice the number of pairs with larger R.
| 1 | 2 | 3 | 4 | 5 | 6 | 7 | 8 | 9 | ||
|---|---|---|---|---|---|---|---|---|---|---|
| n | Mean +- SEM | Proportion (L>R): (R>L) | P of the observed proportions if the underlying distribution is symmetrical (two-tailed p) | P of observed means of within- individual L-R difference, if the population mean is zero (two- tailed P) | Constants of regression line L vs. R | |||||
| Slope a | P if A=1 | Y-intercept b | P if B=0 | |||||||
| Ossicle mass (mg) | malleus | 34 | 0.163±0.0026 | 22:12 | 0.121 | 0.028 | 1.104 | 0.056 | neg 0.015 | 0.085 |
| incus | 33 | 0.048±0.009 | 22:11 | 0.082 | 0.032 | 1.128 | 0.011 | neg 0.006 | 0.019 | |
| stapes | 33 | 0.016±0.0003 | 23:10 | 0.07 | 0.265 | 0.876 | 0.378 | 0.002 | 0.301 | |
| Ossicle Length(mm) | malleus | 34 | 6.57±0.04 | 22:12 | 0.121 | 0.328 | 0.965 | 0.717 | 0.252 | 0.691 |
| incus | 33 | 3.69±0.02 | 20:13 | 0.296 | 0.079 | 0.916 | 0.119 | 0.326 | 0.104 | |
| stapes | 32 | 20:12 | 0.215 | 0.328 | 1.736 | 0 | neg 2.055 | 0.003 | ||
| Incudo- stapedial angle (deg) | 29 | 89±0.68 | 19:10 | 0.136 | 0.031 | 1.027 | 0.89 | 0.959 | 0.956 | |
| Stapes foot plate area (mm2) | 33 | 8.5±0.14 | 17:16 | 1 | 0.403 | 2.214 | 0 | neg 10.612 | 0 | |
| Effective pressure | 33 | 0.0249±0.0004 | 22:11 | 0.08 | 0.219 | 1.453 | 0.2 | neg 0.033 | 0.028 |
Table 1: Values and Statistical Parameters for the Eight Measured Characters and the Derived Character “Effective Pressure”. Colu
Table 1: Values and Statistical Parameters for the Eight Measured Characters and the Derived Character “Effective Pressure”. Columns: (1) N = The Number of Individuals Studied (Each Providing one Right and One Left Middle Ear). (2) The Mean ± Standard Error of the Measured Values. (3) The Numbers of Individuals where the Value Measured from the Left Ear (L) was Larger than that Measured from the Right Ear (R), and Vice Versa. (4) the Probability of Getting a Sample Equally or Biased Towards Either L or R Under the Zero Hypothesis that the Underlying Distribution is Symmetrical. Binomial Two-Tailed Probabilities. (5) Significance of the Deviation of the Mean of Within-Individual L-R Differences from 0. (The Actual Values Are Not Shown.) Paired- Values T-Test, Two-Tailed Probabilities under the Zero Hypothesis that there is no L-R difference within Individuals on Average. (6 – 9) the Slopes (A) and Y-Intercepts (B) Obtained by Linear Reduced Major Axis (RMA) Regression L Vs. R, and the Statistical Significances of their Deviations from, Respectively, 1 and 0 (I.E., from Perfect L-R Isometry).
Conventionally Significant P-Values (P < 0.05) Are Shown In Red; “Suggestive” P-Values (P < 0.1) Are Shown In Green.
Yet, the deviations from equal proportions (0.5:0.5) did not reach statistical significance on a two-tailed binomial test, as shown by the P-values in column 4. Two-tailed testing gives the sum of probabilities for deviations exceeding a certain limit to the left or to the right under the zero hypothesis H0: the population mean of L = the population mean of R. However, as the observed distributions were all skewed to the left, it may be hypothesized that they are part of a general asymmetry entailing stronger growth of left-side structures, and thus consider one-tailed probabilities only (for column 3, the probability of “left-ward” chance deviations from equal proportions, 0.5:0.5). These one-tailed probabilities are: malleus mass p=0.061, incus mass p=0.041 and stapes mass p=0.035, allowing rejection of the zero hypothesis at least for the two latter (applying the conventional P < 0.05 level). Given that, in addition, the means of the within-individual L-R mass differences for the mallei and the incudes across all individuals were statistically significantly different from zero (column 5: P = 0.028 and P = 0.032, paired-values t-tests), we conclude that all three ossicles are heavier on the left-hand side.
By contrast, within-pair comparisons of ossicular lengths allow no firm conclusion. The proportions of individuals with L>R and R>L in column 3 do look similarly skewed as for the ossicular masses, but the deviations from the zero hypothesis of equal proportions are not statistically significant even on a one-tailed test. Neither are the means of within-individual L-R length differences; only for the incus does it reach a level that would be significant on a one-tailed test.
Besides the ossicular masses, a fourth statistically significant asymmetry was found for the incudo-stapedial angle, which was larger on the left-hand side even on a two-tailed test (P = 0.031, paired-values t-test).
Since there was no significant L-R difference in stapes footplate area, one might expect from the difference in ossicle masses that the derived character “effective pressure” would be larger on the left-hand side. In terms of statistically significant differences, this showed up only as L>R dominance in column 3, the proportion approximately paralleling those found for all the ossicles (22:11, one-tailed binomial P < 0.04).
We also determined the linear Reduced Major Axis (RMA) regression between L and R. This gave some support to the idea that growth patterns selectively favour the left- hand side (columns 6-9). The slope coefficient a relating L to R was larger than 1 for malleus and incus mass, the difference being statistically significant for the incus (P = 0.011) and nearly so for the malleus (P = 0.056). For the stapes, this pattern was seen for the length and the footplate area, but not for the mass. It is finally worth noting that the derived character “effective pressure” also exhibited an L-R relation with a slope significantly steeper than 1. Some of the data were very noisy, however (see Appendix 2), implying a low coefficient of determination.
The parameters in Table 1 of the Appendix were also analyzed for effects of age and sex. No statistically significant effects of age were found. Testing 21 females against 7 males yielded only a marginal sex difference in the weight of the left mallei (Appendix 2).
The functional significance of the differences described above are considered below in the Discussion.
Discussion
Directional Asymmetry of the Middle Ear and Hearing Under Water
In our study, we have found DA in four out of eight mensural characters of the middle ear (ME) of Globicephala and when considering also the compound character “effective pressure”, the total was five out of nine. As asymmetry of the head has been established in Archaeoceti Fahlke, et al. [14] we can assume that after having persisted for 35 My (Eocene-Oligocene boundary) in modern odontocetes, these characters have a functional role in hearing underwater. It is worth noting that asymmetry of the external (in land vertebrates) and middle ears could attain deleterious levels, because optimal function of the hearing organ depends on its [15, 16, 17]. Thus it is an interesting question why the DA has developed and whether it contributes to locating the source of returning echoes. Daniel, et al. [18] have described DA in the weight of the ME ossicles of the squirrel, Sciurus carolinensis; this phenomenon was also found in the ME ossicles of the South American bat Tadarida braziliensis [19].
Mechanisms of Sound Location
The ability to locate the source of sound is critical to the survival of a wide range of species. Some insects and non- mammalian vertebrates have evolved solutions different from those of mammals to the problems of sound location. The dolphin’s head is large, compared to the wavelengths of the relevant sounds, so that the problems of sound-source location faced by small-headed tetrapods [20] do not apply.
From their appearance as primarily nocturnal animals more than 200 My ago, mammals (predators and prey alike) relied heavily on sound location abilities to survive [21]. For marine mammals, their ability to echolocate and capture rapidly swimming fish demands a fine ability to locate sound direction. The location of sound in other mammals is greatly enhanced by a binaural auditory system. The availability of the binaural system allows at least three potential cues for auditory location in the horizontal plane: (1) the difference in the time of arrival at the two ears, or Interaural Time Difference (ITD). (2) The difference in the intensity of the sound at the two ears, or Interaural Intensity difference (IID) (sometimes called Level difference, ILD), and (3) the difference in the phase of the signal as it arrives at the two ears (IPD) [22]. A sound that is located off the main axis of the head will arrive at one ear earlier than the other, will be louder at one ear than the other and will be phase advanced at one ear relative to the other. The cues are known for terrestrial mammals to be differentially useful depending on the frequency, intensity and other characteristics of the sound. For example, as Lord Rayleigh [23] first speculated, low-frequency sounds are primarily located on the basis of temporal cues (time of arrival or phase differences) whereas high-frequency sounds are located using primarily intensity differences. Brief transient signals can be located by time of arrival, but continuous sounds must use phase differences.
Terrestrial mammals appear to use their pinnae to locate sounds along the vertical plane [24], but dolphins and small whales do not have external pinnae. Dolphins have a binaural system with at least two separate sound pathways to the individual ears [25, 26, 27]. The dolphins’ ability to locate stimuli in the vertical plane with precision similar to that of their performance in the horizontal plane is remarkable: The minimum audible angle (MAA) in the horizontal plane was found to be 0.9° for stimuli of 64.35 kHz. In the vertical plane (stimuli presented from above and below the animal’s head) it was 0.7° [28].
The dolphin auditory meatus is typically clogged with cellular debris and dense cerumen [26] and appears to play no functional role in hearing. Instead, the primary sound reception pathway appears to be via two fat channels in the dolphin’s lining of the lower jaw. These contain fat whose impedance closely matches that of seawater. A second, trumpet–shaped body of fat lies over the pan bone, a thin ovoid region in the posterior third of the mandible. Its direction is pointing forward in odontocetes, and laterally in Mysticetes [29] the density of this fat body is similar to the one lying over the mandible. The two channels, running at right angles to each other, have the potential to function as an analogue of the external pinnae of terrestrial mammals. Complex interaction between the sound patterns received via the two channels on each side of the head may provide cues to the elevation of signals.
Thompson’s earlier work [30] demonstrating that IPD of low-frequency signals were indeed detected by human listeners led to the formalization of the duplex theory of sound location; IID (“ILD”)were employed in high-frequency location tasks and timing differences (IPDs or ITDs) for location of low-frequency sounds. In addition to binaural cues, the auditory system exploits frequency-specific modifications in the magnitude and phase of the sound reaching the eardrum, that arise from the interaction of the sound with the head and the ears, to determine source location in the vertical plane.
These spectral cues for location underpin the ability to disambiguate the so-called cone of confusion, resolving sound sources in front and behind the animal, as well as determining their elevation; this task is not possible using binaural cues alone, or in fact ITDs, IIDs (“ILDs”) or both Blauert [31]. The function describing these spectral modifications that are largely generated by the pinna and concha of the outer ear, is referred to as the Head Related Transfer Function or HRTF. Spectral cues can be manipulated by the external ear, and the extent to which birds and mammals (including humans) can adapt to the altered cues that arise from theses manipulations demonstrates their importance in the location tasks, especially in the vertical plane [1]. A feature often found in auditory predators such as the barn owl, Tyto alba [32, 33] is pronounced asymmetry in the external auditory anatomy. In water, the terrestrial pinna loses its reflective and filtering capabilities due to the density similarity with water. As a result, natural selection has sacrificed the archetypal odontocete pinna to provide a more streamlined (hydrodynamic) shape for locomotion. To compensate for the loss of the pinnae, the reflective and refractive properties of the internal anatomical structures may function as a pinna analogue [26, 34].
Like other auditory predators, odontocetes exhibit pronounced asymmetry in anatomical structures including the skull [14, 35] soft tissue [36] and cranial air sacs [36, 37]. To date, only one detailed study of HRTF was calculated for a cetacean (Tursiops truncatus) [38]. However, data from behavioral experiments Brill, et al. [39], electrophysiological experiments Supin and Popov [40], and computer models Aroyan [34] all suggest that odontocetes possess a salient and complex HRTF. In connection to this, our present paper points out asymmetries in the middle ear features that might serve as part of resolving the ambiguities arising in sound location in the vertical plane (the “zone of confusion”). The fundamental assumption of Masterton, et al. [41] Heffner, et al. [42] is that the narrower the head, the smaller the ITD, the higher the frequency an animal must perceive well to detect intensity differences between the ears. For example, consider a pure tone (sine wave) arriving at the head. If the sound is directly in front of the head, the sound will arrive at the same time and with the same intensity at both ears. As the animal’s head turns away from the source, each ear receives a different phase, given that the inter-ear distance is different from an even multiple of the wavelength of the sound. ITD cues therefore involve comparing the time of arrival versus phase differences at different frequencies in each ear. Phase cues are useful primarily at frequencies below the functional limit: however, the higher the frequency an animal can hear, the more likely it is to have good sensitivity at the upper end of its frequency range for phase cues [43].
Asymmetry in the dolphin’s ear helps locate echo direction.
A comparative study of the mammalian middle ear [12] yielded the following conclusions: (1) Acoustic energy enters the mammalian cochlea aided by impedance matching performed by the middle ear. Anatomical measurements of mammals ranging from bats to elephants indicate that middle ear proportions are largely isometric. Thus, the calculated transformer ratio is independent of animal size, a typical value lying between 30 and 80. Similarly, the calculated specific acoustic input impedance of the inner ear is independent of animal size, the average value being about 140 kPa s/m. (2) The high frequency (HF) hearing limit of isometric ears is governed by ossicle inertia and is inversely proportional to the cubic root of the ossicular mass. To be more exact, it is inversely proportional to the cubic root of the combined weight of the mallei plus incudes, viz.:
HF limit α 1/ 3√ (malleus + incus mass) (The reason that the stapes is left out of the relation is that both in land mammals and in cetaceans, the stapes mass is isometric to the malleus+incus mass. Because we only talk about a relation (not equation) between the ossicular mass and the high-frequency limit the stapes mass can justifiably be left out [44].
The ossicles are acting as an impedance matching device, increasing the force of the vibrations received at the tympanic membrane (or its reputed analogous structure in marine mammals, the tympanic plate), moving the stapes in a piston-like motion in the oval window. This initiates a travelling wave in the cochlear fluid. The incudo-stapedial joint is the point in the ossicular chain, where the increased force gained from the longer lever of malleus plus incus, is acting. In this study, we measured the weights and the lengths of the ossicles. With respect to the malleus, it must be said though, that Odontocetes have lost their manubrium, (or it is only a tiny, hardly visible knot on the malleus body to which the tip of the conical, elongated tympanic membrane is attached). What we have measured is the malleus length to the tip of their thin processus gracilis, with which the ossicle is attached (ossified) to the upper rim of the tympanic plate; the actual length depends on the breaking point between these two. The malleus length, and the stapes length, may tell about the shape variation of these ossicles, but the malleus length measured here is not what is usually measured for terrestrial mammals. It follows that we cannot treat this or use it as L1 in the equation which calculates the transformer ration in terrestrial mammals. We have also measured the incudo-stapedial angles, in order to find out how they might affect the hearing of the animal. In particular, we have compared left to right sides, in order to find out whether asymmetry exists. The question of this study is how asymmetry (if present) can affect the localization of the source of incoming sound in the water environment.
According to the relations of structure and function aired by Hemilä, et al. [45], these asymmetries could translate into a different response in each of the two ears. For example, one ear can be slightly more sensitive to higher pitches, and the other to lower pitches. The fact that the response to sound arriving from different elevations is different would imply that by comparing the received echo’s amplitude in the two ears, some elevation information could be extracted. In other words, measuring two variables, such as the inter-aural amplitude difference and the inter-aural time difference (assuming it has no elevation dependence), could in principle allow the animal to obtain both elevation and bearing of a given received pulse.
To show how this can arise, we can look at an example. Let us assume that malleus weight is 20% higher in one of the ears. Figure 2 illustrates some of the differences in the signals from the two ears that this would cause according to the model of Hemilä, et al. [45]. Panel A shows the amplitude difference between the two ears as a function of frequency. Panels B and C refer specifically to responses to a “click” centered on 80 kHz, showing the inter-aural amplitude difference as a function of time (B) and as a function of frequency (C) (which is the Fourier transform of B).
![Figure 2: Modeling of Inter-Aural Response differences due to Ossicular Asymmetry: Malleus Mass as an Example. The Modeling in this and the Next Figure (Figure 3) was Based on Hemilä, et al. [45], with the Assumption that the Mass of the Malleus of One Ear is 20% Greater than that of the other Ear. (A), Inter-Aural Intensity difference as a Function of Frequency; (B), Inter-Aural Amplitude difference of the Response to A “Click” Centered on 80 Khz as a Function of Time (Normalized to Unity At Maximum); (C), Inter-Aural Amplitude difference of the “Click” Response as a Function of Frequency (I.E., the Fourier Transform of (B), Normalized to Unity At Maximum).](/fulltextimages/11421/fig_2.png)
Figure 2: Modeling of Inter-Aural Response differences due to Ossicular Asymmetry: Malleus Mass as an Example. The Modeling in this and the Next Figure (Figure 3) was Based on Hemilä, et al. [45], with the Assumption that the Mass of the Malleus of One Ear is 20% Greater than that of the other Ear. (A), Inter-Aural Intensity difference as a Function of Frequency; (B), Inter-Aural Amplitude difference of the Response to A “Click” Centered on 80 Khz as a Function of Time (Normalized to Unity At Maximum); (C), Inter-Aural Amplitude difference of the “Click” Response as a Function of Frequency (I.E., the Fourier Transform of (B), Normalized to Unity At Maximum).
![Figure 3: Modeling the Inter-Aural Amplitude difference of the “Click” Response as a Function of Elevation. The “Click” and the Modeling Assumptions are the same as in Figure 2. (A), Directional Sensitivity for Reception of Vertical Beam Patterns at three different Frequencies in the Bottlenose Dolphin Tursiops Truncatus (from Ridgway, et al. [46], their Figure 6); (B), the Amplitude Response of the Dolphin Ear (Colour-Coded) as Function of Sound Source Elevation (Y-Axis) and Sound Frequency (X-Axis), Interpolated from the Data in Panel A. Colour Code: Yellow-High, Blue-Low; (C), The Inter-Aural Amplitude difference of the Modeled “Click” Response as a Function of Elevation.](/fulltextimages/11421/fig_3.png)
Figure 3: Modeling the Inter-Aural Amplitude difference of the “Click” Response as a Function of Elevation. The “Click” and the Modeling Assumptions are the same as in Figure 2. (A), Directional Sensitivity for Reception of Vertical Beam Patterns at three different Frequencies in the Bottlenose Dolphin Tursiops Truncatus (from Ridgway, et al. [46], their Figure 6); (B), the Amplitude Response of the Dolphin Ear (Colour-Coded) as Function of Sound Source Elevation (Y-Axis) and Sound Frequency (X-Axis), Interpolated from the Data in Panel A. Colour Code: Yellow-High, Blue-Low; (C), The Inter-Aural Amplitude difference of the Modeled “Click” Response as a Function of Elevation.
To derive the amplitude of the perceived click in each of the ears as a function of source elevation, we need to multiply incident click power by the directional sensitivity in the vertical (sagittal) plane. Figure 3A shows directional hearing sensitivity curves of the dolphin Tursiops truncatus for three frequencies [46]. Interpolating from these curves, we obtain sensitivity as a function of source elevation and sound frequency, displayed in Figure 3B as a colour-coded surface. After multiplying this by the frequency response of each ear, we can compute the inter-aural amplitude difference, which is shown as a function of elevation in Figure 3C. This figure demonstrates that in principle, asymmetries between the middle ears can translate to information on the elevation of the source. Together with the inter-aural time difference, it could allow obtaining 2D information on the direction of the object from which an echolocation click is reflected.
The characters of the ossicles in which we have found DA can be largely combined into three groups: (1) DA of the ossicles mass (both singly and pooled). (2) DA of the angular differences of the incudo-stapedial joint between left and right sides, and (3) DA of the “effective pressure” as we have defined it (Materials and Methods and Appendix 2 Statistics), derived from the mensural characters in group one above.
The effect of ossicle weight upon hearing has been discussed for terrestrial mammals by Hemilä, et al. [12] and for odontocetes by Hemilä, et al. [45, 47]. These studies showed that high frequency (HF) hearing limit of isometric ears is governed by ossicle inertia and is inversely proportional to the cubic root of the ossicular mass. Independently of the size of the ear, a given sound pressure will produce equal stresses to corresponding ossicle points and middle ear structures (assuming isometric outer ear canals which are vestigial in Cetacea, and normalized sound frequency). In air, the acoustic impedance of incoming sounds is smaller than that of the inner ear fluids, which have to be moved in order to set off the hair cells in the cochlea and create the hearing sensation. This impedance mismatch is overcome by two lever systems increasing the pressure arriving at the oval window. One lever is hydraulic: the area of the tympanic membrane is much larger than that of the stapes footplate. The other lever is mechanical: derived from the ratio of the length of the malleus lever arm to the shorter incus lever arm. In water, the pressure mismatch is largely solved because the impedance of water outside the animal resembles that of the inner-ear fluids.
The specific acoustic input impedance of the cochlea, Zc, is on the average 150 kPa s/m in terrestrial mammals, and is independent on the size of the animal [48]. Assuming that the specific cochlear input impedance of whales resembles that of other mammals, sound moves in a whale ear from a higher to a lower impedance, namely from 1500 to 150 kPa s/m. Thus the situation in whales is opposite to that in terrestrial mammals [45, 47]. To obtain an impedance match for sound transmission from water to the inner ear, particle velocity should be increased more than sound pressure. The pressure increases anyway due to a large area ratio between the tympanic plate and the oval window (this also increases the intensity, and the signal-to-noise ratio). The pressure rise can be compensated for by an increase in particle velocity.
The detailed structure of the odontocete tympanic bone (TB) and ossicles Figure 4 indicates how the velocity amplification could be accomplished through two lever systems in series, different in anatomy and function from those of the terrestrial ear, viz.: (1) on the ventro-medial side the TB turns into a massive rolled-up rim, the involucrum (dashed contour in Figure 4), the inertia of which must prevent high-frequency vibration, with the result that the opposite dorso-lateral part of the bone, the tympanic plate (TP), to which the ossicles are attached, will vibrate with double amplitude. The connection between the TP and the malleus is accomplished by the processus gracilis. The malleus and the incus form a rod. One end of this rod, the malleus head, rests against the heavy and relatively immobile periotic bone (PB) in a ball-and–socket configuration, while the other end, the long arm of the incus, drives the stapes.
The processus gracilis transmits the vibration of the TP to the middle of this rod, and as the vibration of the malleolar end of the rod is prevented, the incudal end with the stapes will vibrate with double amplitude.
A condition for such a hypothetical mechanism is that the connection between the tympanic and periotic bones is elastic and thus the main part of the TP is relatively free to move in relation to the PB. In the killer whale and several other dolphin species the movement is facilitated by thin and folded spring-like structure connecting the tympanic bone to the periotic bone [49]. This spring-like structure is not seen in mysticetes and the processus gracilis is stiff and not flexible. Mysticetes have different, much lower hearing ranges compared to odontocetes, indicating that they might use bone conduction as a supplementary hearing mechanism [26].
Directional hearing is based on Interaural Time, Phase or Intensity Differences (ITD, IPD, IID). In all cases, the signal for directional hearing is proportional to L x f, where L is the head width of the animal, and f is the frequency of the arriving sound. If the head size width L is small, the frequency should be correspondingly high to provide enough phase difference. However, at high frequencies the absolute time delay becomes small, and this becomes a challenge for the neural circuits. Thus small mammals that have good high-frequency (HF) hearing base their perception of sound location mainly on intensity ratio [41, 50, 51].
Masterton, et al. [41] have claimed that HF hearing is the result of a selection pressure for accurate location of the source of brief sounds, and that the ability of mammals to hear HF sounds is correlated with the functional distance between the two ears. As a result of negative allometry between ears and head sizes, small mammals have relatively larger ears than large mammals, and can be superb in HF hearing. Some bats tend to compensate for the small head size by increasing the effective Interaural distance with enormous outer pinnae.
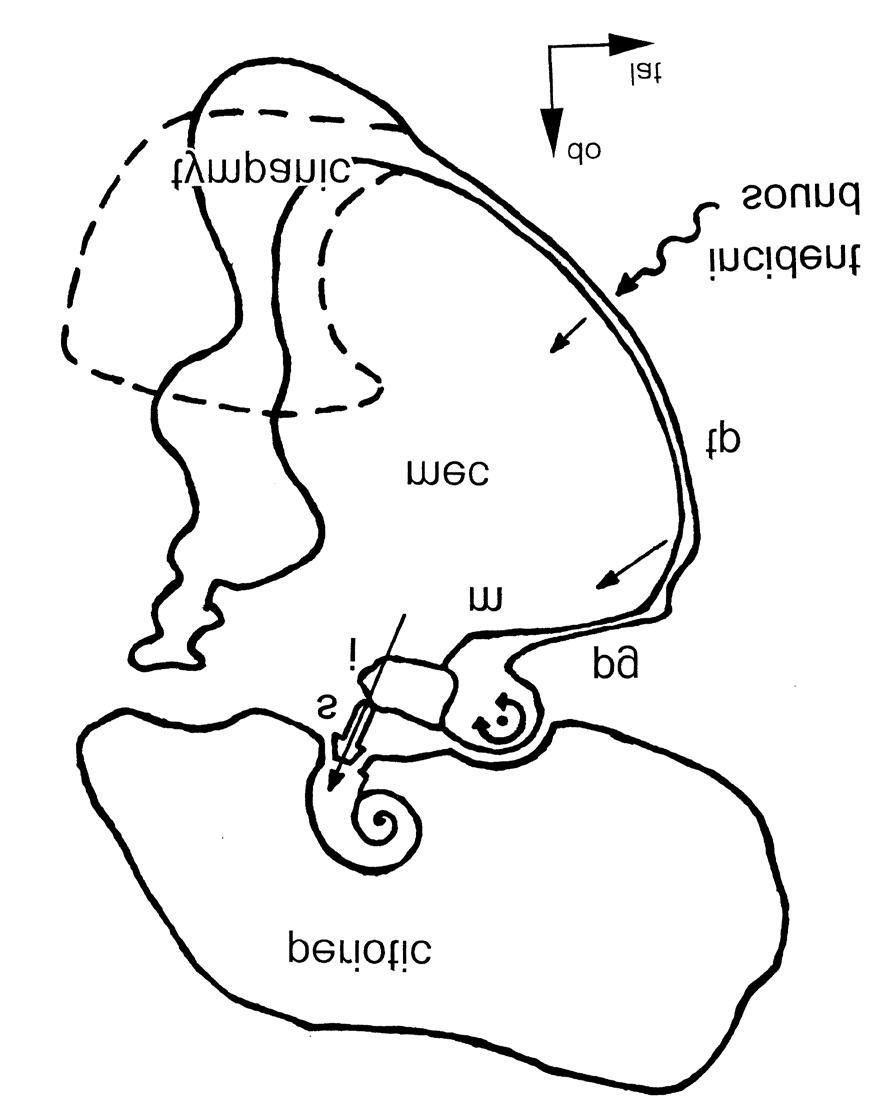
Figure 4: Schematic representation of the odontocete middle and inner ear from Hemilä et al. (1999). The incident sound arriving at the tympanic plate (tp) is shown by wavy arrow. The black dot indicates the rotational axis of the ossicular chain. The straight arrow shows the direction of the stapes movement during increasing sound pressure. tp, tympanic plate; pg, processus gracilis; m, malleus; i, incus; s, stapes; mec, middle ear cavity; c, cochlea. The dashed contour shows the thickest part of the massive lower half of the tympanic bone, which lies in another plane than the main scheme.
“The zone of ambiguity” with respect to locating the source of incoming sound lies in front and behind the head in the vertical plane. Using click trains, odontocete ability to locate the source of stimuli was found to be as follows: The minimum audible angle (MAA) in the horizontal plane was 0.9° for stimuli of 64.35 kHz. In the vertical plane (stimuli presented from above and below the animal’s head) it was 0.7° [28].
Thus their performance in the zone of ambiguity is indeed exceptional. As HRTF is not available to Cetacea in general (no external pinnae), other mechanisms must be used to achieve this level of precision. We found in the present study that DA exists in Globicephala in both the weights and angles of the ossicles. In addition, the “effective pressure”, product of the sums of the malleus+incus weight divided by the area of the stapes footplate area, was also significantly different between the sides. No DA was found in the length of the ossicles.
We discussed the fact that the upper limit of HF hearing is limited by the ossicular mass [44], and that the need of terrestrial mammals to match the different impedance of air and water does not pose a comparable problem to marine mammals (where the impedance matching task is the opposite, to trade pressure for particle velocity, also a form of impedance matching). The difference of ossicular weights between the two ears presumably creates a different force in each ear, where the heavier ear (Left) poses more inertia to the incoming stimuli, thereby reducing the perceived intensity and delaying the perceived timing of the stimuli to that side. The different angle between the sides does not affect the force of the incoming sound, but rather the phase with which the stimuli reach the cochlea. The different “effective pressure” (defined in Material and Methods - Measurements) between the left and right ears, must also contribute to a different particle velocity and hence perception of sound source. All of these contribute not only to the ability to locate sound sources in the azimuthal plane (based mainly on intensity differences, IID), but also, and in particular, in the vertical plane, where ITD and IPD must be the principal cue generators in solving the ambiguity which exists in this plane.
Evolution of Asymmetry in Fossil Cetaceans
In a study of skulls of Eocene archaeocete whales, cranial asymmetry was found in archaeocetes and odontocetes but not in mysticetes [14]. Eocene archaeocete whales gave rise to both later orders of Cetacea. Asymmetry in odontocetes is linked to high-frequency hearing and echolocation, absent in mysticetes. Protocetid and basilosaurid archaeocete skulls are distinctly directionally asymmetrical. This involves curvature and torsion of the cranium but no telescoping. Ultrasonic echolocation evolved in Oligocene Odontoceti, enabling them to find silent prey. This asymmetry and ultrasonic range of directional hearing were lost in Oligocene Mysticeti during the shift to low frequency hearing and bulk- straining predation. Fahlke et al. [14] found that the dorsal midline suture of the skulls is curved rather than a straight rostro-caudal axis [35]. A midline skull suture lying to the right of the RC means that the studied crania bend to the left. This deviation is present in Archaeoceti and Odontoceti but not in Mysticeti or in terrestrial artiodactyles, the group that had given rise to Archaeoceti [52].
Recognition of cranial DA in Archaeoceti has a number of implications for our understanding of the evolution of hearing in whales. Heyning [53] hypothesized that DA in Odontoceti evolved to minimize interference cancellation of sound production in parallel narial passages, and it has been assumed by Ness [35], Norris [25], Mead [54] and Heyning [53] that odontocete asymmetry is related to sound production and biosonar. These authors maintain that the development of archaeocete skull asymmetry coincides with the appearance of enlarged mandibular foramina, pan bones, fat-pad wave guides and with the development of enlarged tympanic bullae and pterygoid sinuses [55], all features present in the echolocating, high-frequency producing modern Odontoceti. Hence they conclude that this DA in Archaeoceti is related to hearing [56].
Asymmetry in the auditory system of terrestrial hunters [57, 58, 59, 60].
Their DA enhances the ability of owls to locate prey in the dark by decomposing complex sound [10]. Such DA was also in the ossicular chain of Tadarida braziliensis mexicana, the free-tailed Mexican bat. A similar enhancement is assumed for hearing in Archaeoceti. Odontoceti use position- dependent spectral filtering to locate the source of incoming sounds. Fish sound is normally in the mid sonic range (1-4 kHz), but fish also produce stridulating sounds up to 10 kHz. Sound in this range, near the lower limit for sound produced by Odontoceti, has corresponding wavelengths in sea water of 40 to 10 cm, in the range of the size of their prey [61, 62, 63, 64, 65, 66, 67, 68, 69, 70].
We offer a hypothesis concerning the origin of DA in a modern odontocete (Globicephala) as seen in our present work: The leftward shift from the RC evident in the early Archaeoceti, must have “taken with it” and incorporated osseous elements of the skull that participate in the ontogeny of middle ear ossicles [70, 71, 72, 73, 74, 75, 76, 77, 78, 79, 80].
This can at least explain why the weights of all ossicles are greater on the left side of our animal. As to the DA in the incudo-stapedial angle, it must have had a functional physiological role, which was favored in evolution, in sorting out sounds in the zone of ambiguity, akin to the external pinna of Tyto. When predating on fish that produce sounds in the range of 1 to 4 or so kHz, the angular inequality between the ossicles creates phase differences, which are best suitable in localization of sound sources in the lower range of the scale (up to about 4 kHz; see above). Thus, when approaching a fast-moving prey swimming in front of the dolphin, having such a deciphering acoustic tool at its disposal, makes the difference between having had its breakfast or missing it [80, 81, 82, 83, 84, 85, 86, 87, 88, 89, 90, 91, 92, 93, 94, 95].
Conclusions
Directional asymmetry (DA) occurred in six mensural characters of the middle ear ossicles of Globicephala macrorhynchus.
The weights of the mallei and incudes covaried, on the left and right sides, respectively. In all characters with DA, those on the left side were larger than the right.
The asymmetry of the ossicle weights, the inter-ossicular angle and the pressure generated in each ear may have functional physiological roles.
The DA that appeared in the crania of Archaeoceti, the ancestors of Cetacea, in the middle to late Eocene and has persisted in Odontoceti, appears to be linked to the development of high-frequency hearing and echolocation present in these.
Based on what is known about the processing of information carried by inter-aural intensity, time and phase differences in the mammalian brainstem and auditory cortex, the middle-ear asymmetries may help the animal to locate a sound source in the vertical plane, endowing the Odontoceti with their exceptional auditory performance and enhancing their survival as predators.
Acknowledgements
We thank Mr. Tadashi Araki, Tokyo, Japan, for arranging and organizing the trip to Taiji, Japan; the staff of the Whale Museum and the people of Taiji, who welcomed I.T. to their village and allowed him to use their lab for preparation of the hearing organs; Adv. Wered Ben-Sade, for legally transporting the ears from Japan to Israel; Dr. Yael Seligman, for help with statistics; Professor Ran Nathan, Department of Ecology, Evolution and Behaviour (Movement Ecology), The Hebrew University of Jerusalem, for his generous hospitality, allowing I.T. to use instruments in his lab; Dr. Boaz Shacham, for help with illustrations representing statistics; Professor Nurit Hiller, MD. Hadassah Hospital Mt. Scopus, Jerusalem, for very generously opening up the radiology dept. of the hospital, allowing and helping me to perform the CT images of the TPC’S; Dr. Darlene Ketten, Department of Biology, Woods Hole Oceanographic Institution, Woods Hole, for inspecting the CT images and approving their validity; lastly, Dr. Sirpa Nummela and Professors Kristian Donner, Simo Hemilӓ and Tom Reuter, Faculty of Biological and Environmental Sciences, University of Helsinki, for reading the manuscript and offering valuable comments.
References
-
Branstetter BK, Mercado E (2006) Sound localization by Cetaceans. International Journal of Comparative Psychology 19(1): 26-61.
-
Hyrtl J (1845) Comparative-anatomical studies on the inner organs of man and the body. Prague: Ehrlich, pp: 91-130.
-
Boenninghaus G (1903) Das Ohr des Zahnwaies Zyugleich A Contribution to the Theory of Schalleitung. Zool Gahrb (Anatomie) 17: 189-360.
-
Oelschläger HA (1986) Comparative morphology and evolution of the otic region in toothed whales (Cetacea: Mammalia). Am J Anat 177(3): 353-368.
-
De Haan FWR (1957) Hearing in whales. Acta Otolaryngol S134: 111-114.
-
Ketten DR, Wartzok D (1990) Three dimensional reconstruction of the dolphin EAR. Sensory abilities of Cetaceans pp: 81-105.
-
Ridgway SH (1990) The central nervous system of the bottlenose dolphin. In: Leatherwood S. Reeves R. (eds.): The bottlenose Dolphin. Academic Press, USA, pp: 69-97.
-
Valen LV (1962) A study of fluctuating asymmetry. Evolution 16(2): 125-142.
-
Ludwig W (1932) The right-left problem in the animal kingdom and in humans, In: 1st (Edn.), Springer Berlin, Heidelberg, pp: 11-496.
-
Norberg R (1978) Skull asymmetry, ear structure and function, and auditory localization in Tengmalms owl, Aegolius funereus (Linne). Philosophical Transactions of the Royal Society B Biological Sciences 282(991): 325- 410.
-
Tsur I (2020) Directional Hearing under Water: Morphology and Function of the Middle Ear of Globicephala macrorhynchus (Short-Finned Pilot Whale). University of Helsinki, Helsinki.
-
Hemilä S, Nummela S, Reuter T (1995) What middle ear parameters tell about impedance matching and high frequency hearing. Hear Res 85(1-2): 31-44.
-
Skinner M, Honrado C, Prasad M, Kent HN, Selesnik SH (2003) The Incudo-stapedial Joint Angle: Implications for Stapes Surgery Prosthesis Selection and Crimping. Laryngoscope 113(4): 647-653.
-
Fahlke JM, Gingerich PD, Welsh RC, Wood AR (2011) Cranial asymmetry in Eocene archaeocetes whales and the evolution of directional hearing in water. Proc Natl Acad Sci USA 108(35): 145454-145458.
-
Wever EG, Werner YL (1970) The function of the middle ear in lizards: Crotaphytus collaris (Iguanidae). J exp Zool 175(3): 327-341.
-
Werner YL, Wever EG (1972) The function of the middle ear in lizards: Gekko gecko and Eublepharis macularius (Gekkonoidea). J Exp Zool 179(1): 1-16.
-
Werner YL, Montgomery LG, Seifan M, Saunders JC (2008) Effects of age and size in the ears of gekkotan lizards: Auditory sensitivity, its determinants, and new insights into tetrapod middle-ear function. Pflugers Archiv 456(5): 951-967.
-
Daniel III HJ, Roberson LK (1987) The ossicles of the eastern gray squirrel, Sciurus carolinensis. Journal of the Elisha Mitchell Scientific Society 103(1): 21-27.
-
Lifschytz T, Tchernov E, Werner YL (2000) Directional asymmetry of middle-ear ossicles in the free-tailed Mexican bat Tadarida brasiliensis. Israel Journal of Zoology 46: 166-167.
-
Christensen-Dalsgaard J (2005) Directional hearing in non-mammalian tetrapods. In: Sound Source Localization, Popper AN, Fay RR (Eds.), New York Springer, pp: 67-123.
-
Grothe B, Pecka M, McAlpine D (2010) Mechanisms of Sound Localization in Mammals. Physiological Reviews 90(3): 983-1012.
-
Nachtigall PE, Lemonds DW, Roitblat HL (2000) Psychoacoustic Studies of Dolphin and Whale Hearing. In: Hearing by Whales and Dolphins, Au WWL, Popper AN and Fay RR editors, Springer-Verlag New York, USA, pp: 330-363.
-
Rayleigh Lord (1907) Our perception of sound direction. Philosophical Magazine13: 214-232.
-
Roffler SK, Butler RA (1968) Factors that influence the localization of sound in the vertical plane. J Acoust Soc Am 43(6): 1255-1259.
-
Norris KS (1968) The evolution of acoustic mechanisms in odontocete cetaceans. In: Drake ET, Evolution and Environment, Yale University Press, New Haven, USA, pp: 297-324.
-
Ketten DR (1997) Structure and Function in Whale Ears. Bioacoustics The international Journal of animal sound and its recording 8: 103-135.
-
Ketten DR (2000) Cetacean Ears, In Hearing by Whales and Dolphins, Au. WWL, Popper AN and Fay RR editors. Springer New York, USA, pp: 43-109.
-
Renaud DL, Popper AN (1975) Sound localization by the bottlenose porpoise Tursiops truncatus. J Exp Biol 63(3): 569-585.
-
Yamato M, Pyenson ND (2015) Early development and orientation of the acoustic funnel provides insight into the evolution of sound reception pathways in cetaceans. PLoS ONE 10(3): e0118582.
-
Thompson SP (1882) On the function of the two ears in the perception of space. The London, Edinburgh, and Dublin Philosophical Magazine and Journal of Science 13(83): 406-416.
-
Blauert J (1997) Spatial hearing with one sound source. In: Spatial Hearing: The Psychophysics of Human sound Localization. Cambridge, MA: MIT Press, pp: 36-200.
-
Knudsen EI (1981) The hearing of the barn owl. Scientific American 245(6): 113-125.
-
Mooney TA, Yamato M, Branstetter BK (2012) Hearing in Cetacean: From Natural History to Experimental Biology. Advances in Marine Biology 63: 197-246.
-
Aroyan JL (2001) Three-dimensional modeling of hearing in Delphinus delphis. J Acoust Soc Of America 110(6): 3305-3318.
-
Ness AR (1967) A measure of asymmetry of the skulls of odontocete whales. Journal of Zoology 153(2): 209-221.
-
Cranford TW, Amundin M, Norris KS (1996) Functional morphology and homology in the odontocete nasal complex: Implication for sound generation. J of Morphology 228(3): 223-285.
-
Houser DS, Finneran J, Carder D, Bonn WV, Smith C, et al. (2004) Structural and functional imaging of bottlenose dolphin (Tursiops truncatus) cranial anatomy. J exp Biol 207(21): 3657-3665.
-
Taylor K (2013) Directional Hearing and Head Related Transfer Function (HRTF) in a bottlenose dolphin (Tursiops truncatus). ProQuest pp: 1-104.
-
Brill RL, Moore PWB, Helweg DA, Dankiewicz LA (2001) Investigating the Dolphin’s Peripheral Hearing System: Acoustic Sensitivity about the Head and Lower Jaw. Science Applications International Corporation (SAIC) pp: 1-21.
-
Supin AY, Popov VV (1993) Direction-dependent spectral sensitivity and interaural spectral difference in a dolphin: Evoked potential study. J Acoust Soc Am 93(6): 3490-3495.
-
Masterton B, Heffner H, Ravizza R (1969) The evolution of human hearing. J Acoust Soc Am 45: 966-985.
-
Heffner RS, Masterton RB (1990) Sound localization in mammals: Brain-stem mechanisms. In: Berkley MA, Stebbins WC (Eds.), Comparative Perception New York, USA, John Wiley and Sons, 1: 285-314.
-
Ketten DR (2000) Cetacean Ears. In: Hearing by Whales and Dolphins. Au WWL, Popper AN, et al. (Eds.), Springer New York, USA, pp: 43-109.
-
Nummela S (1995) Scaling and modelling of the mammalian middle ear. Hear Res 85(1-2): 18-30.
-
Hemila S, Nummela S, Reuter T (1999) A model of the odontocete middle ear. Hear Res 133(1-2): 82-97.
-
Ridgway SH, Au WWL (2009) Hearing and Echolocation in Dolphins. Elsevier Ltd. Encyclopedia of Neuroscience 4: 1031-1039.
-
Hemila S, Nummela S, Reuter T (2001) Modeling whale audiograms: effects of bone mass on high-frequency hearing. Hear Res 151: 221-226.
-
Zwislocki JJ (1975) The role of the external and middle ear in sound transmission. In: Tower DB (Ed.), In: The Nervous System. Human Communication and its disorders. Raven Press, New York, USA, 3: 45-55.
-
Nummela S, Wägar T, Hemila S, Reuter T (1999) Scaling of the cetacean middle ear. Hear Res 133(1-2): 71-81.
-
Heffner HE, Heffner RS (2018) The evolution of mammalian hearing. In: Bergevin C, Puria S (Eds.), In: To the ear and back-Advances in auditory biophysics pp: 13000-13008.
-
Heffner RS, Koay G, Heffner HE (2020) Hearing and sound localization in Cottontail rabbits, Sylvilagus floridanus. J Comp Physiol A Neuroethol Sens Neural Behav Physiol 206(4): 543-552.
-
Thewissen JGM, Cooper LN, Clementz MT, Bajpai S, Tiwari BN (2007) Whales originated from aquatic artiodactyls in the Eocene epoch of India. Nature 450(20-27): 1190- 1195.
-
Heyning JE (1989) Comparative facial anatomy of beaked whales (Ziphiidae) and a systematic revision among the families of extant Odontoceti. Natural History Museum of Los Angeles County Contributions in Science 405: 1-64.
-
Mead JG (1975) Anatomy of the external nasal passages and facial complex in the Delphinidae (Mammalia: Cetacea). Smithson Contrib Zool 207: 1-72.
-
Luo Z, Gingerich PD (1999) Terrestrial Mesonychia to aquatic Cetacea: Transformation of the basicranium and evolution of hearing in whales. University of Michigan Papers on Paleontology 31: 1-98.
-
Batra R, Kuwada S, Fitzpatrick DC (1997) Sensitivity to Interaural temporal disparities of low- and high- frequency neurons in the superior olivary complex II. Coincidence detection. J Neurophysiol 78(3): 1222- 1247.
-
Conlee JW, Parks TN, Creel DJ (1986) Reduced neuronal size and dendritic length in the medial superior olivary nucleus of albino rabbits. Brain Res 363(1): 28-37.
-
Crow G, Rupert AL, Moushegian G (1978) Phase- locking in monaural and binaural medullary neurons: implications for binaural phenomena. J Acoust Soc Am 64: 493-501.
-
Davis TA (1987) Laterality in Crustacea. Proc Indian natn Sci Acad (B) 53: 47-60.
-
Fay RR (2005) Sound source localization by fishes. In: Sound Source Localization, edited by Popper AN, Fay RR (Eds.), New York, USA, Springer pp: 36-66..
-
Feng AS, Gerhardt HC, Capranica RR (1976) Sound localization behavior of green tree frog (Hyla cinerea) and barking tree frog (Hyla gratiosa). J comp Physiolo 107: 241-252.
-
Fox SF (1975) Natural selection on morphological phenotypes of the lizard Uta stansburiana. Evolution 29: 95-107.
-
Fox W, Gordon C, Fox MH (1961) Morphological effects of low temperatures during the embryonic development of the garter snake, Thamnophis elegans. Zoologica 46(5): 57-71.
-
Goldberg JM, Brown PB (1969) Response of binaural neurons of dog superior olivary complex to dichotic tonal stimuli: some physiological mechanisms of sound localization. J Neurophysiol 32(4): 613-636.
-
Grothe B, Park TJ (1998) Sensitivity to Interaural time differences in the medial superior olive of a small mammal, the Mexican free-tailed bat. J Neurosci 18(16): 6608-6622.
-
Grothe B, Park TJ (2000) Structure and function of the bat superior olivary complex. Microsc Res Tech 51: 382- 402.
-
Hartmann R, Klinke R (1990) Impulse patterns of auditory nerve fibers to extra- and intracochlear electrical stimulation. Acta Otolaryngol Suppl 469: 128- 134.
-
Heffner RS, Heffner HE (1987) Auditory function in albino cats. Assoc Res Otolaryngol Abstr.
-
Heffner, HE, Heffner RS (2018) The evolution of mammalian hearing. In: Bergevin C, Puria S (Eds.), To the ear and back – Advances in auditory biophysics (pp. 13000-1 to 13000-8), Melville NY: AIP Publishing, AIP Conf. Proc 1965: 130001.
-
Hemilä S, Nummela S, Reuter T (2010) Anatomy and physics of the exceptional sensitivity of dolphin hearing (Odontoceti: Cetacea). J Comp Physiol A 196(3): 165- 179.
-
Hermann J, Pecka M, von GH, Grothe B, Klug A (2007) Synaptic transmission at the calyx of Held under in vivo like activity levels. J Neurophysiol 98(2): 807-820.
-
Jolicoeur P (1963) Bilateral symmetry and asymmetry in limb bones of Martes americana and Man. Re. can Biol 22: 409-432.
-
Joris PX, Carney LH, Smith PH, Yin TC (1994) Enhancement of neural synchronization in the anteroventral cochlear nucleus. I. Responses to tones at the characteristic frequency. J Neurophysiol 71(3): 1022-1036.
-
Klumpp R, Eady H (1956) Some measurements of Interaural time difference thresholds. J Acoust Soc Am 28: 215-232.
-
Lockyer C (1993) A report on patterns of deposition of dentine and cement in teeth of pilot whale, Genus Globicephala. Report International Whaling Commission 14(14): 137-161.
-
McCormick JG, Wever EG, Palin G, Ridgway SH (1970) Sound conduction in the dolphin ear. J Acoust Soc Am 48: 1418-1428.
-
Neville AC (1976) Animal symmetry. Edward Arnold, London, UK.
-
Nummela S, Wägar T, Hemilä S, Reuter T (1999) Scaling of the cetacean middle ear. Hear Res 133(1-2): 71-81.
-
Nummela S, Thewissen JGM, Bajpai S, Hussain T, Kumar K (2004) Eocene evolution of whale hearing. Nature 430(7001): 776-778.
-
Nummela S, Pihlström H, Puolamäki K, Fortelius M, Hemilä S, et al. (2013) Exploring the mammalian sensory space: co-operations and trade-offs among senses. J Comp Physiol A 199: 1077-1092.
-
Palmer AR, Strobeck C (1986) Fluctuating Asymmetry: Measurements, Analysis, Patterns. Annual Review of Ecology and Systematics 17: 391-421.
-
Pecka M, Brand A, Behrend O, Grothe B (2008) Interaural time difference processing in the mammalian medial superior olive: The role of glycinergic inhibition. Journal of Neuroscience 28(27): 6914-6925.
-
Rheinlӓnder J, Walkowiak W, Gerhardt HC (1981) Directional hearing in the green tree frog: a variable mechanism?. Naturwissenschaften 68: 430-431.
-
Robert D (2006) Directional hearing in insects. In: Sound Source Localization. New York, USA, pp: 6-35.
-
Rose JE, Brugge JF, Anderson DJ, Hind JE (1967) Phase-locked response to low-frequency tones in a single auditory nerve fibers of the squirrel monkey. J Neurophysiol 30(4): 769-793.
-
Schroeder MR (1977) New viewpoints in binaural interactions. In: The Psychophysics and Physiology of Hearing, Edited by Evans EF, Wilson JP (Eds.), New York: Academic, USA, pp: 455-467.
-
Simpson GG (1953) The major features of evolution. New York, USA, Columbia University Press, pp: 436.
-
Spirou GA, Rowland KC, Berrebi AS (1998) Ultrastructure of neurons and large synaptic terminals in the lateral nucleus of the trapezoid body of the cat. J Comp Neurol 398(2): 257-272.
-
Spitzer MW, Semple MN (1995) Neurons sensitive to Interaural phase disparity in gerbil superior olive: diverse monaural and temporal response properties. J Neurophysiol 73(4): 1668-1690.
-
Thompson SP (1882) LI. On the function of the two ears in the perception of space. Philos Mag 13(83): 406-416.
-
Van Valen L (1962) A study of fluctuating asymmetry. Evolution 16(2): 125-142.
-
Werner YL, Rothenstein D, Sivan N (1991) Directional asymmetry in reptiles (Sauria: Gekkonidae: Ptyodactylus) and its possible evolutionary role, with implications for biometrical methodology. J Zool Lond 225: 647-658.
-
Yin TC (2002) Neural mechanism of encoding binaural localization cues. In: Integrative Functions in the Mammalian Auditory Pathway, Oertel D, Fay RR, et al. (Eds.), New York, USA, pp: 99-159.
-
Yin TC, Chan JC (1990) Interaural time sensitivity in medial superior olive of cat. J Neurophysiol 64(2): 465- 488.
-
Yin TC, Carney LH, Joris PX (1990) Interaural time sensitivity in the inferior colliculus of the albino cat. J Comp Neurol 295(3): 438-448.
- 4th Branchial Cleft Sinus Anomaly Presenting as Recurrent Thyroid Abscess in A Child: A Case Report
- Parotid Duct Injury Repaired Using an Angiocatheter Stent: A Case Report
- Organization and Functionality of the Referral and Counter-Referral System for ENT Disorders in District Hospitals of N’Djamena, Chad: A Cross-Sectional Analytical Study
- Facial Metastases from a Gastrointestinal Stromal Tumor: A Case Report
- Panorama of Ent Cancers and Literature Review: Epidemiological Profile and Therapeutic Management
- Could Antimicrobial Resistance Prove to Be Both a Threat and an Opportunity for us?