Numerical Simulation for Interaction between the Fracture Surface and the Proppant Column after HiWay Fracturing
HiWay fracturing uses impulse sand to achieve the proppant column supporting the rock wall surface, creating an open flow channel that is more conducive to improving the stimulation effect. The deformation law of the proppant column under the compression of the fracture wall surface is directly related to the effectiveness of the high conductivity fracture. However, the related laboratory physical simulation experiments are challenging to conduct, which restricts the study of the interaction between the fracture surface and the proppant column. In this paper, first, establish the finite element model of the interaction between the fracturing crack and the proppant column, and the variation law of stress-deformation of the crack wall and displacement of the crack wall under the closure stress is analyzed. Furthermore, this paper carries out the quantitative characterization of the active support area of the proppant column. Finally, the accuracy of the simulation results is verified by applying the experimental results of indoor proppant column rock plate compression. The numerical simulation method proposed in this paper can effectively realize the simulation of the interaction between the fracture surface and the proppant column in HiWay fracturing based on real engineering parameters, which lays theoretical and simulation experimental support for improving the effect of channel fracturing stimulation.
Introduction
High flow conductivity channel fracturing, referred to as HiWay fracturing or channel fracturing. It is mainly by adding fiber fracturing fluid or self-aggregating proppant, and combined with the pulsed sanding process, to achieve a specific spacing of proppant clusters in the crack, and the fracture changes from “face” support to “point” support to achieve open flow channel, which can increase the sufficient crack length and reduce the amount of proppant and fracturing fluid [1, 2]. Through foreign Eagle Ford shale gas fields [3, 4, 5] and shale oilfields [6, 7], as well as the early pulse fracturing field test of Shengli Oilfield [8], it finds that the productivity of the HiWay fracturing after fracturing is much higher than conventional fracturing. Therefore, it is of considerable significance to carry out theoretical research on the fracturing mechanics of HiWay for the development of low permeability reservoirs [9].
However, due to the limited number of HiWay fracturing physical model tests and the large dispersion of the physical model test results, the scale of the experiment is far from the actual situation. Under the “point” support condition of the proppant column, the influencing factors of fracture closure are more complicated, and it is difficult to consider by using a single physical model method entirely. The close of cracks and the two-body interaction of proppant columns are challenging to monitor on-site. Such as the existence of the above problems, numerical simulation research methods have become an efficient and reliable alternative. Therefore, based on the exact mechanical characteristics of the target reservoir, this paper carries out a numerical simulation of the HiWay in considering the fracturing pump injection procedure and studied the mechanism and adaptability of the high flow conductivity fracturing.
The Numerical Model of the Interaction between Fracture and Proppant Column after HiWay Fracturing
Overview of Engineering Geological Parameters of the Target Block
As shown in Table 1, the elastic modulus of the target reservoir is 34-38 GPa; Poisson’s ratio is 0.258; the horizontal minimum principal stress is 40-60 MPa; the average porosity is about 10%, and the average permeability is about 4.5×10-
3 μm2, which belongs to low porosity and low permeability reservoir. The average density of surface crude oil is 0.835- 0.8448 g/cm3, the average viscosity is 3.8-7.07 mPa•s, the average sulfur content is 0.42-0.67%, the average freezing point is 28-40℃, and the reservoir is a thin oil reservoir. The formation of water total mine is 22974 mg/l, and the water type is NaHCO3 type. According to the test data of the target block, the original formation pressure is 52.74-62.09 MPa, the average is 57.42 MPa, the formation pressure coefficient is 1.47-1.64, the formation temperature is 130-155℃, and the temperature gradient is 3.1-3.5℃/100m, which belongs to the average temperature and high-pressure system. According to sensitive data, the reservoirs in this area show moderate to keen water sensitivity, weak salt sensitivity, weak acid sensitivity, no alkali sensitivity, and no speed sensitivity. The geological logging oil layer is gray oil trace beautiful sandstone, and the color of oil-bearing cuttings is brown, and the color of non-oil cuttings is gray. Its composition is mainly quartz, followed by feldspar, sub-angular, medium sorting, muddy cement, and loose. The dripping of oil-bearing debris is like a bun. The time interval of pulse sanding is basically between 1.44-2 minutes.
| Well | Well Section (meter) | Thickness (m) | Permeability ( mD) | Porosity (%) | Closurestress (MPa) | Ground stress (MPa) | Elastic Modulus (GPa) | Slit width (mm) | Ceramsite (mm) |
|---|---|---|---|---|---|---|---|---|---|
| Y-1 | 3546.4-3621.3 | 74.9 | 4.0 | 10.2 | 53 | 52.4-53.8 | 38 | 4.4 | 0.3-0.6 |
| Y-3VF | 3531.8-3814.3 | 282.5 | 4.0 | 10.2 | 50 | 48-50 | 34 | 4.2 | 0.3-0.6 |
| Y-(inclined) 4VF | 3587.4-3883.0 | 295.6 | 4.0 | 10.2 | 52 | 49-56.8 | 34 | 4.65 | 0.3-0.6 |
| Y-71 | 2485.3-2501.3 | 16.0 | 2.0 | 8.6 | / | 38.3-39.2 | 36.8 | 6.7 | 0.3~0.6 |
Table 1: Geological conditions of typical well reservoirs in block Y of Shengli Oilfield.
Geometric Model of the Interaction between Fracture and Proppant Column in HiWay Fracturing
Taking the typical well Y-inclined 4VF as an example, the fracture effectively supports about 150 meters, and the total pumping time is about 75 minutes. From this, it can draw that the length of pumping per minute is two meters, and the time of carrying sand is two minutes. It can deduce that the diameter of the proppant column is about 5 meters, and the crack height is about 5 mm. Combined with the actual ground stress, elastic modulus, and Poisson’s ratio of the oil field, the parameters required for numerical simulation can be obtained. Therefore, the heights of the proppant columns are 5 mm, the diameter of the proppant columns is 5 meters, and the distance between the proppant columns is 5 meters. The minimum horizontal principal stress is 50 MPa, the reservoir elastic modulus is 30 GPa, and the Poisson’s ratio is 0.28.
Finite Element Model of the Interaction between Fracture and Proppant Column in HiWay Fracturing
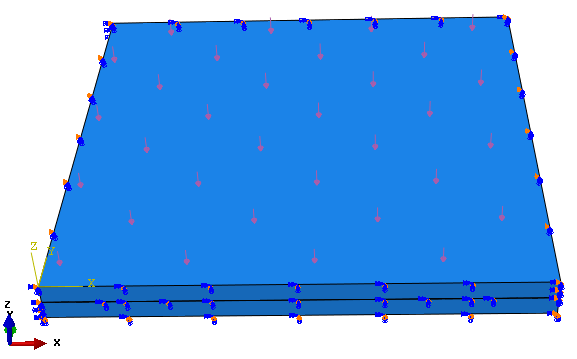
As shown in Figure 1, the upper and lower rock plates use hexahedral elements [10], choosing the structural meshing technique, and the global size sets to 0.1 m. The support column adopts the hexahedral element, selecting the sweeping meshing technique, and the global size sets to 0.025 m. The same closing pressure applies to the upper and lower rock plates, respectively 40, 50, 60 MPa. The upper and lower rock plates contact pairs set to face-to-face contact, the contact attribute set not to consider friction, the typical set to hard contact, and the hardness scale factor sets to one.
Analysis of the Interaction Law between Fractures and Proppant Columns in HiWay Fracturing
Stress-Deformation Distribution Law of the Crack Wall
A numerical simulation study carries out on this model, and the displacement and contact stress cloud characteristics of the upper and lower rock plates are obtained. As shown in Figure 2, the displacement of the center position of the upper wall surface in the negative direction of Z direction is 6.175 mm, and the displacement of the lower wall surface in the negative direction of the central position in the Z direction is 0.6675 mm, then the relative displacement of the upper and lower rock plates is 5.5075 mm. Since the total height of the proppant column is 5 mm, the two rock plates are now in contact, and the fracture is completely closed. Therefore, the proppant column cannot adequately support the fracture.
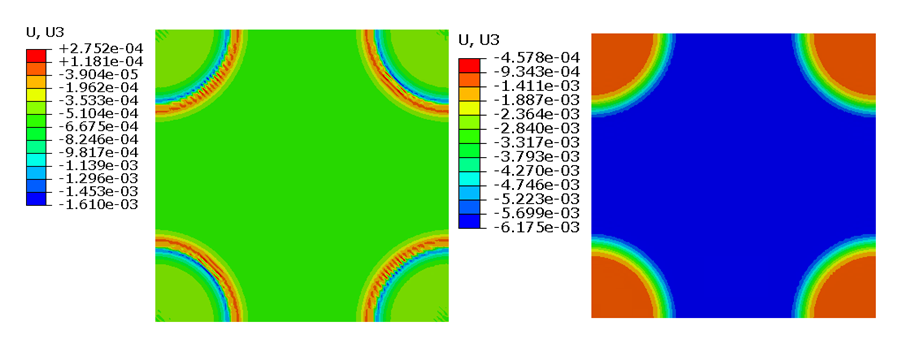
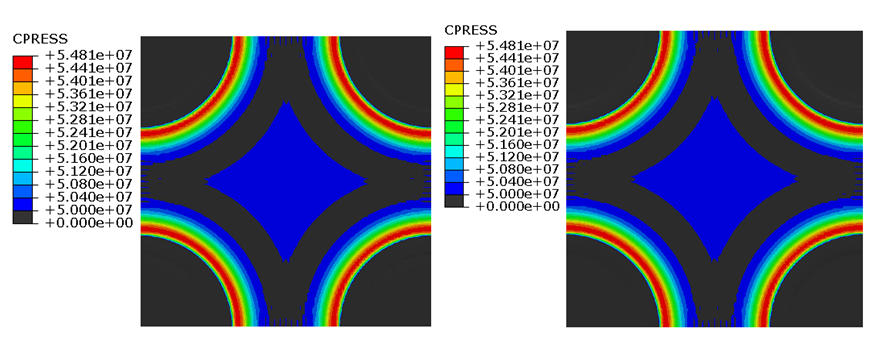
Under the action of 50 MPa ground stress on the upper and lower rock plates, the displacement cloud map (Figure 3) shows that the two rock plates have contacted each other, and the cracks are completely closed. Furthermore, it can be seen from the contact stress cloud diagram of the upper and lower rock plates that the contact stress is higher than 50 MPa on the outside of the proppant column and the center of the rock plate. Moreover, the contact stress of the rest is slightly less than 50 MPa, indicating that although the fractures are closed at this time, the contact stress in some areas within the fracture is still less than the closing pressure of the reservoir. Experiments and theoretical studies on the flow conductivity in the sand chamber show that the reduction of the fracture closure stress can significantly improve the flow conductivity of the fracture, and the proppant column still plays a role in enhancing the flow conductivity of the fracture.
Variation Characteristics of Crack Wall Displacement
In order to study whether the fracture in the middle of the proppant column is closed and the value of the contact stress after the closure of the HiWay fracturing fluid. As shown in Figure 4 (left), a path is set in the middle of the model along the X and Y directions to plot the mutual displacement and contact stress of the crack walls on the left and right sides, as shown in Figure 4 (right).
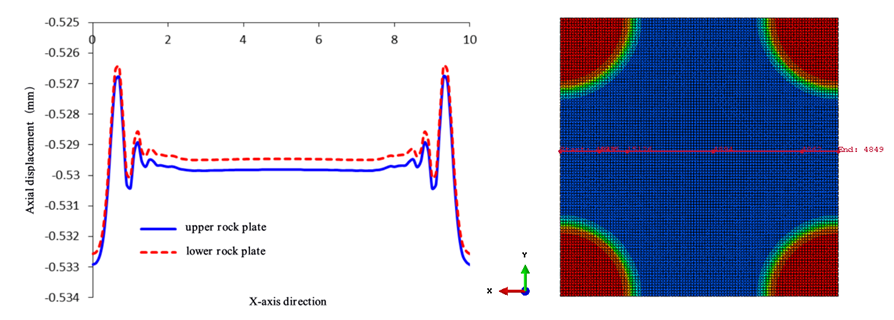
Because the proppant columns of the model have the same size and spacing, according to the principle of symmetry, only the calculation results in the X-direction are analyzed in this paper. In the axial displacement curve diagram, set the contact surface of the lower rock plate as the X-axis. After the pressure is applied, the axial displacement of the two rock plates is negative, and the absolute value of the axial displacement of the upper rock plate is subtracted by 5mm to form as shown in the comparison chart of Figure 4, the axial displacement of the upper rock plate minus the axial displacement of the lower rock plate is the distance between the two plates. It can be seen from the figure that the distance between the two plates is negative, which means that the crack has been closed. The higher in a negative value, the more serious the compaction of the two plates. Relative to both sides of the rock plate, the middle part of the rock plate is more compacted.
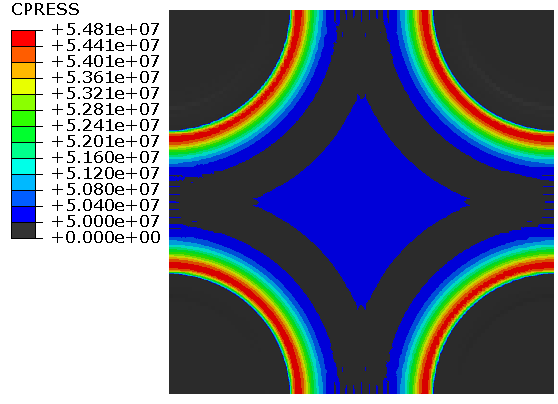
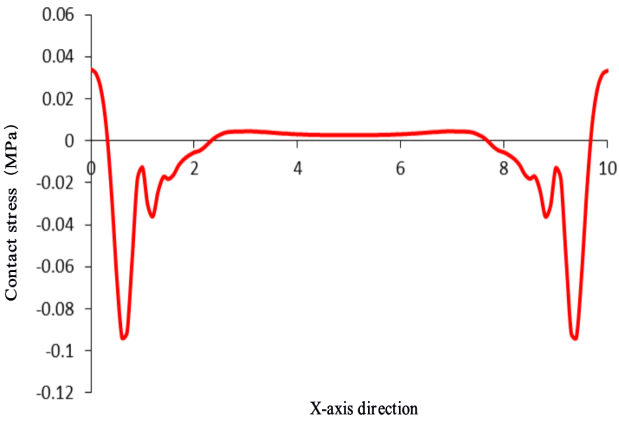
Similarly, extract the grid data in the X-axis direction from the contact stress cloud map of the rock plate (Figure 5), and draw the contact stress distribution map of the X-direction rock plate (Figure 6). To facilitate the evaluation of the relative magnitude of the contact stress, 50 MPa is subtracted from the stress value on the ordinate so that the Y-axis is 0, which represents the contact stress of 50 MPa. It can be seen from Fig. 6 that the contact stress at the center of the rock plate is higher than 50 MPa, but the contact stress at some ends of the rock plate is less than 50 MPa. The original ground stress is 50 MPa, which shows that after the proppant column is added, although the crack in the middle of the support area has been closed, the closure stress in some surrounding areas is significantly reduced, which significantly improves the fracture conductivity.
Quantitative Characterization of Proppant Column Support Area
To quantitatively characterize the active support area of the proppant column under the stress of crack closure, the contact stress cloud map of the rock plate in the contact model is extracted, as shown in Figure 7 (left). Partially remove the proppant column in the contact stress cloud diagram of the rock plate to obtain the area shown in Figure 7 (right). In the total crack area, the black part is the area where the closure stress is less than 50 MPa (current ground stress), which can be regarded as an active support crack area. Suppose the total area of the crack area is A, and the area of the active supporting crack area (i.e., the black part) is calculated as using graphic analysis software. After calculation, a/A=0.678, indicating that the active supporting crack accounts for 67.8%.

Displacement Change and Verification of Proppant Column
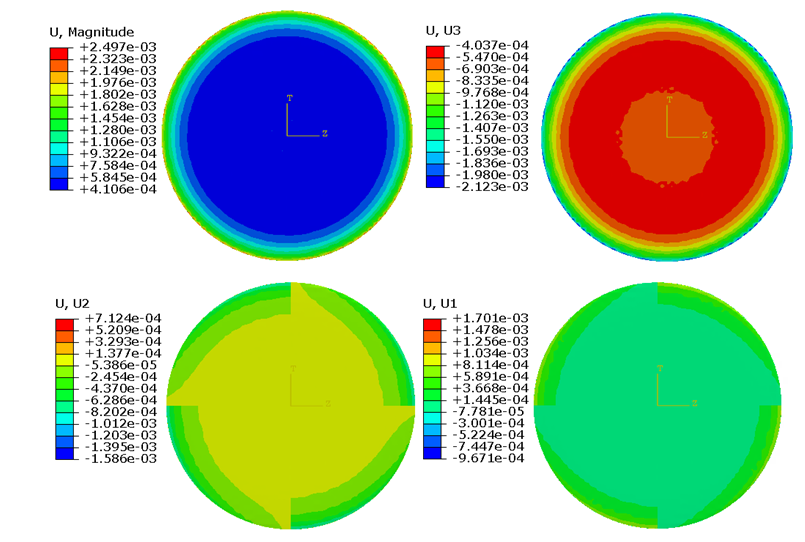
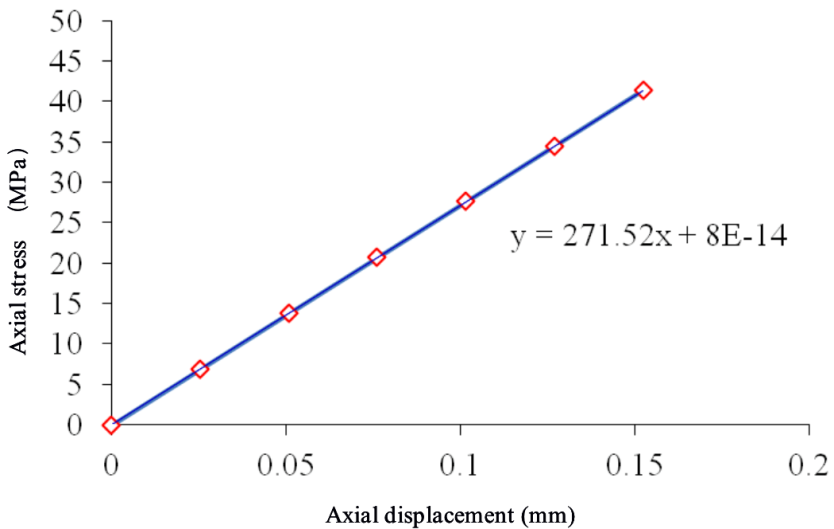
The displacement and stress cloud diagrams of the proppant columns are obtained through numerical simulation (Figure 8). The laboratory experiments in the literature verified the reliability of the simulation method in this paper. It can be seen Figure 8 that under the closure stress of 50 MPa, the axial displacement of the proppant column is 0.21 mm, and the radial displacement in the X and Y directions is 1.7 mm and 1.58 mm, respectively. According to Halliburton’s proppant column indoor rock plate compression test (Figure 9), it can be seen that the axial displacement of the proppant column under the 50 MPa closed stress condition is about 0.18 mm, which is consistent with the numerical simulation results and proves the reliability of the numerical simulation results.
Conclusion
- Based on the actual engineering geological characteristic parameters of the typical fracturing block in the HiWay fracturing of Shengli Oilfield, a finite element model of interaction between fracturing fracture and proppant column is established to simulate the fracture closure caused by the original ground stress during the channel fracturing and the deformation process of proppant column under pressure.
- According to the stress-deformation analysis of the fracture wall, under the 50 MPa closure stress, the fracture is completely closed in the model, and the proppant column cannot adequately support the fracture. However, the contact stress in a part of the fracture is still less than the closing pressure of the reservoir, which proves the proppant column still plays a specific role in improving the fracture conductivity at this time.
- According to the analysis of the change in the displacement of the crack wall, the distance between the upper and lower rock plates is a negative value, which means that the crack has been closed. And the higher the negative value, the more serious the compaction of the two plates. The middle part of the rock plate is more compact than the two sides. Furthermore, the cracks in the middle of the support area have been closed, but the closure stress in some surrounding areas is significantly reduced, which significantly improves the fracture conductivity.
- Quantitative characterization of the proppant column support area is carried out. In the total crack area, the area in the crack with less than the closure stress is regarded as the active support crack area. The practical support ratio of the proppant column was 67.8% through the calculation of the graphic area.
- For the displacement analysis of the proppant column, the axial displacement of the proppant column in the model is compared with the Halliburton indoor rock plate compression experiment results under the same conditions.
It finds that the numerical simulation calculation results in this paper are consistent with the indoor experimental results. Numerical simulation methods and models have excellent accuracy and representativeness.
References
-
Zhang T, Wang X, Mao X, Wang H (2014) Analysis of Application Effect of High-Speed Channel Fracturing Technology in Tight Oil Reservoir of XinJiang Oilfield. Drilling and Production Technology 37(6): 55-57.
-
Zhu H, Shen J, Zhou H (2018) Numerical Simulation on Propped Fracture Conductivity. Acta Petrolei Sinica 39(12): 1410-1420.
-
Samuelson ML, Stefanski J, Downie R, Mikhaylov AV, Ovsyannikov DA, et al. (2012) Field Development Study: Channel Hydraulic Fracturing Achieves Both Operational and Productivity Goals in the Barnett Shale. SPE Americas Unconventional Resources Conference, Society of Petroleum Engineers, Pittsburgh, Pennsylvania, USA.
-
Parra PA, Rubio N, Ramirez C, Valle Guerra BD, Exler VA, et al. (2013) Unconventional Reservoir Development in Mexico: Lessons Learned From the First Exploratory Wells. SPE Unconventional Resources Conference-USA, Society of Petroleum Engineers, The Woodlands, Texas, USA.
-
Abdelhamid MSA, Maarouf M, Kamal Y, Shaaban A, Mathur A, et al. (2013) Field Development Study: Channel Fracturing Technique Combined with Rod-shaped Proppant Improves Production, Eliminates Proppant Flowback Issues and Screen-outs in the Western Desert, Egypt. North Africa Technical Conference and Exhibition, Society of Petroleum Engineers, Cairo, Egypt.
-
Yudin A, Enkababian P, Lyapunov K, Nikitin A, Serdyuk S, et al. (2013) First Steps of Channel Fracturing in Russia Set New Directions for Production Increase of the Oil Fields. International Petroleum Technology Conference, Beijing, China.
-
Valenzuela A, Guzman J, Sanchez Moreno S, Garcia Mondragon G, Gutierrez Rodruigues LA, et al. (2012) Field Development Study: Channel Fracturing Increases Gas Production and Improves Polymer Recovery in Burgos Basin, Mexico North. SPE Hydraulic Fracturing Technology Conference, Society of Petroleum Engineers, The Woodlands, Texas, USA.
-
Wen Q, Gao J, Huang B (2014) Research on Distribution Pattern of Sand Bank for Channel Fracturing. Special Oil and Gas Reservoirs 21(4): 89-92.
-
Zhu H, Shen J, Zhang F (2019) A fracture conductivity model for channel fracturing and its implementation with Discrete Element Method. Journal of Petroleum Science and Engineering 172: 149-161.
-
Zhu H, Shen J, Zhang F, Huang B, Zhang L, et al. (2018) DEM-CFD Modeling of Proppant Pillar Deformation and Stability during the Fracturing Fluid Flowback. Geofluids 2018: 1-18.
- Nigeria’s Vulnerability in the Face of Global Energy Policy
- A Simulation Study of Investigation of Optimum Oil Production Performance by Applying Various Gas Injection Methods in Oil Reservoir
- Characterization of Permo-Triassic Reservoirs through Thermal Maturity Assessment of Westphalian Source Rocks in the Cheshire Basin
- Influence of Microwax on the Rheological and Thermal Behaviour of a Wax Crude Oil
- Real-Time Monitoring and Performance Optimization of Steam Injection in Heavy Oil Reservoirs Using Fiber Optic Sensing and Integrated Predictive Simulation Models
- Rapid On-Site Determination of the Total Petroleum Hydrocarbon Content of Soils by Handheld Fourier Transform Near-Infrared Spectroscopy: Development of a Global, Site- and Scanner- Independent Calibration Model