Tracking of Oil Water Contact in a Barail Main Reservoir
To supplement the current understanding of the reservoir and also to increase the confidence level in decision making, an understanding in the variation of Oil Water Contact is very much important. In this paper, a study of an integrated and efficient methodology for establishment of complex Oil Water Contacts in Barail Main Sand (water drive reservoir) for a part of one oilfield of Upper Assam Basin has been discussed. The Barail Formation which is the main producing reservoir exhibits unique behaviour in terms of fluid distribution. The aim of the study is to map the movement of Oil Water Contact with respect to time and production in the study area. The study is mainly based on the structural contour map drawn based on the open hole log data of drilled wells in different time frame throughout the development of the study area. Using Oil Field Management software a cross section had been prepared taking Oil Water Contact as base among the selected wells to track its trend in these wells of the study area. The present study shows that Oil Water Contact is disturbed upon the start of production and sensitive to the rate and volume of withdrawal from localized area. Aquifer is very active and vertical sweep efficiency in the reservoir is very good due to its reservoir properties which resulted a small transition zones as it is evident from the open hole logs of the wells drilled in different time span. The study also shows that as a result of the thinning of oil column and sand incursion owing to the high drawdown in the study area, the tracking of movement of Oil Water Contact is found to be very important.
Introduction
Oil Water Contact can be described as a bounding surface in a reservoir above which predominantly oil occurs and below which predominantly water occurs. Although oil and water are immiscible, the contact between oil and water is commonly a transition zone [1]. One of the most difficult input data is to define the original Oil Water Contact in the most prolific reservoir [2]. The oil water contact can be gradational in mixed-fluid reservoirs, but are typically horizontal or nearly so because of the differences in density between oil and water [3]. Even though such variations do not prevent the vertical fluid communication between the reservoir zones, they do represent an important factor for the interpretation of water saturation to effectively position of Oil Water Contact levels. In addition, the strong aquifer influx causes a rapid sweep of oil which challenges the interpretation of the original fluid surface position. The tracking of Oil Water Contact in a Water Drive Reservoir is very much important to enhance the current understanding of the reservoir so as to determine the rise in Oil Water Contact in various wells in different time span, variation in oil zone thickness and to know the remaining oil column in the reservoir. Tracking or monitoring of the Oil Water Contact in the field is done to design exploitation strategy for obtaining maximum recovery from the field.
The present study has been undertaken to study the tracking of Oil Water Contact in various wells with respect to time and withdrawal of production in a water drive reservoir of Upper Assam Basin.
Study Area
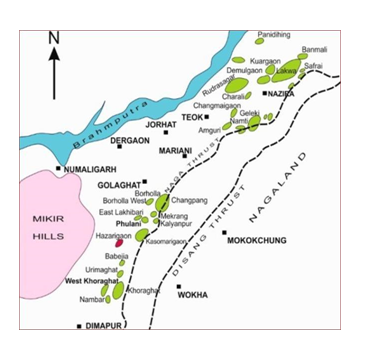
The study area is situated in Upper Assam Shelf (Figure 1) basin which was discovered in 1960 near Sibsagar town. Hydrocarbon accumulation is confined mostly to the topmost part of arenaceous unit of Barail group sand of Oligocene age named as Barail Main Sand (BMS) which is the main pay sand in the field. Main pay sands in the field are Barail Main Sand (BMS), Barail Coal Sand (BCS) – I, VIII and Tipam sand (TS- IV). The main BMS pool has been dissected by faults into five blocks, viz. Block-I, II, III, IV, V. Besides BMS, sands with Barail Coal Sand (BCS) of Oligocene Age and Tipam Sand (TS-IV- Miocene) also have contribution to the oil production of the field. The study is focused in a total of six wells of Block-I of the field to determine the shift of oil water contact in all the wells and to know their trends.
Barail Main Sand, the principal producing sand of the study area contains oil in the topmost part of the Sand. Oil confined in the Barail Main Sand reservoir by the shale contact at the top and the oil water contact at the bottom. Aquifer support is active and it was found that initial Oil Water Contact slightly varies in different fault blocks. The field was put on production in 1966 and a total of 200 wells have been drilled to develop the field. Cumulative oil production from the field till date is 9.82 MMT and up to 01.04.2014 about
99% of total production from the field has been produced.
Initial reservoir pressure was 312 Ksc which has come down to present level of 260-285 Ksc after a production near about more than 45 years. The field is producing under water drive. Initially, there was no water cut but with the passage of time the field has started producing water which is about 74% upto 2018. Hydrocarbon presences are spread over four main blocks, viz I, II, III and IV. Block-I & II are the main producing block. Block I is further subdivided into blocks IA, IB, IC, ID and IE, while Block II is divided into Blocks II-Main and IIA. Different blocks have fluid contacts as given below (Table 1): Table 1 below shows blocks having fluid contacts:
| OWC(m) MSL (BMS) | OSC (BCS-1) | Remarks | |
|---|---|---|---|
| IA | ---- | 3017 | Seen in well P |
| IB | 3028 | ---- | Seen in Q |
| IC | 3028 | ---- | Seen in R |
| ID | 3026 | ---- | Seen in S & T |
| IE | 3026 | ---- | Seen in U |
Table 1: Fluid Contacts of different blocks.
Present Study
The present study has been carried out based on conventional well log correlation [4] for projecting the Sand top. The Oil Water Contact is plotted in Oil Field Management software, MS-Excel and 3D Field Software. In the study well logs and the deviation data of all the wells drilled till 2014 were re-evaluated. The Barail Main Sand top and the Oil Water Contact encountered in the wells are also tabulated. As the block is divided into five sub blocks, it is important to study the trend of change of oil-water contacts for individual block. Hence performance analysis of individual block is important.
Performance Analysis of Block–I
There is good development of Barail Main Sand throughout the entire block whereas Barail Coal Sand-I is mainly developed in sub block-IA. The initial reservoir pressure was 312 ksc at 3028 mMSL. The current reservoir pressure data in the southern part of the block around wells X, Y, Z indicated the reservoir pressure decline to 230 ksc. The current reservoir pressure in the northern part of the block is around 280-290 ksc (2018). Water injection was initiated in 1985 and has been discontinued since 1998 due to the active aquifer support. Performance of Block-I of the field since inception (Figure 2)
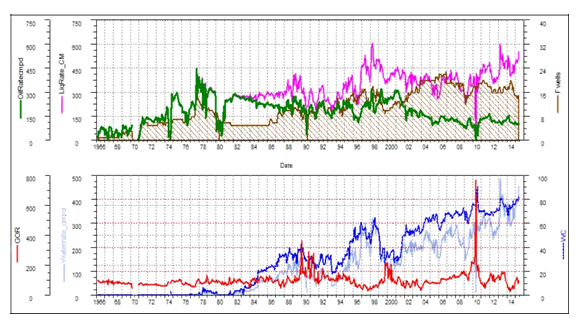
From the above performance plot it is seen that at the start of production the field yielded about 93.75 cmpd of oil with no water cut. No water cut was observed till 1978. But since 1978 water has begun to encroach the reservoir resulting in liquid production (oil +water). The peak liquid production was at 1998 with a total liquid production of 600 CM (Oil: 300 cmpd and Water: 300 cmpd) and hence the performance of the reservoir has declined with decrease in oil production but with considerable increase in Water cut. In recent wells water rate has been observed at a maximum of above 400 cmpd. This demonstrates that oil water contact is shifting with time along with cumulative production.
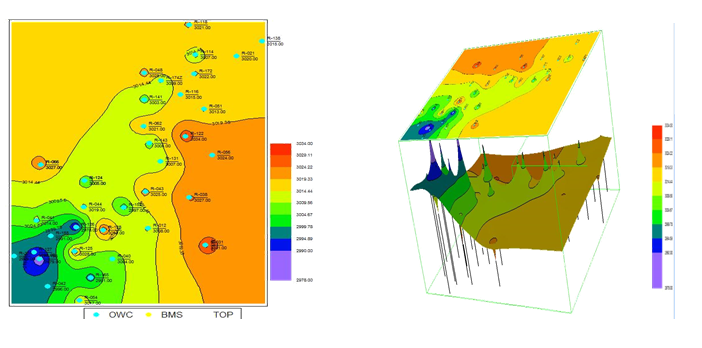
Determination of Oil Water Contact rise using Oil Field Management Software: The different fault blocks of Barail Main Sand reservoir in the field are interpreted by earlier researchers with different reserve base in different time. Hence in the current study to carry out Oil Water Contact mapping in time and space, a few wells were picked up in the study area and a correlation was made among the same wells. The wells picked up were drilled in a different time span in block I of the field. The figure shows a cross section of the selected wells (Wells no-1, 2, 3, 4, 5, 6) in the study area. The wells taken up for this study are shown in Figure 3.
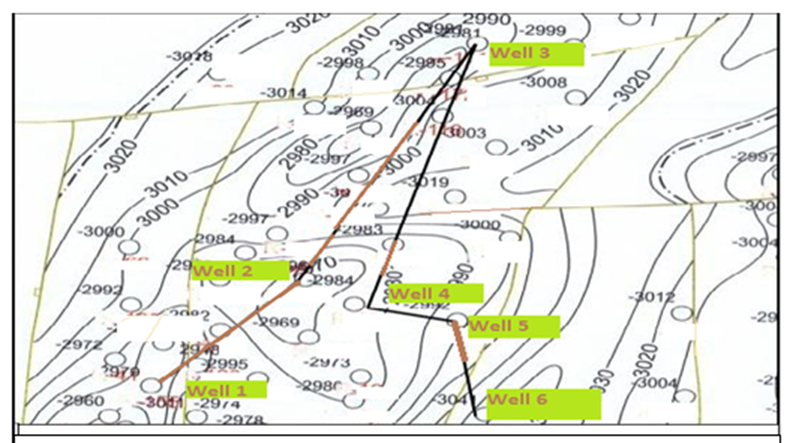
Using Oil Field Management software a cross section as shown in Figure 4 has been prepared taking the Oil Water Contact as base among the selected wells. The earliest well is well no 1 and the latest well is well no 6 and in this connection it has been observed that there has been a great shift in the Oil Water Contact observed in well no 1 and the Well no 6 and in those wells drilled in between.
The Oil Water Contact contacted in the selected wells is mentioned in the Table 2 below along with the BMS Top:
| Date | OWC (MD) | OWC (MSL) | BMS Top MD | |
|---|---|---|---|---|
| 1 | 1966 | 3146 | 3031 | 3129 |
| 2 | 1967 | 3148 | 3027 | 3112 |
| 3 | 1968 | 3168 | 3025 | 3130 |
| 4 | 1990 | 3211 | 3007 | 3180 |
| 5 | 1993 | 3120 | 2999 | 3089 |
| 6 | 1999 | 3232.5 | 2991 | 3221 |
Table 2: Oil Water Contact contacted in the selected wells along with the BMS Top.
The table 2 shows that the Oil Water Contact has been shifting with time. The Oil Water Contact observed in well 1 is at 3031 m which is taken as initial Oil Water Contact and shifting in the Oil Water Contact of the subsequent wells are calculated with reference to the original Oil Water Contact.
In the Well no 6 the Oil Water Contact is observed at 2991 mMSL. Thus the Oil Water Contact encountered in this well has been shifted from the original Oil Water Contact by (3031-2991)mMSL=40 mMSL. Thus the Water Table has gone up and pushed the oil level and the water table has risen by 40 m depth.
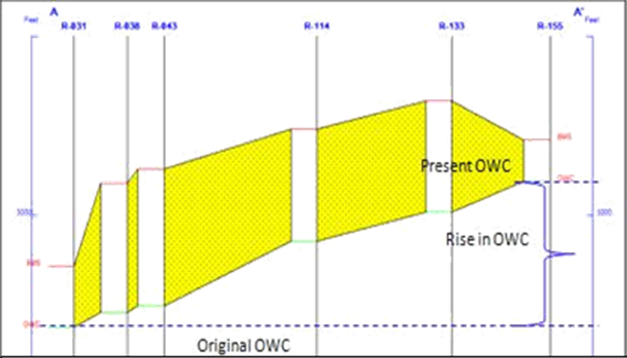
As production starts from Barail Main Sand Reservoir Oil Water Contact gets disturbed and it starts moving up slowly around the producers. Parallel to this movement in Oil Water Contact the field starts producing more water with oil and gas. As it is seen in the Figure 5. Oil Water Contact level has moved up in average in the whole block and the kink shows the local rise of level at few wells due to high withdrawal in that area.
Determination of OWC rise by Well Correlation
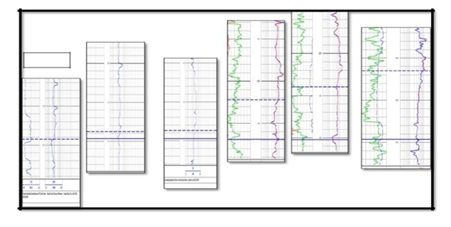
Typical example of shifting of Oil Water Contact can be clearly seen in the open hole logs recorded in the well. For well no 1 the initial Oil water contact is at 3031 m which is taken as the initial oil water contact for all the six wells. For well no 2 the Oil Water Contact is at 3027m which when determined using software with reference to the initial Oil Water Contact comes to 3151 m, i.e., the Water table has risen in the one year time. In well no 3, when determined using software the Oil Water Contact with reference to the initial Oil Water Contact is at 3171m. Similarly for wells no 4,
5, 6 the Oil Water Contact when determined using software with reference to the initial Oil Water Contact are at 3235 m, 3152 m, and 3272.5 respectively. Thus plotting the Oil Water Contact encountered in the wells with reference to the initial Oil Water Contact gives us the above figure when the subsequent logs are grouped together. Thus it is evident that the Water table has risen thereby thinning the oil column.
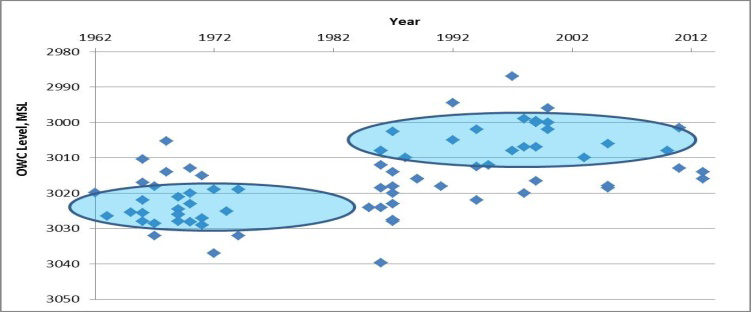
A cross plot of OWC in TVDSS vs time shows a notable rise in the OWC in all the six wells (Figure 7).
Discussions and Conclusions
The tracking of Oil Water Contact in a Water Drive Reservoir gives us a current understanding of the reservoir so as to determine the rise in Oil Water Contact in various wells in different time span and to determine variation in oil zone thickness. The initial oil water contact is found at a depth of 3031 m subsea at most part of the reservoir. From above study it is observed that there is a rise in Oil Water Contact when plotted by using both the Oil Field Management software and by well correlation. And at the same time, the rise in Oil Water Contact results in gradual thinning of the net oil column.
In the study area the aquifer is very active and vertical sweep in the reservoir is very good due to its reservoir properties which resulted in small transition zones as it is evident from the open hole logs of the wells drilled in different time span.
Moreover it is seen that the Oil Water Contact is disturbed upon the start of production and is sensitive to the rate and volume of withdrawal from the study area. Thus by determining the volume of oil remaining in the reservoir various strategies can be implemented to recover this oil volume. A quantitative idea was obtained regarding the remaining oil column in the reservoir by mapping of Oil Water Contact in the reservoir. From the above it is finally concluded that:
- Oil Water Contact is gradually rising with the thinning of the net oil column.
- Oil Water Contact is sensitive to the rate and volume of withdrawal from localized area
- The decline in reservoir pressure with oil withdrawals is maintained as water encroaches the reservoir with each withdrawal and hence maintains the reservoir pressure from depleting.
Nomenclature
| OWC | Oil Water Contact |
|---|---|
| BMS | Barail Main Sand |
| BCS | Barail Coal Sand |
| MSL | Mean Sea Level |
| Ksc | Kilogram per square centimeter |
| CM | Cubic meters |
| CMPD | Cubic meters per day |
| TVDSS | True Vertcal Depth measured from mean sea level |
References
-
Schlumberger Oilfield Glossary.
-
Rodriguez L, Leal J, Sanchez H, Hinojosa G (2015) Recognition of Oil-Water Contact architecture in water drive reservoirs by rock typing implementation, Sacha field of Equador. SPE Latin American and Caribbean Petroleum Engineering Conference, Society of Petroleum Engineers, pp: 15.
-
Ahmed T (2000) Reservoir Engineering Handbook. Gulf Professional Publishing, USA, pp: 866.
-
Unpublished ONGC reports.
- Nigeria’s Vulnerability in the Face of Global Energy Policy
- A Simulation Study of Investigation of Optimum Oil Production Performance by Applying Various Gas Injection Methods in Oil Reservoir
- Characterization of Permo-Triassic Reservoirs through Thermal Maturity Assessment of Westphalian Source Rocks in the Cheshire Basin
- Influence of Microwax on the Rheological and Thermal Behaviour of a Wax Crude Oil
- Real-Time Monitoring and Performance Optimization of Steam Injection in Heavy Oil Reservoirs Using Fiber Optic Sensing and Integrated Predictive Simulation Models
- Rapid On-Site Determination of the Total Petroleum Hydrocarbon Content of Soils by Handheld Fourier Transform Near-Infrared Spectroscopy: Development of a Global, Site- and Scanner- Independent Calibration Model