Evaluation of Micro-Distillation Methodology in Obtaining the Oil Distillation Curve Using Design of Experiments
In the evaluation of petroleum, the true boiling point (TBP) curve stands out among the characterization analyzes, as it is fundamental to assist in decision making such as pricing, royalty payment and petroleum valuation. This is possible by defining the yields of petroleum derivatives obtained as a function of their true boiling points. Its obtainment can partially conducted by applying the ASTM D2892 methodology, for fractions with temperatures up to 673 kelvin. Requiring a minimum volume of 1200 mL of oil and an average time of 48 hours. The present work aims to evaluate the feasibility of applying micro-distillation in the construction of the TBP curve, with volume and time reduction using reference oil. For this, established experiments will conducted according to the application of experiment planning and their results will compared with the curve obtained under standard conditions by ASTM D2892. The variables studied were distillation column size, heating rate control and magnetic bar shape. As a result, two conditions provided adjustment to the validation curve across the entire length of the conventional TBP ASTM curve, with the possibility of using columns of different sizes, minimum sample volume of 700 mL and reduction of total time to 16 hours and 40 minutes.
Introduction
The TBP curve together with the API grade, the pour point and the sulfur content are fundamental tests in the evaluation of an oil. This information used in the various segments of the oil and petrochemical industry [1, 2]. From this information, the quality and value of the oil can established, as well as its classification, such as light, medium or heavy. In addition, estimates can be made of the yield of its derivatives and the best application of oil [2, 3, 4, 5, 6, 7]. The TBP curve stands out among the analysis of oil characterization, due to its application in the most diverse areas of this industry, among them: exploration and production, logistics, refining and supply [6, 8]. The TBP curve can be constructed based on the mass or volumetric yield of a given range of boiling temperature, during petroleum distillation, under conditions described by ASTM D2892 and D5236 [6, 9].
The methods for performing TBP distillation experiments a crude petroleum to a final cut temperature of 673 K Atmospheric Equivalent Temperature (AET) are described by ASTM D2892 [10]. In ASTM D2892, the distillation carried out at atmospheric pressure first and the pressure is dropped to 0.25 kPa using a theoretical 14 to 18 theoretical plate’s column [10, 11, 12]. The specifications for determining cuts at temperatures above 673K applied from the ASTM D5236 method not used in this article [13].
In refining, there are units that receive loads from the mixture of oils whose composition can vary and demand different operating conditions. Although there are mathematical, models and simulators that estimate the TBP curve of these blends [14, 15], it is interesting to provide a quick experimental method for determining the TBP curve. For these cases, a micro-distillation system can be used, which still allows obtaining fractions for later analysis [5, 16, 17]. In these fractions, the density and other properties can be determined for the constant monitoring of the refining process [17, 18, 19].
In order to implement the micro-distillation system, an experimental design was conducted. In order to identify the best operating conditions and suitability for the method to build the TBP curve. The idea here is to make it possible to use a small amount of oil sample (< 1 liter) and the Spaltrohr column, aiming at validating the curve obtained based on the traditional TBP curve of a standard oil, in the shortest possible execution time, for the temperature range between 348 K and 673 K.
The influence of the operational variables of interest could be determined, aiming at the proposition of
The control of the system donned through a Touch IHM coupled to the unit’s structure, which allows the inclusion of the necessary programs for each stage of the distillation. Programming involves the inclusion of cutting temperatures and the direct or indirect adjustment of the powers for heating the reboiler, column blanket and heating tape.
At the top of the column, there is a valve, which allows the maintenance of reflux in the column. At the beginning mathematical correlation models in relation to desired properties for the process. As well as cuts were collected allowing further characterizations.
Materials and Methods
Distillation System
The distillation system initially acquired from the i-Fischer company was later modified by the inclusion of an annex with a lower height column and manual collection. The original system contains a reboiler, column and top condenser, with a PT100 for the system temperature control. The referrer has a coupling system. The column called by the manufacturer Spaltrohr consists of a glass rod with fins along its height, through which the condensed material flows after thermal exchange with the other components, making it possible to obtain a good separation efficiency [20].
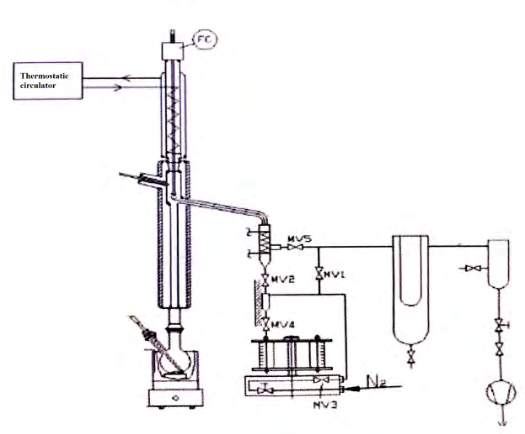
The removal of the cuts occurs only on the upper side of the column, where the distillation head is located. After the distillation head, on the side of the system, we have: the intermediate collector, covered by a heating tape, to avoid crystallization of heavier cuts; and, the flasks for automatic collection of fractions. The commercial model of the system also has a cold finger, for light retention, and a Lung before the vacuum pump, as shown in Figure 1 [20].
of the operation, while heated the system, the reflux valve remains obligatorily closed and opens when identified presence of steam at the top of the column. When identified steam at the top, separation into fractions begins, according to the established schedule. The distillation monitoring is done on the Touch IHM, where it is possible to visualize in real time the temperatures and heating powers of the reboiler, the load, the column blanket, the top of the column and the heating tape of the collector, as well as instantaneous system pressure.
Procedure
Initially, turn on the Touch IHM to activate the pre- established programming for each test. Turn on the heating/ cooling baths of the condensers too, with the temperatures set in relation to the cut-off temperatures. As well as the compressed air compressor and the nitrogen system, which are responsible for activating the valves. In parallel, start analysis reference oil for water content and density.
For each experiment established in the experimental design used an initial sample load with 700 mL of reference oil, weighed on a semi-analytical balance. A magnetic stirrer of the defined shape is added to the flask containing the charge. All collection bottles are marked and weighed.
The distillation starts under the control of the established schedule. When the steam reaches the top of the column and reaches the cut temperature programmed in the IHM Touch, the fraction automatically segregate for the system and directed to the flask. This occurs at each cut temperature established, and there may be several temperatures depending on the planning performed. All fractions collected need to be weighed and characterized as to their density, in addition to recording the collection time.
During all the distillation, the temperature of the charge must not exceed the temperature of 583 K to avoid sample degradation. Therefore, are established schedules with different pressures. Starting with atmospheric pressure (101.3 kPa), then moving to 100 mbar (9.9 KPa) and 2.6 mbar (0.27 KPa) settings. At each schedule, the system need cooled down to restart subsequent schedules. The average time for cooling is 2 hours.
After the end of the distillation, the residue of the sample remaining in the charge flask must be weighed and characterized as to its density and the total time of each programming and of the total distillation is noted. Cooling times were not taken into account for each schedule.
At each experiment, the system need cleaned by distillation of toluene. This procedure is extremely important to keep the equipment in perfect conditions for use for the next distillation.
Operating Variables
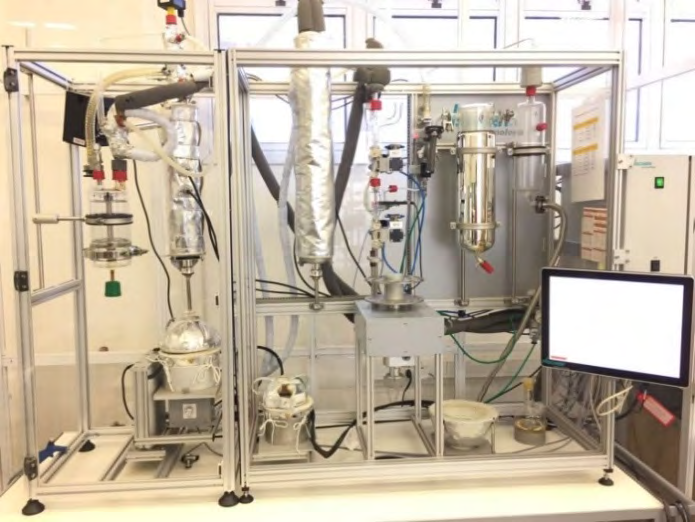
To determine the appropriate conditions for the use of the micro-distillation system, to obtain the petroleum distillation curve, it was designed an experimental design with the operational variables: column size, heating rate control way and magnetic stirrer shape. In Figure 2, the micro-distillation system used can be seen, modified model HMS 500 AC da i-Fischer, containing the smallest column on the left (A1 - height 560 mm and internal diameter of 25 mm), and on the right the larger column (A2 - height 740 mm and internal diameter of 25 mm).
The control of the heating rate in this system can be driven by the power supplied to the reboiler based on the temperature delt in relation to the temperature of the top of the column or the temperature of the load. The power of the reboiler is defined according to the required heat load. At the beginning of the distillation, the potency may have lower values as considerable percentages of light fractions are present. As these fractions are collected, more power is required in order to guarantee the maintenance of column balance and efficiency. The power supplied is extremely important, because if the thermal load is less than ideal, the distillation can become very slow, due to the generation of a lower flow of steam, or even not occur. If the thermal load is higher than ideal, it will negatively affect the separation efficiency, which can cause column flooding and even projections, interrupting the liquid vapor balance necessary for the proper execution of the distillation. In this way, the power of the reboiler was initially maintained at 188 W, which corresponds to a temperature ramp of 274.85 K/min. In addition, the change was made in accordance with the conditions established in the experimental design, as shown in Table 1.
| Temperature Delta Variations | Delta Temperature (K) |
|---|---|
| Top of Column (B1) | 278.15 |
| Load/Sample (B2) | 348.15 |
Table 1: Operating conditions B1 and B2 of the heating rate control form.
The size and shape of the magnetic stirrer used influence the fluid flow profile and the load turbulence level. Not is desired a severe turbulence, as it interferes with the equilibrium condition and favors bubble coalescence, influencing the pressure profile and the safety of the operation. Thus, evaluate a shape of the stirrer used becomes an interesting variable. The Table 2 shown the types of magnetic stirrers evaluated.
| Illustrative Images | Measurements | |
|---|---|---|
| Flat Magnetic Bar (C1) | 8.2 mm Diameter | |
| Flat Magnetic Bar (C1) | 25.0 mm Length | |
| Flat Magnetic Bar with Ring (C2) | 8.5 mm Diameter | |
| Flat Magnetic Bar with Ring (C2) | 27.8 mm Length |
Table 2: Variations of the magnetic stirrers used: C1 and C2
Based on the variables mentioned above, an experimental design was proposed with the objective of evaluating the effects of the influence of these variables: column size (A1 - 560 mm and A2 - 740 mm), way of controlling the heating rate (B1 and B2) and magnetic stirrer format (C1 and C2). The Design Expert software used to generate the experiments and analyze the results from Stat Ease in the version 9. The proposed design based on the two-level factorial analysis methodology resulted in eight experiments, presented in Table 3. Execution of the experiments done in random order. In the Table 3 presentation of the tests was made by type of column, to facilitate observations on the influence of this variable.
| Variables Column Size | Heating Rate Control Method | Magnetic Stirrer Shape | |
|---|---|---|---|
| 1 | A2 | B1 | C2 |
| 2 | A2 | B2 | C2 |
| 3 | A2 | B1 | C1 |
| 4 | A2 | B2 | C1 |
| 5 | A1 | B1 | C2 |
| 6 | A1 | B2 | C2 |
| 7 | A1 | B1 | C1 |
| 8 | A1 | B2 | C1 |
| Schedule | Cuts | Temperature Range (K) | Operating Pressure (kPa) |
| 1 | 1 to 5 | 348 a 448 | 101.3 |
| 2 | 6 to 10 | 473 a 573 | 9.9 |
| 3 | 11 to 14 | 598 a 673 | 0.27 |
Table 3: Proposed two-level factorial planning.
Each of the experiments involved the collection of 14 cuts with a temperature range of 25 K. For this to be possible, following the conditions described in ASTM D2892, and without load degradation, schedules involving different pressures were necessary, as shown in Table 4.
For analysis of results and evaluation of the influence of variables, the following answers established mass percentage obtained in each schedule, distillation duration time on each schedule and total distillation time.
The experimental conditions established for each experiment were kept fixed throughout all schedules, which can influence the point-to-point evaluation.
Results and Discussion
Table 5 presents the results of the mass percentage accumulated in each cut, for each of the proposed factorial experiments, plus the information on the reference value of the original TBP curve.
| Cutting Temperature (K) | Cumulative Mass Percentage | ||||||||
|---|---|---|---|---|---|---|---|---|---|
| Original TBP Curve | Exp.1 | Exp.2 | Exp.3 | Exp.4 | Exp.5 | Exp.6 | Exp.7 | Exp.8 | |
| 348 | 5.2 | 4.5 | 5 | 4 | 4.5 | 5.5 | 5 | 4.8 | 4.5 |
| 373 | 8,0 | 7.3 | 8 | 6.8 | 7.3 | 8.9 | 8.4 | 7.8 | 8.1 |
| 398 | 11.5 | 10.5 | 11.6 | 10.1 | 10.5 | 12.9 | 12.3 | 11.8 | 11.8 |
| 423 | 15.2 | 14.8 | 15.9 | 14.2 | 14.4 | 17.2 | 16.6 | 16.1 | 16.1 |
| 448 | 19.7 | 19.6 | 20.7 | 19 | 18.8 | 21.9 | 21.5 | 20.9 | 20.8 |
| 473 | 23.9 | 24.2 | 25.5 | 23.3 | 22.6 | 25.6 | 24.9 | 24.6 | 24.4 |
| 498 | 27.7 | 28.4 | 29.8 | 27.7 | 26.9 | 29.9 | 29.3 | 28.9 | 28.8 |
| 523 | 31.9 | 32.7 | 33.9 | 33.6 | 31.2 | 34.2 | 33.6 | 33.2 | 33.1 |
| 548 | 36.5 | 37.5 | 39.4 | 38.4 | 35.6 | 38.9 | 38.2 | 37.8 | 37.7 |
| 573 | 41 | 42.3 | 44 | 43 | 40.1 | 43.5 | 42.7 | 42.3 | 42.2 |
| 598 | 43.3 | 47 | 48.9 | 47.4 | 44.8 | 46.5 | 46.2 | 45.6 | 44.4 |
| 623 | 48.7 | 51.5 | 52.6 | 52.6 | 48.7 | 51.3 | 50.2 | 50.1 | 50.3 |
| 648 | 53.2 | 55.4 | 56.9 | 56.7 | 52.1 | 55.7 | 55.2 | 54.4 | 54.9 |
| 673 | 57.2 | 59.3 | 60.8 | 61 | 56 | 59.8 | 60.4 | 58.1 | 59.3 |
Table 4: Accumulated mass percentage results versus the temperature of distillations 1 to 8.
The graphical representation of Table 5 shown in Figure 3, subdivided into A and B, based on the size of the columns. All curves modeled by a degree five polynomial.
In Figure 3 it can be seen that apparently none of the curves fits the entire length of the TBP ASTM curve. In Figure 3A, the curves obtained in column A2 show a more accentuated deviation from the standard TBP curve after 500 K. Moreover, in Figure 3B, the curves obtained in column A1 show a much greater similarity with the standard TBP curve, with deviation occurring in some conditions above 600 K.
Despite visually seeing a deviation between the curves, the numerical comparison is fundamental for the validation or not of the methodology. Deviations in the order of 2.0% are accepted.
Regarding the distillation time, Table 6 shows the time of each programming (same temperature and pressure) and the total time to produce the 14 cuts, only considering the distillation time. For the total analysis, time an average of 4 hours needs to added for the cooling times.
700
700
| ASTM 1 | |||||||||||
| 2 3 4 |
Table 5: Time spent on total oil distillation and for each schedule.
| 5 | ||||||||||||||||
| ASTM | ||||||||||||||||
| 6 7 8 |
Table 6: Time spent on total oil distillation and for each schedule.
0 10 20 30 40 50 60 70
Percentage Accumulated in Mass
3B Figure 3: Comparison of the distillation TBP curves obtained in the experiments 1 to 4 column A2 (3A) and 5 to 8 column A1 (3B).
| Experiments | Oil Cuts (H:MM) | |||
|---|---|---|---|---|
| 1 a 5 | 6 a 10 | 11 a 14 | Total | |
| 1 | 2:29 (149) | 6:46 (406) | 12:39 (759) | 21:54 (1314) |
| 2 | 2:19 (139) | 7:18 (438) | 6:13 (373) | 15:50 (950) |
| 3 | 2:24 (144) | 5:35 (335) | 6:06 (366) | 14:05 (845) |
| 4 | 2:18 (138) | 3:42 (222) | 6:40 (400) | 12:40 (760) |
| 5 | 3:58 (238) | 3:22 (202) | 4:45 (285) | 12:05 (725) |
| 6 | 1:13 (73) | 2:48 (168) | 2:43 (163) | 6:44 (404) |
| 7 | 3:48 (228) | 2:50 (170) | 6:04(364) | 12:42 (762) |
| 8 | 1:18 (78) | 2:38 (158) | 2:39 (159) | 06:35 (395) |
Table 7: Time spent on total oil distillation and for each schedule.
An initial analysis of Table 6 shows that, depending on the operating conditions used, we can have a considerable increase in the time taken to complete each schedule and, consequently, in the total distillation time.
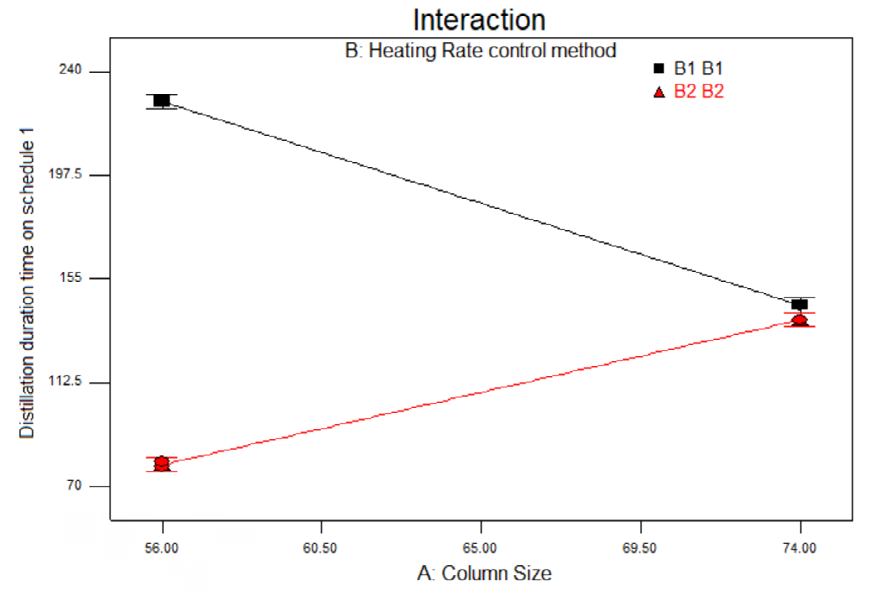
For schedule 1, it was possible to obtain the 5 cuts in a variation between 1 hour and 13 minutes to 3 hours and 58 minutes. The experiments involving the use of column A2 had the times little changed by the changes in the other variables, despite being almost twice the lowest time observed. However, in the experiments with column A1, the times influenced by the conditions of the other variables. For schedule 2, the times spent in experiments involving column A2 were greater than bigger in column A1, with the exception of experiment 4. Moreover, for schedule 3, the influence of the type of column seems to have a great impact on the times spent, being the lowest values obtained using column A1.
Even so, the differences were substantial for this column A1 itself depending on the conditions of the other variables. It is important to note that the premise of shorter time is not fundamental, as the focus is on framing the target value of mass percentage in relation to the standard TBP value.
Thus, the use of the results of the accumulated mass percentage of each schedule allows evaluating the influence of operational variables and identifying the critical steps of the process, as shown in Table 7. The application of this premise occurs because only changing the use of a certain column makes sense, after carrying out a complete schedule.
| Program | Cumulative Mass Percentage | ||||||||
|---|---|---|---|---|---|---|---|---|---|
| Original TBP Curve | Exp.1 | Exp.2 | Exp.3 | Exp.4 | Exp.5 | Exp.6 | Exp.7 | Exp.8 | |
| 1 (448K) | 19.7 | 19.6 | 20.7 | 19.0 | 18.8 | 21.9 | 21.5 | 20.9 | 20.8 |
| 2 (573K) | 41.0 | 42.3 | 44.0 | 43.0 | 40.1 | 43.5 | 42.7 | 42.3 | 42.2 |
| 3 (673K) | 57.2 | 59.3 | 60.8 | 61.0 | 56.0 | 59.8 | 60.4 | 58.1 | 59.3 |
Table 8: Accumulated mass percentage results versus the final cutting temperature of the programs.
Considering the acceptable deviation of ± 2.0 % for each schedule, the experiments that do not meet the reproduction of the standard TBP value were: in schedule 1 only experiment 5 (A1); in schedule 2, experiments 2 (A2) and 5 (A1); and in schedule 3, the experiments 1, 2 e 3 (A2) e 5, 6, 8 (A1). Thus, it can be concluded, in a preliminary way, that experiments 4 (A2) and 7 (A1) fully meet the reproduction of the standard TBP values.
1, Exp.8 (A1) in schedule 2 and Exp.7 (A1) in schedule 3. Proving to be an expected behavior, as the distillation takes place, the concentration in the heavier fractions increases and the column size can start to have a greater impact. The Table 8 present a summary of the influence values to confirm this placement and observe other influences. Values were calculated for each variable and their interactions, based on least squares, as well as the model’s p-value, standard deviation and correlation coefficient (R2) by analysis of variance (ANOVA) using the Design Expert 9.0.3.1 software.
- The experiments that resulted in the smallest deviation from the standard TBP value were Exp. 1 (A2) in schedule
- Response
- Influence p-Value Treated
- Model
- Detour
- Pattern
- R2
- Mass Percentage Obtained In
- Each Schedule
- A
- B
- C
- AB
- AC
- BC
- ABC
- Schedule 1
- -1.78
- 0.12
- 1.02
- 0.32
- 0.23
- 0.22
- 0.43
- 0.0169
- 0.16
- 0.9944
- Schedule 2
- -0.34
- -0.51
- 1.21
- -0.09
- 0.39
- 0.96
- 1.34
- 0.0067
- 0.1
- 0.9978
- Schedule 3
- -0.1
- -0.45
- 1.5
- -1.3
- 0.05
- 1.5
- 1.75
- 0.004
- 0.11
- 0.9987
- Distillation Duration Time On
- Each Schedule
- A
- B
- C
- AB
- AC
- BC
- ABC p-Value
- Detour
- Pattern
- R2
- Schedule 1
- -12.03 -82.47
- 2.47
- 74.47
- 0.5
- -5.03
- 3.03
- 0.0003
- 1.13
- 0.9999
- Schedule 2
- 175.87 -31.87
- 82.38 -8.62 61.13 30.87
- 41.62
- 0.0046
- 0.71
- 1
- Schedule 3
- 231.38 -169.37 72.38 -6.62 110.63 -84.63 -125.38
- 0.0011
- 7
- 0.9996
- Total Distillation Time
- A
- B
- C
- AB
- AC
- BC
- ABC p-Value
- Detour
- Pattern
- R2
- 395.25 -283.75 157.25 59.25 172.25 -58.75 -80.75
- 0.0067
- 2.83
- 1
Table 9: Summary of results obtained by ANOVA for statistical analysis.
All models generated were statistically significant assuming a confidence interval of 95 % and correlation coefficients greater than 0.99. In all the responses studied, the triple interaction between the independent variables studied observed, showing their importance and correlation for the result obtained.
The change in column size, from A1 (560 mm) to A2 (740 mm), had a negative impact, reducing the amount of mass obtained, especially in schedule 1, in which the time was little changed. However, it was responsible for a considerable increase in the time of schedules 2 and 3. This must considered when defining the conditions of the validation tests.
The change in the way of controlling the heating rate, from B1 (delta in relation to the top) to B2 (delta in relation to the sample), was not significant for the percentage of mass obtained in practically all programs, but even so, more relevant than the column size for schedules 2 and 3. As for the time, this change promoted the reduction of the time of all programming, with emphasis on schedules 3.
The change in the shape of the magnetic stirrer, from C1
to C2, was very relevant for most of the responses evaluated. For schedules 2 and 3, it was the individual variable that generated the greatest increase in the value of the mass percentage obtained, also increasing the duration of the schedules.
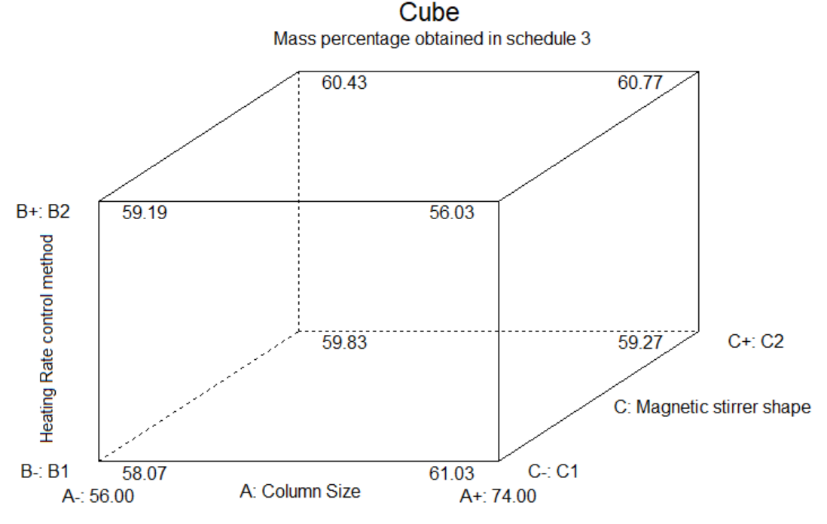
All these observations allow an understanding of the effect of the assumed variation for each variable studied. The complete distillation up to 673 K carried out following the conditions established by the experimental design. For the validation of the use of this micro-distillation system, the achieved value of mass percentage must be equivalent to the result obtained in a conventional distillation system with an acceptable deviation of up to 2.0%. Thus, there is now a default mass percentage value to reach for each programming. In addition, for this to happen, it may be necessary to use different control conditions, changing the variables at each programming. However, in the case of the magnetic stirrer, due to the viscosity pattern of the charge throughout the distillation, it makes no sense to replace it by programming. Thus, only one of them should chose. As the greatest influence of the type of agitator used was in schedule 3, this was used to define the most suitable one, as shown in Figure 4.
It is clear that the C2 magnetic stirrer cannot reach the standard TBP target, presenting values above the acceptable deviation of 2.0%. Thus, the C1 smooth magnetic stirrer was the ideal choice for validation, as it allows for shorter distillation times.
For schedule 1, the desired default mass percentage value is 19.7 ± 2.0 % (17.7 to 21.7). In the Figure 5 following interaction between the other variables, assuming the use of the smooth magnetic stirrer C1.
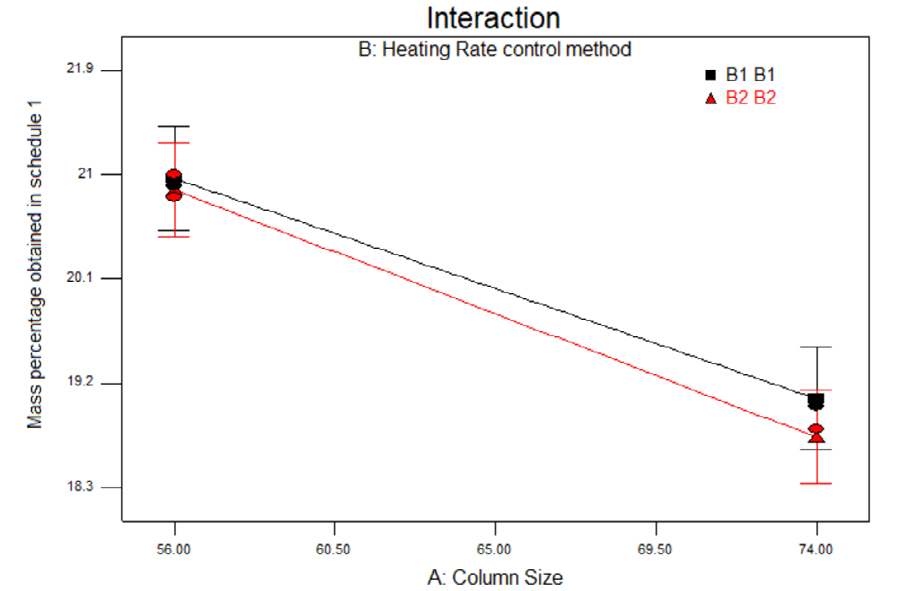
All conditions allow reaching the standard TBP target value within the deviation of 2.0%. The conditions that involve the shortest time are with the use of column A1 and the control method B2 (background) referring to experience 8. As for the type of control method in this case, there is a slight advantage for B1, but it is not significant variations were observed in the time spent and in the percentage of
mass obtained.
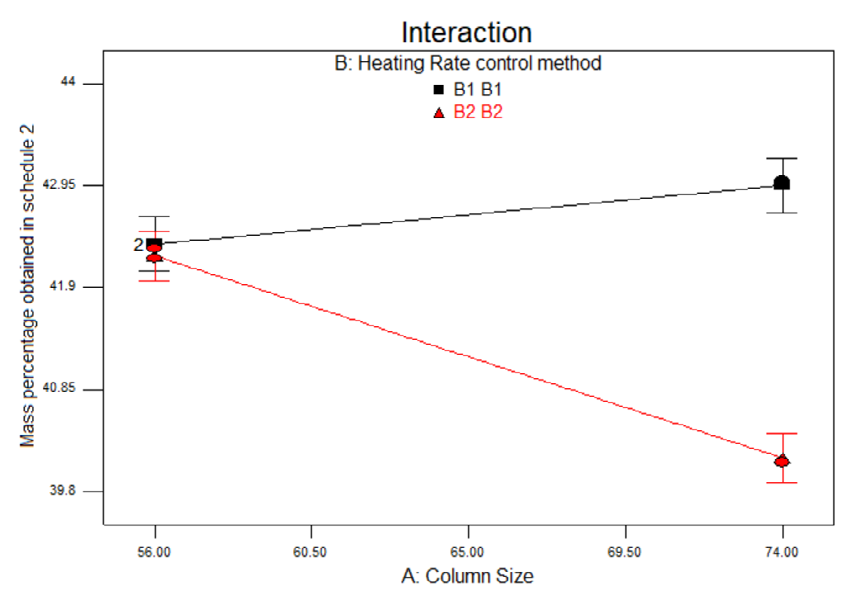
For schedule 2, the desired default mass percentage value is 41.0 ± 2.0 % (39.0 to 43.0). In the Figure 6 following interaction between the other variables, assuming the use of the smooth magnetic stirrer C1.
All conditions allow reaching the standard TBP target value within the deviation of 2.0%. The conditions that involve the shortest time are with the use of column A1, with little variation between the control method B1 (top) and B2 (bottom) referring to experiments 7 and 8.
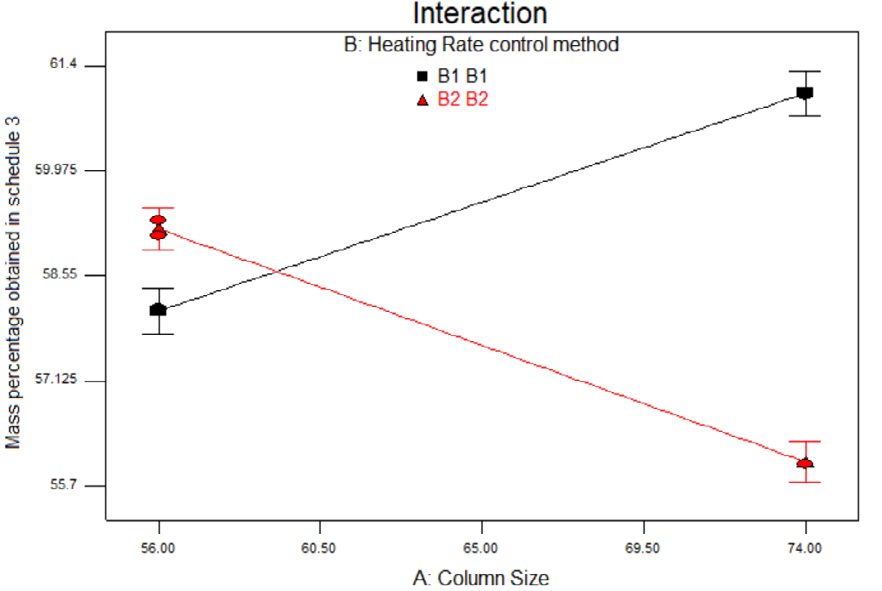
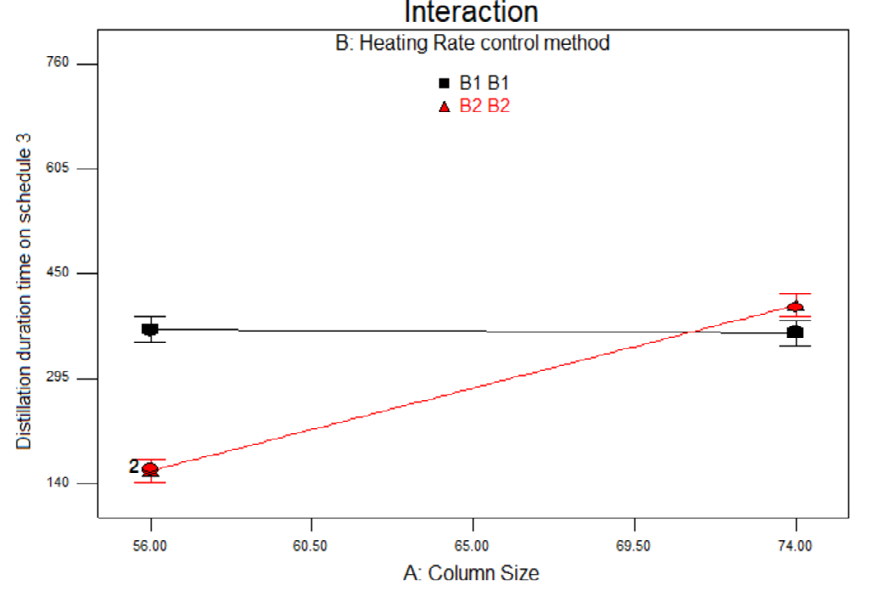
For schedule 3, the desired default mass percentage value is 57.2 ± 2.0 % (55.2 to 59.2). In the Figure 7 following interaction between the other variables, assuming the use of the smooth magnetic stirrer C1.
In this case it is observed that there are only two conditions that reach the target value of the standard TBP within the deviation of 2.0 % related to each of the columns, experiments 4 (A2, B2) and 7 (A1, B1). In the graph that shows the time spent, the condition that involves the shortest time is the one with the use of column A1, with the control method B2 (background) that does not reach the standard TBP value and, therefore, cannot be used. Thus, in order to meet the established target, time ends up being impacted, with a slight reduction in the use of column A1 with control B1 in relation to column A2 with control B2.
After all these critical analyses, it is concluded that the use of the micro-distillation system could be validated for the standard oil studied, based on the results of experiments 4 and 7 in full. It is possible to use either of the two columns tested with a sample volume of 700 mL. When using column A1, with agitator C1, the control must be B1, made by the top delta. In addition, if the column is A2, with the C1 shaker, the control must be B2, made by the sample delta. In both situations, the time spent was around 12 hours and 40 minutes.
Conclusion
The use of experimental design allowed obtaining statistically significant models for all responses, assuming a confidence interval of 95% and correlation coefficients greater than 0.99. Being possible to evaluate the influence and importance of the variables and their interactions in the results obtained.
The PEV curve obtained in the micro-distillation system was validated in its entirety, for the reference oil used, based on the results of the mass percentage of the cuts obtained under the conditions of experiments 4 and 7, guaranteeing deviations of less than 2.0% compared to standard TBP.
The use of the micro-distillation system allowed the reduction of the amount of sample to 700 mL and a reduction of time to 16 hours and 40 minutes, enabling the use of this system for the construction of TBP curves in oils with characteristics similar to the reference.
References
-
Argirov G, Ivanov S, Cholakov G (2012) Estimation of Crude Oil TBP from Crude Viscosity. Fuel 97: 358-365.
-
Hosseinifar P, Shahverdi H (2022) Prediction of the ASTM and TBP Distillation Curves and Specific Gravity Distribution Curve for Fuels and Petroleum Fluids. The Canadian Journal of Chemical Engineering 100(111): 3288-3310.
-
Khanmohammadi M, Garmarudi AB, La Guardia M (2012) Characterization of Petroleum Based Products by Infrared Spectroscopy and Chemometrics. Trends in Analytical Chemistry 35: 135-149.
-
Lopes MS, Lopes MS, Maciel Filho R, Maciel MR, Medina LC (2012) Extension of the TBP Curve of Petroleum Using the Correlation DESTMOL. Procedia Engineering 42: 726-732.
-
Marques MLSP (2011) Micro-Distillation Oil Characterization-Alternative for Petroleum Evaluation. Federal University of Rio de Janeiro, Rio de Janeiro, Brazil.
-
Szklo A, Uller VC (2012) Fundamentals of Petroleum Refining-Technology and Economics. 3rd(Edn.), Interscience, Rio de Janeiro, Brazil.
-
Montgomery DC, Runger GC (2009) Applied Statistics and Probability for Engineers. 4th(Edn.), Rio de Janeiro, Brazil.
-
Long NVD, Lee M (2017) Process Intensification in Distillation Systems: Main Trends for Improving Petrochemical Process Performance. Pet Petro Chem Eng J 1(6): 1-4.
-
Santos RNG, Lima ERA, Paredes MLL (2021) ASTM D86 Distillation Curve: Experimental Analysis and Premises for Literature Modeling. Fuel 284: 118958.
-
American Society of Testing and Materials, ASTM D2892-20 (2020) Distillation of Crude Petroleum (15-Theoretical Plate Column).
-
Espinosa-Pena M, Figueroa Gomez Y, Cano-Dominguez JL (2022) Analytical Validation of Test Standard SIMDIS Method ASTM D5307-97 for Determination of Range Boiling Point of Crude Oil by Gas Chromatography. ACHEAMERICA 2002 in the First International Congress on Process Technologies, Mexico, pp: 18-20.
-
Lemus MCS (2015) Extend Distillation and Property Correlations for Heavy Oil. University of Calgary, Alberta, Canada.
-
American Society of Testing and Materials, ASTM D5236- 18A (2018) Standard Test Method for Distillation of Heavy Hydrocarbon Mixtures (Vacuum Potstill Method).
-
Meirelles LB, Chrisman ECAN, Andrade FB, Oliveira LCM (2017) Comparison of the Distillation Curve Obtained Experimentally with the Curve Extrapolated by a Commercial Simulator. International Journal of Chemical and Molecular Engineering 11(3): 260-264.
-
Yang RJ, Liu CC, Wang YN, Hou HH, Fu LM (2017) A Comprehensive Review of Micro-Distillation Methods. Chemical Engineering Journal 313: 1509-1520.
-
Giordano GF, Vieira LCS, Gomes AO, de Carvalho RM, Kubota LT (2021) Distilling Small Volumes of Crude Oil. Fuel 285: 119072.
-
LI Y, Qian F, Song Y (2021) Modeling of Crude Oil Distillation Units Based on Feature Selection and Its Application in Planning Optimization. CIESC Journal 72(3): 1419-1429.
-
Espada JJ, Fernández S, Velasco L, Coto B (2013) Evaluation of Different Methodologies to Determine the n-Paraffin Distribution of Petroleum Fractions. Fuel 109: 470-475.
-
Sundberg AT, Uusi-Kyyny P, Jakobsson K, Alopaeus V (2013) Control of Reflux and Reboil Flow Rates for Milli and Micro-Distillation. Chemical Engineering Research and Design 91: 753-760.
-
Fischer (2022) Automatic Semi-Micro-Distillation-Unit. Fischer® Labodest® HMS 500 AC.
- Nigeria’s Vulnerability in the Face of Global Energy Policy
- A Simulation Study of Investigation of Optimum Oil Production Performance by Applying Various Gas Injection Methods in Oil Reservoir
- Characterization of Permo-Triassic Reservoirs through Thermal Maturity Assessment of Westphalian Source Rocks in the Cheshire Basin
- Influence of Microwax on the Rheological and Thermal Behaviour of a Wax Crude Oil
- Real-Time Monitoring and Performance Optimization of Steam Injection in Heavy Oil Reservoirs Using Fiber Optic Sensing and Integrated Predictive Simulation Models
- Rapid On-Site Determination of the Total Petroleum Hydrocarbon Content of Soils by Handheld Fourier Transform Near-Infrared Spectroscopy: Development of a Global, Site- and Scanner- Independent Calibration Model