Petrophysical Calculation Analysis and Determination of Cut Off in Betung Field Jambi Sub Basin South Sumatera Basin
Petrophysical properties provide a comprehensive approach to reservoir characterization, in which reservoir quality is of paramount importance. The main controllers for reservoir quality are porosity, permeability and clay content. Petrophysical models are used by utilizing the correlation between tool response (logging) and rock and fluid properties. These petrophysical results will be cut-off to distinguish productive and unproductive parts of a reservoir. Petrophysical and cut-off calculations in the Betung Field are applied to determine the quality and productive zone of the Air Benakat Formation reservoir. The direction of field development (infill wells) is based on the quality of the reservoir and productive zone obtained based on the results of petrophysical and cut-off calculations. This research was conducted in Layer 5 (L-5) of the Betung Field using the main data, namely well logs (Gamma ray, density, neutron, resistivity). Well logs were processed to obtain petrophysical values using Interactive Petrophysic and Microsoft Excel software. Petrophysical results were then cut-off on clay content, porosity and water saturation, so that a productive zone was obtained from the Betung L-5 field. Petrophysical and cut-off results show L-5 is a Hydrocarbon prospect zone with an average petrophysic value for well 210 (Vclay: 32%, porosity: 25% and water saturation: 65%); well 220 (Vclay: 35%, porosity: 30% and water saturation: 38%); well 222 (Vclay: 8.2%, porosity: 31% and water saturation: 28%). The resulting cut-off values for well 210 (Vclay: 42.6%, porosity: 17% and water saturation: 98%); well 220 (Vclay: 26.6%, porosity: 22.4% and water saturation: 50.3%); well 222 (Vclay: 18%, porosity: 17% and water saturation: 70.4%).
Introduction
The characterization of a petroleum reservoir can be described as a process that includes an integrated analysis and understanding of all available data from the well [1, 2, 3, 4, 5]. The integration of seismic interpretation with evaluation of petrophysical properties provides a comprehensive approach to reservoir characterization. Reservoir quality is important in reservoir characterization where the main controllers for reservoir quality are porosity, permeability and clay content [6]. According to Selley [7] that when hydrocarbon reserves are found in a basin, the main thing that is needed is to understand in detail about the quality of the reservoir. Makeen, et al. [8] explained the inhibiting factors for reservoir quality (porosity and permeability), including grain size, clay content (Smectite, Illite, Kaolinite, Chlorite), compaction, cementation, and depositional facies. Osman, et al. [9] explained that the integration of core and logging response data is often used to draw conclusions about lithology, depositional sequence, facies, and fluid content. It is based on a petrophysical model that exploits the correlation between tool response and rock and fluid properties.
Petrophysics of Reservoir Rocks
Volume Shale/Clay
In the Vshale calculation, there are many equations, some form a linear response, some are nonlinear (Steiber, Larionov equation, and others) depending on the condition of the rock. Calculation of Vshale using linear equations can be the first choice, but if this equation is not appropriate with the existing rock conditions, nonlinear equations can be used [10].
/ GR GRmin Vsh cl GRmax GRmin − = − (1)
Vsh = amount of clay/shale content; GR = Radioactivity read on the log; Grmin = Radioactivity read on clean formation; Grmax = Radioactivity as read on shale or clay.
Porosity
The determination of porosity can use the density log, namely the porosity equation from the curve reading with the density log:
ma b ma ma f ρ ρ ρ ρ ρ − = − (2)
Apart from that, it can also be determined using the density log, and calculations are often carried out in combination with the neutron log, whose equation is:
2 D N ND ∅ + ∅ ∅ = (3)
𝜙D = porosity of the density log, fraction; ρb = bulk density, gr/cc; ρf = fluid density, gr/cc; ρma = matrix density, gr/cc; ρf = 1.0 for fresh mud; ρ𝑐𝑙𝑎𝑦 = density of clay, gr/cc
Water Saturation
According to Dwiyono and Winardi [11], the method for calculating water saturation:
| 0,4 Rw | 5∅e2 Rw. Rt | 5∅e2 |
|---|---|---|
| ∅e2 |
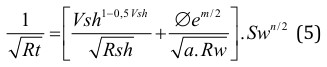
| Rsh |
|---|
Cut-off is the lower limit value of the reservoir parameter to distinguish productive and unproductive parts of a reservoir [12]. The cut-off value is influenced by reservoir characteristics, flow viscosity, temperature and pressure, interval thickness, existing economic factors and so on [13, 14]. Cut-off limits parameter values including Vclay, porosity, water saturation [1, 2, 3, 4, 5]. The determination of cut-off porosity and Vclay is usually done by graphing the relationship between porosity and Vclay, where the values of porosity and Vclay are taken from the results of petrophysical interpretation which have been averaged according to the perforation intervals and statistically, cut-off porosity (for oil 10 % - 16%; gas 6% - 12%), Vclay (20% - 50%) and Sw (55% - 70%) (BPMigas) [15].
Application of Petrophysical Calculations and Determination of Cut-Off
Petrophysical and cut-off calculations in the Betung Field are applied to determine the quality and productive zone of the Air Benakat Formation reservoir. The direction of adding fields (infill wells) are based on the quality of the reservoir and productive zone obtained based on the results of petrophysical and cut-off calculations [16].
Field Data Description
Location
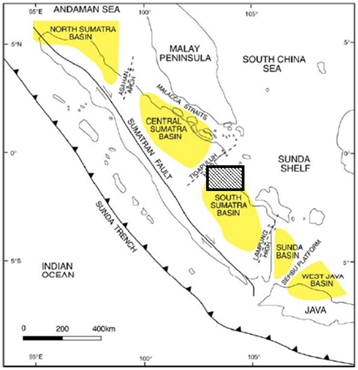
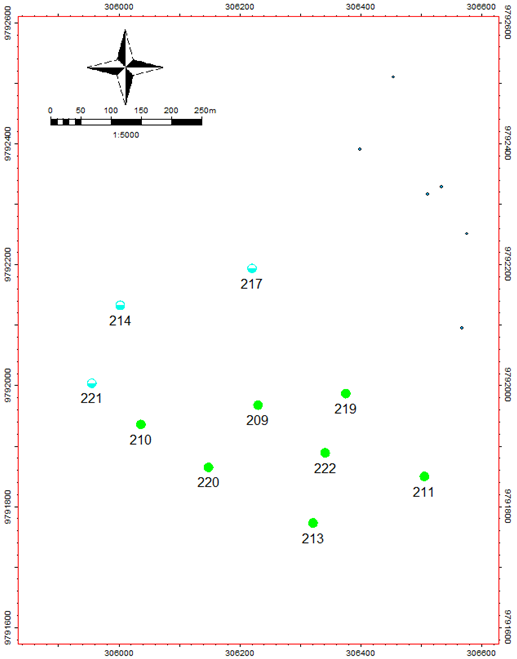
The Betung Field is located in the Jambi Sub-Basin, South Sumatra Basin (Figure 1) with the sandstone of the Air Benakat Formation as its reservoir rock. The Betung field consists of 4 reservoir layers namely L-2, L-3, L-4 and L-5 where the focus of this research is L-5. The wells used in this study were wells 210, 220 and 222 of the 10 existing wells, with the position of each well as shown in Figure 2 [17, 18].
$$ = 2 \times 1 0 ^ {- 4} \mathrm {m} ^ {2} $$
Research Locations in the South Sumatra Basin.
Tools and Materials
The main data used in this study are well logs, namely gamma ray logs, neutron logs, density logs, logs, resistivity logs and literature as well as well reports as supporting data. Data processing was carried out using Interactive Petrophysi Software and Microsoft Excel.
Result and Analysis
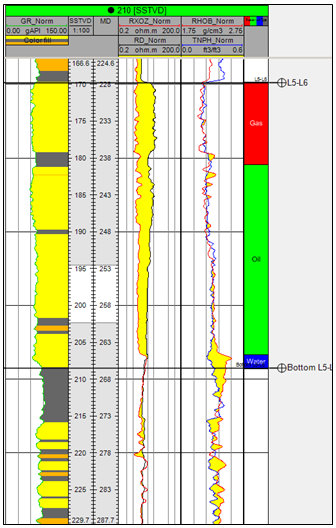
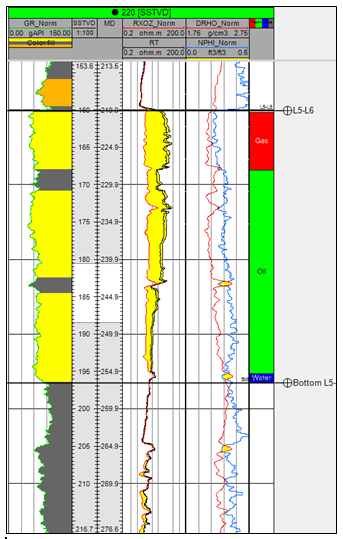
The lithology of the Air Benakat Formation layer 5 (L-5) of the Betung Field is generally dominated by sandstones. This lithology is seen based on the Gamma Ray log which shows a curve with a relatively low value and the log formation is blocky. Based on this, the log curve leading to the minimum value indicates that the zone is a reservoir layer [16].
Petrophysical Analysis of Wells L-5
Calculation of clay content (Vclay) was carried out using gamma ray logs, where based on processing log data using equation (1), the results obtained for clay content were: well 210 (Vclay: 32%); Well 220 (Vclay: 35.5%); well 222 (Vclay: 8.2%) (Table 1) Porosity calculations use effective porosity for reservoir determination. Porosity calculations are performed to determine the porosity of rock formations using the density- neutron porosity model. Using equations (2) and (3), the porosity results for the L-5 wells are as follows: well 210 (porosity: 25.6%); well 220 (porosity: 30.2%); well 222 (porosity: 31%) (Table 1).
Calculation of water saturation uses the Simandoux equation where the study area is shaly sand which shows that the formation does not only contain sand but also contains shale/clay in the sand content. The lithology of the Air Benakat formation is dominated by shaly sand because the Vsh content exceeds 20%. The results of water saturation calculations use the resistivity log and equation (4). The results of the Water Saturation calculation are as follows: well 210 (Sw: 65%); well 220 (Sw: 38%); well 222 (Sw: 28%) (Table 1).
| Well | Top (mMD) | Bottom (mMD) | Gross Reservoir (m) | Vclay (fraction) | Porosity (fraction) | Water Saturation (fraction) |
|---|---|---|---|---|---|---|
| 210 | 228 | 265,50 | 37,50 | 0,3238 | 0,2564 | 0,6573 |
| 220 | 219,76 | 256,64 | 36,88 | 0,355 | 0,3023 | 0,3812 |
| 222 | 239,57 | 273,10 | 33,53 | 0,082 | 0,3103 | 0,2813 |
Table 3: Petrophysics of Wells L-5.
Determination of Cut-Off
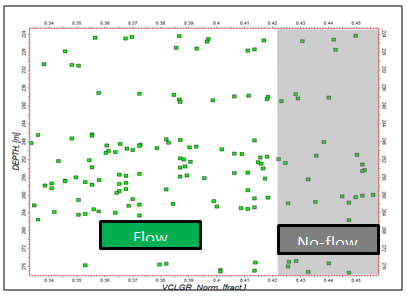
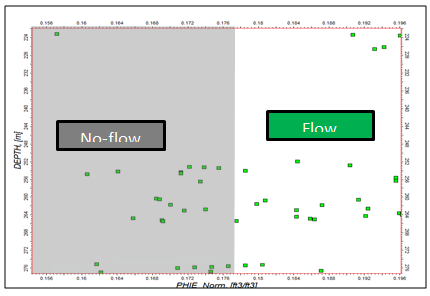
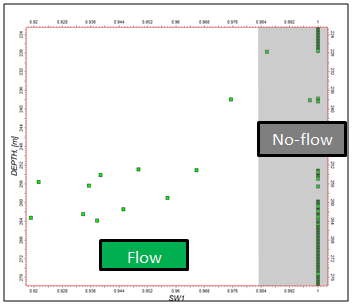
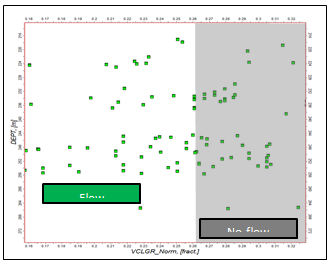
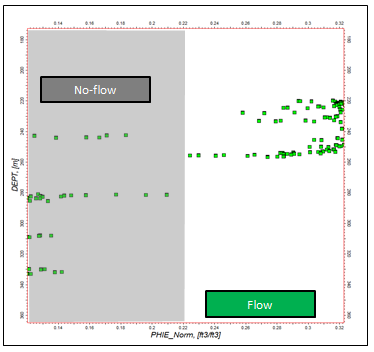
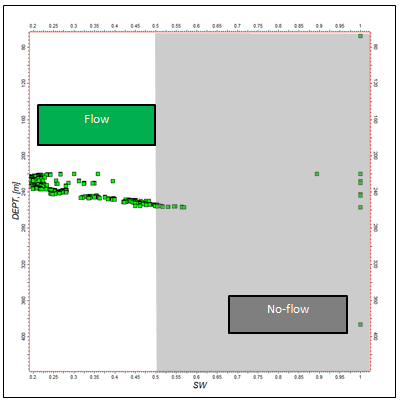
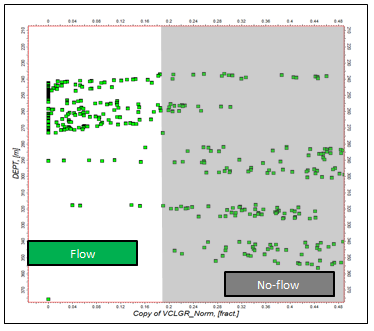
The cut-off value for clay content (Vclay) is determined by the distribution of water saturation values expressed in the form of a crossplot between the water saturation value and the Porosity value. The limit of the cut-off value is determined based on the crossing line which will later be determined by the maximum water saturation value with the minimum porosity value of the L-5 wells. The cut-off results of the L-5 wells can be seen in Table 2 and Figures 3-14. Well 210 shows a flow zone where Vclay is less than 42%, porosity is more than 17% and water saturation is less than 65%. Well 220 shows a flow zone where Vclay is less than 26%, porosity is more than 22% and water saturation is less than 59%. Well 222 shows a flow zone where Vclay is less than 18%, porosity is more than 17% and water saturation is less than 70% [17, 18].
| Well | Cut-off | ||
|---|---|---|---|
| Vclay (fraction) | Porosity (fraction) | Water Saturation (fraction) | |
| 210 | 0,426 | 0,177 | 0,987 |
| 220 | 0,266 | 0,224 | 0,503 |
| 222 | 0,189 | 0,178 | 0,704 |
Table 4: Cut-off of L-5 Wells.
Conclusion
Based on the results and analysis of petrophysical calculations and determination of the cut-off for the Betung field, Jambi Sub-Basin, South Sumatra Basin, it is concluded:
- Layer 5 (L-5) wells are a Hydrocarbon prospect zone at a depth of 228 mMD – 265.50 mMD (well 210); 219.76 mMD - 256.64 mMD (well 220) and 239.57 mMD - 273.10 mMD (well 222).
- Average petrophysical yield for well 210 (Vclay: 32%, porosity: 25% and water saturation: 65%); well 220 (Vclay: 35%, porosity: 30% and water saturation: 38%); well 222 (Vclay: 8.2%, porosity: 31% and water saturation: 28%)
- Cut-off values generated for well 210 (Vclay: 42.6%, porosity: 17% and water saturation: 98%); well 220 (Vclay: 26.6%, porosity: 22.4% and water saturation:
50.3%); well 222 (Vclay: 18%, porosity: 17% and water saturation: 70.4%)
Acknowledgements
The author would like to thank TAC Prakarsa Betung Meruo Senami Jambi for providing the opportunity to process data at the company and giving permission to publish the results of this research.
References
-
Lombard D, Akinlua A (2009) Reservoir characterization of wells KD1, KE1, KF1. KH1, in block 3, Orange Basin, offshore South Africa. SAGA Biennial Technical Meeting and Exhibition, Swaziland, pp: 574.
-
Mahbaz S, Sardar H, Namjouyan M, Mirzaahmadian Y (2011) Optimization of reservoir cut-off parameters: a case study in SW Iran. Petrol Geosci 17(4): 355-363.
-
Strack KM (2002) Reservoir Characterization with Borehole Geophysics. KMS Technologies, KJT Enterprises Inc, Houston, USA, pp: 106.
-
Rider MH (1996) The Geological Interpretation of Well Logs. 2nd (Edn.), Gulf Pub Co, Houston, USA, pp: 280.
-
Rider M (2000) The geological interpretation of well log 2nd (Edn.), Whittles publishing, Scotland, pp: 280.
-
Barber AJ, Crow MJD (2005) Structure and Structural History. In: Barber AJ, et al. (Eds), Sumatra: Geology, Reseouces and tectonic Evolution. Geological Society, London, UK, pp: 175-233.
-
Sharawy MS, Nabawy BS (2019) Integration of Electrofacies and Hydraulic Flow Units to Delineate Reservoir Quality in Uncored Reservoirs: A Case Study, Nubia Sandstone Reservoir, Gulf of Suez, Egypt. Natural Resources Research 28: 1587-1608.
-
Selley RC (1998) Elements of petroleum geology. 3rd (Edn.), Gulf Professional Publishing, pp: 280.
-
Makeen YM, Shan X, Lawal M, Mumini NA, Liang YY, et al. (2021) Scientific Reports, 18442.
-
Osman W, Kassab MA, Elgibaly A, Samir H (2021) Petrophysical evaluation of sandstone gas reservoir using integrated well logs and core data for the Lower Cretaceous Kharita formation, Western Desert, Egypt. Journal of Petroleum Exploration and Production Technology 11: 3723-3746.
-
Asquith G, Krygowski D (1982) Basic Well Log Analysis for Geologists 2nd (Edn.), AAPG Methods in Exploration Series, Tulsa, USA, pp: 244.
-
Dwiyono IF, Winardi DS (2014) Kompilasi Metode Water Saturatin Dalam Evluasi Formasi. Teknik Geologi, Universitas Gadjah Mada 30: 420-437.
-
Worthington PF (2010) Net Pay-What is it? What does it do? How do we quantify it? How do we use it. SPE Reservoir Eval Eng 13(5): 812-822.
-
Worthington PF, Majid AA (2014) The Use of Net-Pay Concepts in the exploitation of shale-gas deposits. J Pet Sci Eng 120: 78-85.
-
Yu LX, Wang X (2000) Study of economic limit about water-cut and initial production oil. Drill Prod Technol 22(6): 39-41.
-
Suzanne GC, Robert MC (2004) Petrophysics of the Lance sandstone reservoirs in the Jonah Field, Sublette Country, Wyoming. AAPG Studies in Geology, USA, pp: 226-227.
-
Coster DGL (1974) The geology of the central and South Sumatra basins. Third Annual Convention 3: 77-110.
-
Ginger D, Fielding DK (2005) The Petroleum and Future Potential of The South Sumatra Basin. Indonesia Petroleum Association.
- Nigeria’s Vulnerability in the Face of Global Energy Policy
- A Simulation Study of Investigation of Optimum Oil Production Performance by Applying Various Gas Injection Methods in Oil Reservoir
- Characterization of Permo-Triassic Reservoirs through Thermal Maturity Assessment of Westphalian Source Rocks in the Cheshire Basin
- Influence of Microwax on the Rheological and Thermal Behaviour of a Wax Crude Oil
- Real-Time Monitoring and Performance Optimization of Steam Injection in Heavy Oil Reservoirs Using Fiber Optic Sensing and Integrated Predictive Simulation Models
- Rapid On-Site Determination of the Total Petroleum Hydrocarbon Content of Soils by Handheld Fourier Transform Near-Infrared Spectroscopy: Development of a Global, Site- and Scanner- Independent Calibration Model