Enhancement of Oil Recovery in West Qurna-1 Carbonate Reservoir by Injecting Seawater
Seawater injection is a novel emerging technology for enhancing oil recovery in Middle East carbonate reservoirs. This paper investigated the mechanism of seawater injection in Mishrif formation for the West Qurna-1 oil field. The decline in the pressure of West Qurna-1 needs pressure support by water injection, where it is a supergiant oil field. This study is significant because seawater injection technology is considered a future technology in the south of Iraq for several reasons. One of these reasons is the scarcity of fresh water in the Middle East, especially in Iraq, and the second reason is the availability of seawater, which is close to Basra city. This paper aims to study the essential parameters that influence the oil recovery via sweater injection as well as the inherent mechanisms that help increase the oil recovery. Collected five core plugs from producing units of Mishrif formation, MB1, and MB2, having different petrophysics properties where the permeabilities ranged from 6 to 143 md. Two types of water are used formation water and seawater. We conduct core flood experiments on chosen carbonate core samples and formation water from Iraq's West Quran-1 carbonates. The common belief facts that low salinity flooding of oil recovery gives more producing oil for the same volume of water injected due to wettability alteration. The analysis of injected and producing water indicates that higher concentrations of SO4-2 and Ca-2 ions change the wettability of the rock to more water-wet. Consequently, the oil recovery increases by 10-15 % when using seawater, which is richer in these ions.
Introduction
WQ1 carbonate reservoir in the south of Iraq is highly heterogeneous and has a complex pore system. It has characteristics of a thick (more than 100 m) carbonate reservoir with low to high porosity (6-25%), low to medium permeability (0.6-150 mD), and mixed to oil-wet wettability conditions. These properties, particularly heterogeneity and wettability, significantly influence water floods recovery efficiency [1, 2, 3, 4].
Low salinity water injection is one of the emerging enhanced oil recovery (EOR) techniques for wettability alteration in carbonate reservoirs. The popularity of this technique is due to its efficiency in displacing light to medium gravity crude oils, ease of injection into oil-bearing formations, water availability and affordability, and lower capital and operating costs, all of which lead to favorable economics compared to other chemical and thermal EOR methods. The only concern with this technique is water sourcing and water disposal. This low salinity water injection EOR technique is known in the literature as LoSal, Smart Watefflood, and Advanced Ion Management. Several studies have been done on LoSal water injection at a laboratory scale and, to a limited extent, at a field scale.
Waterflooding is the most frequent method of secondary oil recovery. Because it is economical and effective to increase pressure and thereby stimulate oil production. On the other hand, water flooding rarely enhances oil recovery in oil-wet carbonate reservoirs with considerable heterogeneity [5]. Carbonate reservoirs have a global average oil recovery of less than 30%, significantly lower than sandstone reservoirs [6].
Four water sources improve oil recovery: produced water, aquifer water, freshwater, and seawater. As a deeply buried and newly developing carbonate reservoir in the Middle East, Mishrif formation water is of high salinity (170-200 ppm). Neither produced water nor aquifer water is plentifully supplied in Mishrif formations. The freshwater has been a scarce resource in the Iraq since early civilizations. For the reasons given above, seawater is a feasible source option for recovering oil, and therefore the seawater flooding study is highly necessary.
Seawater flooding has been an effective IOR method in Bay Marchand sandstone reservoir since the 1960s [7]. However, seawater injection has some technical problems in carbonate reservoirs, such as compatibility between formation water and injection water [8] and formation damage [9, 10, 11], etc.
Gulf seawater salinity is relatively lower than formation water in Iraq. Seawater flooding in carbonate can be considered a low salinity water injection (LSWI) problem. LSWI is a novel emerging method for enhancing oil recovery that has recently been researched. OWI can increase oil recovery in sandstone and carbonate in different ways. For sandstone, LWSI can lower its interfacial tension and increase its ability to sustain flow paths for oil recovery in terms of its LWS-clays reaction [12, 13, 14, 15]. For carbonate, LSWI may alter the wettability of the rock surface and enhance oil recovery in several aspects as follow: • Changing the injected water’s salinity and ionic content [16, 17].
• Ion exchange between injection water and foundation fluid [18, 19, 20].
• Fine panicles mobilization [21, 13, 22].
• Injection water/oil interactions [23].
Although many studies in the literature have been done to understand the mechanisms of LSWI, the discussion of such a significant study still needs to be further studied [24]. Among these studies, little research focused on the mechanism of seawater flooding in carbonates.
This paper aims to discover the essential parameters influencing carbonate’s oil recovery via seawater injection. The simplified analytical model for a carbonate reservoir with vertical heterogeneity was briefly described. We explained the theory of the influence of water salinity on seawater displacement efficiency. We focused on the relationship between oil recovery and brine salinity/ion composition. A method to screen reasonable seawater components in the seawater injection project was also suggested and presented.
Formation water considers a limited resource in the West Qurna-1 oil field; therefore, we need another resource to support the decline in the pressure.
The following experimental work tested seawater injection in the field and compared it with formation water injection. The experimental work of injection of seawater considers the first time in the field. The location of Basra city near the Arabian Gulf makes the injection of seawater more successful. The high salinity problems in the injection of formation water consider seawater injection a good process.
The first attempt to simulate seawater injection with real core plugs was taken from the Mishrif formation, and seawater was taken from the source in this research.
Location of the Study Area
West Qurna is a supergiant oil field in the southeast of Iraq, around 70 kilometers north-west of Basra. The field is considered one of the giant reservoirs of the world oil field, as indicated it is coordinated in Figure 1.
![Figure 1: Location map of West Qurna-1 Oilfield Southern of Iraq [25].](/fulltextimages/10458/fig_1.png)
Geology of the Study Area
A heterogeneous carbonate reservoir has formed in the West Qurna-1 oil field, known as Mishrif.
An important reservoir not just in the West Qurna-1 area but also across southern Iraq is the Mishrif formation. Above and below, as seen in Figure 2, the Khasib Formation and Rumaila Formation separate this formation [26].
The anticlinal fold with moderate dips is what makes up the Mishrif formation. At well (WQ-110), the Mishrif formation is located at a depth of (2207m) and a width of about 16.5 kilometers from the center of the region with a thickness of 202m.
![Figure 2: Stratigraphic column for the southern region of Iraq [28].](/fulltextimages/10458/fig_2.png)
West Qurna oil field includes the Mishrif Formation units Caprock I, Upper Mishrif and Cap Rock II, and Lower Mishrif [27].
Experimental Phase: Materials
Core Samples
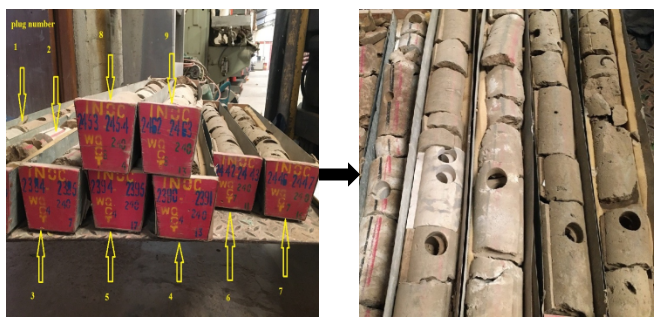
Five core samples were employed for the experiments as shown in Figure 3 from Mishrif formation. XRD (X-Ray Diffraction) analysis showed that samples were dominantly made of calcite, which formed more than 97% of the mineralogy of the rock. The permeability of the cores between (6.02-143 mD) and the porosities was in the range of 15 to 25%. Core petrophysical properties are shown in Table 1.
The diameter of each core sample is 1.5 inches (3.81cm), and the length ranges between (7-7.3cm).
| Sample | Porosity,% | Permeability, MD | Pore volume, cc |
|---|---|---|---|
| 1 | 19.996 | 7.597 | 16.08 |
| 2 | 17.47 | 143.7 | 13.95 |
| 3 | 20.755 | 8.583 | 16.77 |
| 4 | 20.064 | 6.02 | 15.96 |
| 5 | 21.14 | 6.375 | 16.82 |
Table 1: Core petrophysical properties before the formation of water injection.
XRD tested before injection for limestone core sample as shown in Figure 4 for the plug 4 From the XRD test, we notice that the mineral composition for limestone plug 10 is CaCO3 (calcite) with a percentage of 97% and SiO2 (Quartz) with 3%.
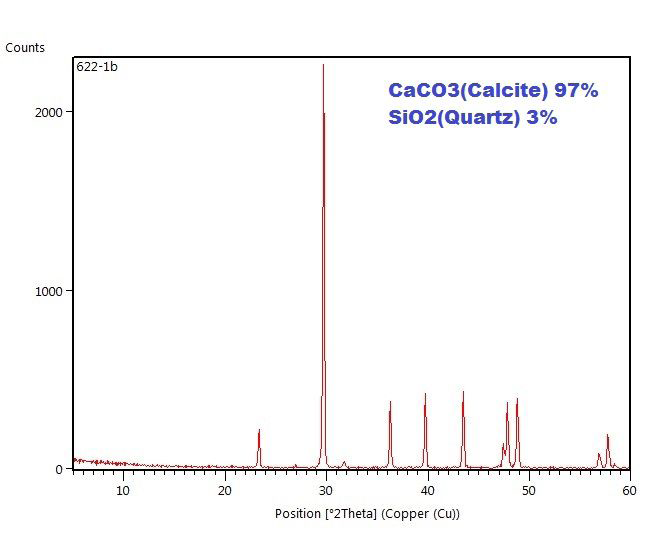
According to the maximum intensities of XRD reflections, the diffracted planes that yield these maximum intensities contain the most atoms and electrons per unit cell in the materials under study.
Brine Solution
Dammam formation water is used as a brine solution to saturate the core plugs that are used to calculate pore volumes and porosity. Dammam formation water makes the chemical compatible between formation water and injection water.
Injection Water
The injection water was provided from formation water and seawater where the salinities of these waters as in Table 2 and Table 3 the compositions of the injected water.
| Type of Water | Salinity (ppm) |
|---|---|
| Dammam Formation Water | 180,728 |
| Sea water | 41160 |
Table 3: The salinities of injection water.
| Water Injected | HSW | SW |
|---|---|---|
| component | ppm | ppm |
| Cl- | 96205 | 22788 |
| So4-2 | 650 | 3260 |
| Na+ | 50089 | 12320 |
| Ca+2 | 12390 | 530 |
| Mg+2 | 3736 | 1690 |
| TDS | 180728 | 41160 |
| pH | 6.85 | 7.9 |
Table 4: Ion chromatography analysis for two brines.
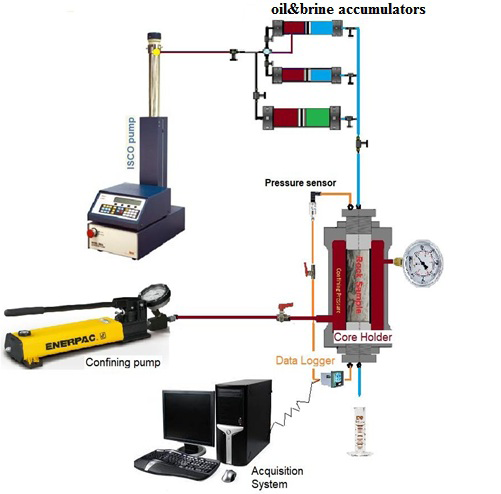
A confining pressure of 1000 psi was exerted around the core holder to prevent fluids from eventual evaporation. Then the cores were initially flooded by fresh reservoir brine at different rates to saturate all of the accessible pores with fresh water.
Crude Oil
Dead oil for Mishrif formation was used in the experimental work. The oil mixed with gas oil with percent 20% for dead oil and 80% for gas oil. The oil sample was centrifuged at 5000rpm, then filtered until no precipitation of any asphaltenes was observed during storage to avoid any solids plugging or emulsion problems.
The reason behind mixing dead oil with gas oil because of the dead oil has a high viscosity, which reaches 10 cp, and this high viscosity value makes the injection process difficult and does not give good results.
Viscosity Measurement
The viscosity and density at 23°C are measured by a stabinger viscometer in the petroleum-engineering department, as shown in Figure 4 and Table 4.
| API | 23 |
|---|---|
| Density,g/cc | 0.8 |
| Viscosity, cp | 4.5 |
Table 2: The properties of crude oil.
Cleaning the Core, Preparing the Fluid, and Measuring Porosity and Permeability
The following steps were used to clean the cores prior to core flooding:
- The Soxhlet extractor was used to extract the cores, employing toluene as the solvent. This was important to remove any hydrocarbons and salts contained in the cores. To ensure that all salts were removed from the core plugs, the cores were flushed with methanol. The cleaning procedure was carried out until no traces of oil were visible. The cleaning process with toluene took about 16 hours on average.
- The cores were dried for 8 to 10 hours at 100 degrees Celsius. To eliminate humidity, the cores were sealed shortly after drying.
- The core plugs saturated by using vacuum pump and calculate the porosity by weight difference between saturated and dry.
- Formation water is injected into the cores to calculate liquid permeability.
The process of core flooding includes the following steps:
- After calculating the liquid permeability, the oil flooded at a rate of 0.5 cc/min to calculate the initial water saturation (Swi) and the effective oil permeability (Ko).
- High salinity water is injected into core samples to calculate the oil recovery factor and pressure drop.
- Repeat steps 1 to 4 in the core cleaning and preparing the cores to clean and saturate the core plugs for the next experiment.
- Seawater injected into core samples
- Record oil recovery factor and pressure drop after each water injection.
The following figure explains the core-flood system used for enhanced oil recovery by using high and low salinity water flooding, located in the petroleum department’s core lab, as shown in Figure 5.
Results and Discussion
The main objective of this core flood study was to determine the effect of high salinity (HSW) and low salinity injection (LSW) on the ultimate oil recovery as secondary modes. The results and discussion were organized as follows: core flooding experiments, pressure drop across the core, and analysis of core-effluent samples.
Coreflood Experiments
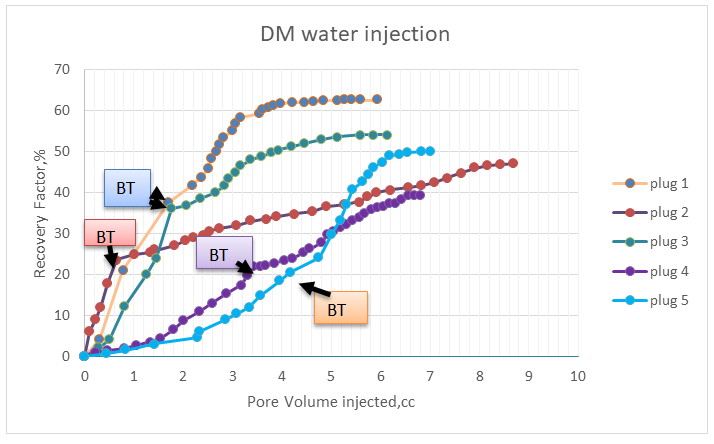
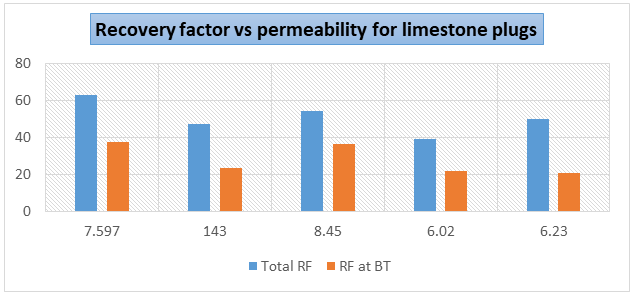
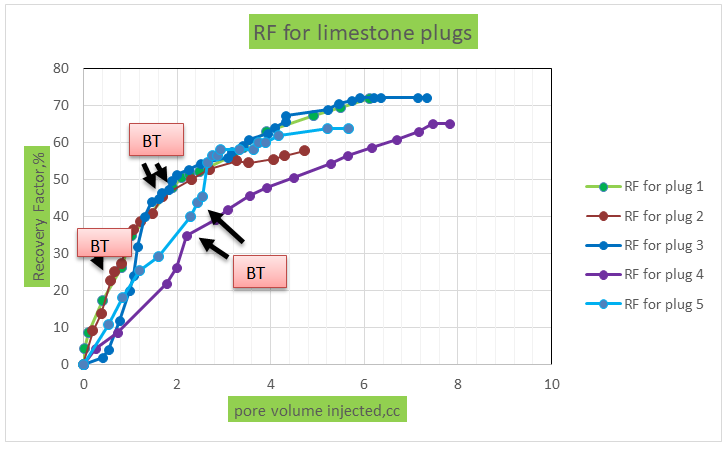
Formation water is injected into carbonate core plugs with a flow rate of 0.5cm3/min. The oil recovery factor results as shown in table 5. the oil recovery factor for plug one is 62.5% from original oil in core (IOIC) which is considered the higher oil recovery factor than the other plugs due to the more wettability. The RF is 47.05% for plug two because this core is oil-wet, as concluded from a special core analysis shown in Fig. Appendix, despite the high absolute permeability of 143.7 md. For plug three, the RF is 54% despite the lower absolute permeability than plug one, which is 8.583 md due to the lower wettability. For the plugs four and five, the recovery factor was 39.3 and 50%, respectively, despite the small difference in the absolute permeability shown in Table 1. From Figure 5, we notice that the recovery factor at breakthrough for the plug was 37.5% after injection 1.8 PV. The recovery increased rapidly and reached 58% after injection of 3.75 PV; after that, the recovery became slightly constant, reaching 62.5% after injection of six pore volumes. The production of core plugs four and five was delayed after injection of one pore volume due to the small absolute permeability value.
For plug 3, the recovery factor reached 50% after injection 4.28 Pv, while for plug 3, the recovery factor is low because of its oil-wet.
For plug 4, the recovery factor was 21% after the water volume was injected at 3.375 Pv, while for plug 5, the recovery factor reached 20% after injection of 4.16 Pv.
From the above discussion of recovery factors, we conclude that plug 1 is best than other plugs. From Figure 6, we notice that the total recovery factor and recovery factor at breakthrough for high salinity water injection does not depend on the absolute permeability. The total recovery factor for plug five is more than plug seven despite the absolute permeability being less than plug seven, and the recovery factor at breakthrough is more than plug 3.
| plug no | 1 | 2 | 3 | 4 | 5 |
|---|---|---|---|---|---|
| Ultimate Recovery factor,% | 62.5 | 47.1 | 54 | 39.1 | 50 |
| Recovery factor at breakthrough,% | 37.5 | 23.5 | 36 | 21.7 | 20.4 |
| Oil effective permeability (ko), MD | 4.35 | 51.8 | 3.97 | 4.33 | 2.93 |
| Water effective permeability(kW),MD | 3.36 | 31.7 | 3.57 | 1.96 | 2.81 |
| Oil relative permeability (kro) | 0.58 | 0.36 | 0.47 | 0.68 | 0.47 |
| Water relative permeability (krw) | 0.45 | 0.21 | 0.42 | 0.32 | 0.45 |
| Residual oil saturation (Sor),% | 37.5 | 52.9 | 46 | 60.9 | 50 |
Table 5: Oil recovery factor results for carbonate plugs for formation water injection.
After saturating the plugs with oil, seawater was injected with a constant 0.5 cm3/min flow rate. The oil recovery factors for plugs 1,2,3,4, and 5 were 71.74, 57.72%, 72%,
65.21%, and 63.63%, respectively as shown in Figure 7 and Table 6.
| Plug no | 1 | 2 | 3 | 4 | 5 |
|---|---|---|---|---|---|
| Ultimate Recovery factor,% | 71.7 | 57.73 | 72 | 65.2 | 63.6 |
| Recovery factor at breakthrough,% | 47.8 | 27.27 | 46 | 34.8 | 43.6 |
| Oil effective permeability (ko), MD | 2.31 | 60.446 | 3.97 | 7.09 | 4.44 |
| Water effective permeability(kW),MD | 2.04 | 9.532 | 3.21 | 3.32 | 2 |
| Oil relative permeability (kro) | 0.31 | 0.657 | 0.47 | 0.72 | 0.71 |
| Water relative permeability(krw) | 0.27 | 0.104 | 0.27 | 0.34 | 0.32 |
| Residual oil saturation (Sor),% | 28.3 | 42.273 | 28 | 34.8 | 36.4 |
Table 6: shows the results of injection seawater injection for the plugs.
The lower oil recovery factor for plug six is oil-wet, while the higher oil recovery factor is for plug 3. The oil recovery factor at breakthrough for plugs 1, 3, 2, 4 and 10 was 47.83%, 27.273%, 46%, 34.78% and 43.63% respectively.
The lowest value of connate water saturation and high salinity connate water gives the highest oil recovery as seen for plugs 4 and 5, where connate water saturation (Swi) for plug ten is equal to 10.02%, while for plug 5, the connate water saturation (Swi) equal to 25.25%. The recovery factors for the plugs are 65.2% and 63.63%, respectively. These results agree with Zaeri MR, et al. [29]. For plugs 4 and 5, the recovery factors are continuously produced. The recovery factor at breakthrough is high for plugs 1 and 3.
Effluent Water Analysis
From water analysis after formation water injection in carbonate plugs as shown in Table 8. We noticed that the sodium concentration increased for all plugs.
| Plug no | Dammam Water Before Injection | 1 | 3 | 4 | 5 |
|---|---|---|---|---|---|
| ions | DM | effluent water | effluent water | effluent water | effluent water |
| Na | 50089 | 29790 | 23815 | 36270 | 34700 |
| Ca | 12390 | 14000 | 19500 | 29000 | 25000 |
| Mg | 3736 | 3660 | 3750 | 3450 | 3550 |
| Cl | 96205 | 70000 | 75082.5 | 92300 | 88217.5 |
| So4 | 650.807 | 439.456 | 500.68 | 565.986 | 527.891 |
| pH | 6.75 | 7 | 7.02 | 6.92 | 6.9 |
Table 7: Effluent water analysis after Dammam water injection for carbonate plugs.
From Figure 9, we noticed a slight increase in pH values for plug five after formation water injection, where the pH for the brine before injected 6.75, and the final value 7. Figure 10 for plug 10, pH values increased from 6.77 to 6.92.
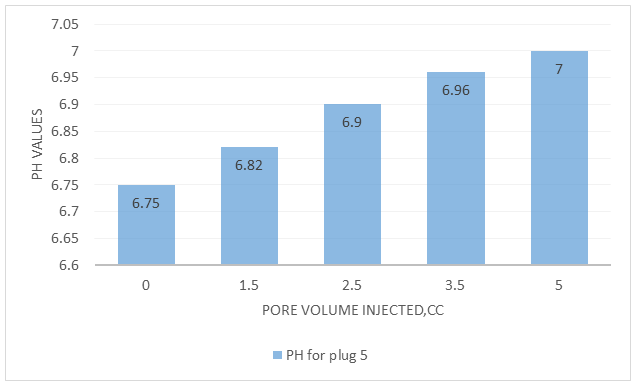
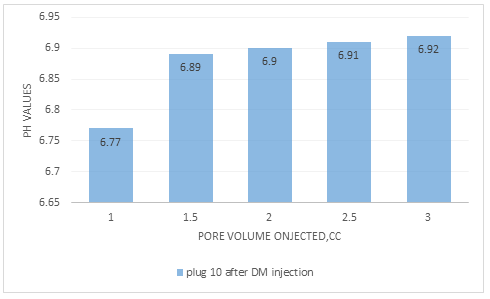
Figure10: pH values for the effluent water after formation water injection in plug four.
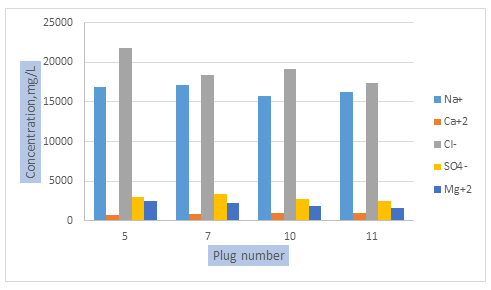
From water analysis, we noticed that slight increase in Na+ concentration from the initial concentration in seawater, where this increase came from connate water salinity, which is equal to (50089 mg/L). This reason why Na+ concentration increases but does not consider potential ions in the reactivity to change the wettability of the rock.
The reactivity of important seawater ions (SO4-2, Ca+2, Mg+2) can change rock surface charges and liberate adsorbed carboxylic oil components from the rock surface, altering rock wettability and ultimately improving oil recovery in limestone rocks.
As seen in water analysis, SO4-2 concentration increased from 2190 mg/L to 2975.48 mg/L in plug five, while for plug seven, the concentration increased to 3387.66 mg/L, as shown in Figure 11. The increase in the concentration of SO4-2 means that sulfate adsorption on the limestone surface increases and lowers the positive surface charge and promotes electrostatic attraction.
The higher increase in SO4-2 concentration indicates an increased reactivity with carbonate surface rock. Ion reactivity plays an essential role in the recovery potential, agreeing with Yousef AA, et al. [17].
McGuire PL, et al. [30] hypothesized that better oil recovery could be linked to a form of the alkaline flood because pH rises in a low salinity flood. Furthermore, the increase in pH is, in many cases, not more than one pH unit, which causes the water to become only slightly basic, where pH values for plug 1 increased from 7.9 to 8.8, where the increase in pH 1.1 unit while for plug 5, pH value increased to 8.37 unit. As shown in Figure 12 and Table 9.
For plug 3, the increase in pH values reached 8.94 units; this reason why the ultimate recovery factor for this plug is more than the other plugs.
Lager A, et al. [20] point out that a little increase in pH is unlikely to reduce interfacial tension (IFT) enough to facilitate low salinity effects. It may, however, influence carboxylic material adsorption/desorption on the clay.
| Plug no | 1 | 3 | 4 | 5 | |
|---|---|---|---|---|---|
| ions | Seawater | effluent water | effluent water | effluent water | effluent water |
| Na | 12320 | 16947.5 | 17122.5 | 15792 | 16284.3 |
| Ca | 530 | 700 | 875 | 1000 | 950 |
| Mg | 1690 | 2552 | 2234 | 1840 | 1670 |
| Cl | 17750 | 21743.75 | 18371.25 | 19173.55 | 17380.8 |
| SO4-2 | 2190.48 | 2975.48 | 3387.66 | 2786.08 | 2567.75 |
| PH | 7.9 | 8.8 | 8.94 | 8.41 | 8.37 |
Table 8: ion composition for carbonate plugs after seawater injection.
Because of the reaction with OH, the pH of carbonate rocks increased. Calcite (CaCO3) combines with water, forming Ca+2 with OH-, which is why pH rises, and we produce more cations, particularly Ca+2, in the effluent since calcium hydroxide is liquid. Because of the active and non-active ions present in the injected SW, the effluent pH of seawater was higher than the effluent of FW. The rate of kinetic dissolution may be increasing in seawater.
The Pressure Drop Discussion
The pressure drop after the formation water injection, as shown in Figure 12. For plug 5, we noticed that the pressure drop increased to 30 psi and stabilized at 25 psi, while for plug three, the pressure drops less than plug five because of the higher absolute permeability.
Figure 12 shows that the pressure drop for plug four continuously increased, which means damage happened to the plug. For plug 2, the pressure drops less than five psi because of the high permeability.
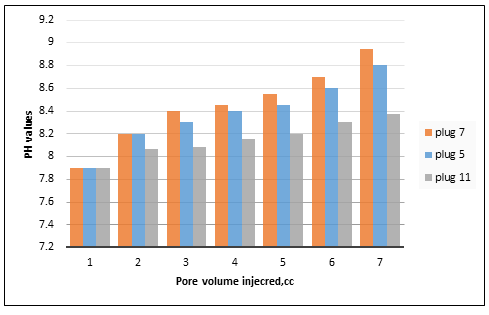
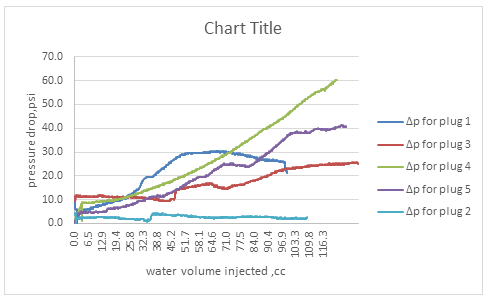
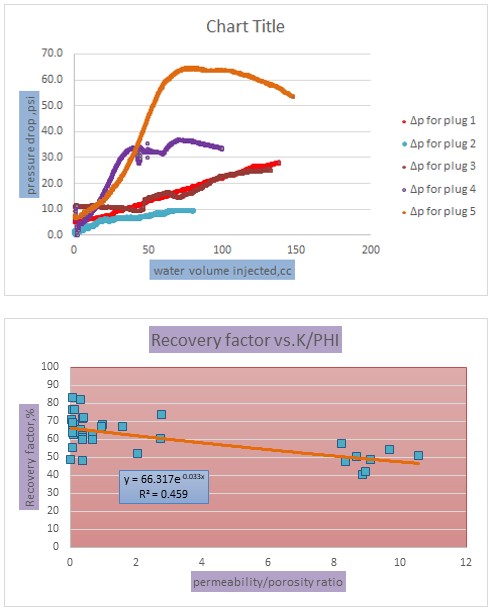
Figure 13 shows the pressure drop measurements throughout the core plugs with the pore volumes receiving an injection from seawater. For seawater, the pressure drop increased for all the plugs compared to formation water injection. This indicates that fines migration has occurred due to dissolution, as shown by the increasing pH in water analysis. Furthermore, the pressure drop difference between high and low salinity was almost double. Therefore, relative permeability to water becomes half, which should get better oil recovery. Eventually, despite the increased pressure, we can interpret it as emanating from fines migration and dissolution. The drop decrease in high salinity by dissolution can be compensated by increased pressure drop by fines migration at low salinity.
From Figure 13, we notice that for plug five, the pressure dropped more than the other plugs for several reasons, neither because of the damage by the participation of Cl- ion, and Na+ or because of the low permeability. The pressure drop increased continuously for plugs 1, 2, and 3.
The above figure shows that the pressure drop is not stabilized. Continuous increased because of fine migration, where the pressure drop for plug 11 is higher than the other plugs, reached to value 65 psi, and after that decreased after the injection 140 cc or 8 PV injected while for plug six reached ten psi.
The reduction in the pressure drop during increased sulfate ion concentration for plugs 1 and 3 indicates a wettability alteration toward the water-wet surface. This result agrees with Austad T, et al. [31] and Abbas LK, et al. [32].
The injection pressure for plugs 4 and 5 jumped to 64.2 and 36.4 psi, respectively. The pressure declined dramatically and stabilized at 53.3 for plug 4 and 33.4 psi for plug 5.
The Comparison between the Previous and Recent Experimental Results
The results from experiments core flooding were collected together to see the relationship between different parameters such as porosity, permeability, salinity versus recovery factor.
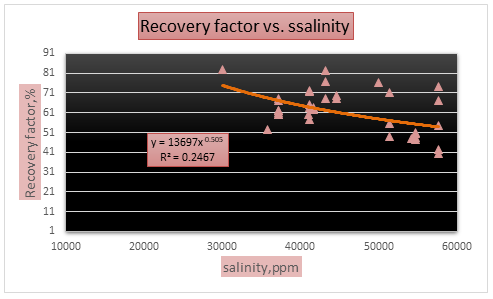
| Researcher Name | Year | Salinity | Porosity | Permeability | RF | K/Phie | |
|---|---|---|---|---|---|---|---|
| 1 | Adedapo Awolayo, et al. | 2014 | 43228 | 24.66 | 7.31 | 82.4 | 0.296432 |
| 43228 | 19.95 | 1.21 | 76.8 | 0.060652 | |||
| 43228 | 30.17 | 4.06 | 68 | 0.134571 | |||
| 2 | Ali A Yousef, et al. [17] | 2011 | 57600 | 25.1 | 39.6 | 67 | 1.577689 |
| 57600 | 24.65 | 68.3 | 74.1 | 2.770791 | |||
| 3 | Samira Mohammadkhani | 2018 | 30000 | 17.04 | 0.99 | 83.1 | 0.058099 |
| 50000 | 19.78 | 2.76 | 76.6 | 0.139535 | |||
| 4 | Hazim H Al-Attar | 2012 | 40980 | 8.7 | 23.7 | 60.2 | 2.724138 |
| 5 | S Amir Farzaneh | 2017 | 35720 | 30.84 | 62.6 | 52.3 | 2.029831 |
| 6 | Arman Darvish | 2018 | 41600 | 20 | 1.7 | 62.6 | 0.085 |
| 41600 | 19.8 | 1.2 | 63.9 | 0.060606 | |||
| 7 | Shehata AM | 2016 | 54680 | 19.4 | 168.1 | 50.5 | 8.664949 |
| 54680 | 21.2 | 176.6 | 47.6 | 8.330189 | |||
| 54680 | 19 | 200.6 | 50.8 | 10.5579 | |||
| 54680 | 18.7 | 169.9 | 48.7 | 9.085562 | |||
| 8 | Ahmed Radhi | 2022 | 41160 | 19.996 | 7.597 | 71.7 | 0.379926 |
| 41160 | 17.47 | 143.7 | 57.7 | 8.22553 | |||
| 41160 | 20.755 | 8.583 | 72 | 0.413539 | |||
| 41160 | 20.064 | 6.02 | 65.2 | 0.30004 | |||
| 41160 | 21.14 | 6.375 | 63.6 | 0.301561 | |||
| 9 | Hasan S Al-Hashlm | 2015 | 57670 | 25.24 | 223.37 | 40.2 | 8.849842 |
| 57670 | 24.4 | 218.32 | 42.2 | 8.947541 | |||
| 57670 | 23.93 | 231.42 | 54.4 | 9.670706 | |||
| 10 | Ali K Alhuraishawy | 2018 | 37174 | 20.43 | 19.82 | 68 | 0.970142 |
| 37174 | 21.66 | 20.2 | 67 | 0.932595 | |||
| 37174 | 13.44 | 5.11 | 62 | 0.380208 | |||
| 37174 | 13.71 | 5.21 | 61 | 0.380015 | |||
| 37174 | 13.84 | 4.94 | 60 | 0.356936 | |||
| 37174 | 20.45 | 13.72 | 62 | 0.670905 | |||
| 37174 | 19.67 | 13.25 | 60 | 0.673615 | |||
| 11 | Erfan Hosseini, et al. | 2020 | 51400 | 13.13 | 0.63 | 71 | 0.047982 |
| 12 | W Alameri | 2015 | 51346 | 21.27 | 0.39 | 48.9 | 0.018336 |
| 51346 | 21.69 | 1.34 | 55.5 | 0.06178 | |||
| 13 | Arman Namaee | 2020 | 54107 | 17 | 6.16 | 48 | 0.362353 |
| 14 | Y A Hadi | 2019 | 44580 | 15.165 | 0.86 | 68.2 | 0.05671 |
| 44580 | 16.172 | 0.86 | 69.5 | 0.053178 |
Conclusions
- This study used core flooding tests to demonstrate the influence of LSWF on carbonate reservoirs. According to SW-based experimental results, injecting low-saline brine as an EOR approach leads to a higher oil recovery factor than injecting high-saline brine.
- During the injection of low-saline brine, an increase in the pressure differential was noted, which was attributed to the fines migration has occurred due to dissolution
- Effluent analysis indicates a high concentration of calcium ion Ca+2, indicating the dissolution of cementation materials between the grains (CaCo3), as seen by the XRD test.
- The ultimate oil recovery factor after high salinity water injection does not depend on the absolute permeability, where the recovery factor for plug 1 is more than plug three despite the low absolute permeability.
- The suggested process proposes that mineral dissolution is the primary mechanism throughout the LSWI, with surface charge change becoming more active when salinity declines to relatively low values, based on careful examination of the effluent ions.
- The reactivity of important seawater ions (SO4-2, Ca+2, Mg+2) can change rock surface charges and liberate adsorbed carboxylic oil components from the rock surface, altering rock wettability and ultimately improving oil recovery in limestone rocks.
- The increase in Mg+2 during low salinity water injection because of dolomite dissolution.
Nomenclature
D core diameter (cm)
L core length (cm)
OOIP original oil in place
PV pore volume
Swi initial water saturation (%)
WQ West Qurna
SI Metric Conversion Factors
bbl × 1.589 873 E–01 = m3 ft × 3.048* E–01 = m
Acknowledgements
The authors thank Basra Oil Company, the oil ministry, for providing core samples and oil and brine solutions. Grateful to the petroleum department use the lab and facilities.
References
-
Masalmeh SK, Wei L, Blom C, Jing X (2014) EOR Options for Heterogeneous Carbonate Reservoirs Currently Under Waterflooding. Abu Dhabi International Petroleum Exhibition and Conference, Abu Dhabi, UAE.
-
Dake LP (2001) The Practice of Reservoir Engineering (Revised Edition). Elsevier Science & Technology, pp: 507.
-
Chierici GL (1994) Principles of Pertroleum Reservoir Engineering. Springer-Verlag, Berlin Heidelberg, Germany, pp: 421.
-
Willhite GP (1986) Waterflooding. SPE Textbook Series, Texas, USA, pp: 326.
-
Austad T, Strand S, Høgnesen EJ, Zhang P (2005) Seawater as IOR Fluid in Fractured Chalk. SPE International Symposium on Oilfield Chemistry, The Woodlands, Texas.
-
Idowu J, Somerville J, Adebari D, Meshioye O (2011) Effect of Salinity Changes of the Injected Water on Water Flooding Performance in Carbonate Reservoirs. Nigeria Annual International Conference and Exhibition, Abuja, Nigeria.
-
McCune CC (1982) Seawater Injection Experience An Overview. J Pet Technol 34(10): 2265-2270.
-
Lindlof JC, Stoffer KG (1983) A Case Study of Seawater Injection Incompatibility. J Pet Technol 35(07): 1256- 1262.
-
Osode PI, Bataweel MA, Alkhaldi MH (2015) Injection Water Compatibility Study and Scale Prediction Analysis for a Low-Permeability Carbonate Reservoir Development Optimization. SPE Kuwait Oil and Gas Show and Conference, Mishref, Kuwait.
-
Al-Mohammed AM, Khaldi MH, Alami I (2012) Seawater Injection into Clastic Formations: Formation Damage Investigation Using Simulation and Coreflood Studies. SPE International Production and Operations Conference & Exhibition, Doha, Qatar.
-
El-Hattab MI (1982) GUPCO’s Experience treating Gulf of Suez Seawater for Waterflooding the El Morgan Oil Field. J Pet Technol 34(7): 1449-1460.
-
Tang GQ, Morrow NR (1997) Salinity, Temperature, Oil Composition, and Oil Recovery by Waterflooding. Society of Petroleum Engineers 12(4): 269-276.
-
Tang GQ, Morrow NR (1999) Influence of brine composition and fines migration on crude oil/brine/ rock interactions and oil recovery. J Pet Sci Eng 24(2-4): 99-111.
-
Kumar M, Fogden A, Morrow NR, Buckley JS (2011) Mechanisms of Improved Oil Recovery from Sandstone by Low Salinity Flooding. Petrophysics 52(6): 428-436.
-
Ahmad A, Bai B, Wu YS (2012) Investigating Low-Salinity Waterflooding Recovery Mechanisms in Sandstone Reservoirs. SPE Improved Oil Recovery Symposium, Tulsa, Oklahoma, USA.
-
Shalabi EW, Sepehrnoori K, Delshad M (2013) Mechanisms Behind Low Salinity Water Flooding in Carbonate Reservoirs. SPE Western Regional & AAPG Pacific Section Meeting 2013 Joint Technical Conference, Monterey, California, USA.
-
Yousef AA, Al-Saleh SH, Al-Kaabi A, Al-Jawfi MS (2011) Laboratory Investigation of the Impact of Injection- Water Salinity and Ionic Content on Oil Recovery from Carbonate Reservoirs. SPE Res Eval & Eng14(5): 578- 593.
-
Omekeh AV, Friis HA, Fjelde L, Evje S (2012) Modeling of Ion-Exchange and Solubility in Low Salinity Water Flooding. SPE Improved Oil Recovery Symposium, Tulsa, Oklahoma, USA.
-
Nasralla RA, Nasr-El-Din HA (2011) Impact of Electrical Surface Charges and Cation Exchange on Oil Recovery by Low Salinity Water. SPE Asia Pacific Oil and Gas Conference and Exhibition, Jakarta, Indonesia.
-
Lager A, Webb KJ, Black CJJ, Singleton M, Sorbie KS, et al. (2008) Low Salinity Oil Recovery - An Experimental Investigational. Petrophysics 49(1).
-
Bedrikovetsky P, Zeinijahromi A, Badalyan A, Ahmetgareev V, Khisamov R, et al. (2015) Fines- Migration-Assisted Low-Salinity Waterflooding: Field Case Analysis. SPE Russian Petroleum Technology Conference, Moscow, Russia.
-
Sarkar A, Sharma M (1990) Fines Migration in Two- Phase Flow. Journal of Petroleum Technology 42(5): 646-652.
-
Sohrabi M, Mahzari P, Far-zaneh SA, Mills JR, Tsolis P, et al. (2015) Novel Insights into Mechanisms of Oil Recovery by Low Salinity Water Injection. SPE J 22(2): 407-416.
-
Morrow N, Buckley J (2011) Improved Oil Recovery by Low-Salinity Waterflooding. J Pet Technol 63(5): 106- 112.
-
Naser SJ, Farman GM (2021) Optimizing Water Injection Performance by Using Sector Modeling of the Mishrif Formation in West Qurna-1 Oil Field, Southern Iraq. Iraqi Geol J 54(2): 59-74.
-
Abdullah RA, Al-Shahwan M (2021) Structural Geometry Analysis of Khasib Formation in West Qurna I and II Supergiant Oilfields, Southern Iraq. Iraqi Geol J 54(1): 54-66.
-
Abdulzahra H, AL-Jawad SN (2011) Determining Flow Units by Using Integrated Petrophysical Properties for Mishrif Formation in West Qurna Field. Petroleum Engineering Department, Iraq.
-
Al-Khadhimi JA, Sissakian VK, Falah AS, Deikran DB (1996) Tectonic map of Iraq (Scale 1: 1000000). SE of Geological Survey and Mining.
-
Zaeri MR, Shahverdi H, Hashemi R, Mohammadi M (2018) Impact of water saturation and cation concentrations on wettability alteration and oil recovery of carbonate rocks using low-salinity water. J Pet Explor Prod Technol 9: 1185-1196.
-
McGuire PL, Chatham JL, Paskvan FK, Sommer DM, Carini FH, et al. (2005) Low salinity oil recovery: an exciting new EOR opportunity for Alaska’s north slope. SPE Western Regional Meeting, Irvine, California.
-
Austad T, Shariatpanahi SF, Strand S, Black CJJ, Webb KJ, et al. (2011) Conditions for a Low-Salinity Enhanced Oil Recovery (EOR) Effect in Carbonate Oil Reservoirs. Energy Fuels 26(l): 569-575.
-
Abbas LK, Mahdi TA (2020) Reservoir Modeling of Mishrif Formation in Majnoon Oil Field, Southern Iraq. Iraqi Geol J 53(1): 89-101.
- Nigeria’s Vulnerability in the Face of Global Energy Policy
- A Simulation Study of Investigation of Optimum Oil Production Performance by Applying Various Gas Injection Methods in Oil Reservoir
- Characterization of Permo-Triassic Reservoirs through Thermal Maturity Assessment of Westphalian Source Rocks in the Cheshire Basin
- Influence of Microwax on the Rheological and Thermal Behaviour of a Wax Crude Oil
- Real-Time Monitoring and Performance Optimization of Steam Injection in Heavy Oil Reservoirs Using Fiber Optic Sensing and Integrated Predictive Simulation Models
- Rapid On-Site Determination of the Total Petroleum Hydrocarbon Content of Soils by Handheld Fourier Transform Near-Infrared Spectroscopy: Development of a Global, Site- and Scanner- Independent Calibration Model