ANN Optimization of Adsorption of Naphthalene on Composite Nanoparticles of Chitosan-CTAB-Sodium Bentonite Clay
In the present study, nanoparticles of chitosan-cetyltrimethylammonium bromide (CTAB)-sodium bentonite clay were synthesized and characterized using EDX, SEM, FTIR, XRF and XRD techniques. The composite material was utilized as adsorbent for the treatment of contaminated aqueous solution containing naphthalene. The adsorption process was modeled and optimized using artificial neural network (ANN) and ANN–genetic algorithm respectively. The process variables considered were surfactant concentration, 1 X , activation time, 2 X , activation temperature, 3 X , and chitosan dosage, 4 X . The predicted ANN models for % removal of naphthalene and adsorption capacity of the composite adsorbent fitted excellently the experimental adsorption data of naphthalene judging from high value of coefficient of determination, R2 , amongst others and very low values of error functions. The optimum conditions obtained with ANN–GA were 1 X = 70.7580 mg/L, 2 X = 2.9940 h, 3 X = 99.9880oC, and 4 X = 2.0340 g. The predicted response variables of 99.1461% removal of naphthalene and 249.67 mg/g adsorption capacity of the composite adsorbent using the ANN-GA models were in excellent with their corresponding experimental values of 99.35% and 250.16 mg/g with % errors of 0.2056 and 0.1960 respectively agreement. Consequently, the ANN models and the ANN–GA optimized conditions can be reliably applied to the experimental adsorption data of naphthalene on the chitosan–CTAB–sodium bentonite composite nanoparticles as adsorbent. Moreover, the prepared adsorbent in this study is a viable alternative adsorbent for the day treatment of industrial wastewater containing polycyclic aromatic compounds, especially naphthalene.
Introduction
Polycyclic aromatic hydrocarbons (PAHs) are described as fused two or more aromatic rings. Their presence in the environment is globally very much evident as pollutant in wastewater or contaminant in water bodies and soil linked to anthropogenic activities, especially those with high proximity to oil producing companies and natural sources. This leads to prolonged adverse health effects due to their carcinogenic, mutagenic, teratogenic and immunotoxicogenic nature. Hence, PAHs have been listed amongst the priority pollutants to be tracked in industrial effluents by the European Environmental Agency in the year 2000. Moreover, in 2006, the World Health Organization (WHO) recommended a limit for PAHs in potable water. The separation of PAHs from contaminated aqueous solution is quite tasking because they are known to be hydrophobic, thermostable and non-biodegradable [1, 2]. Thus, the removal of PAHs from industrial wastewaters is an area of key interest to the world at large.
The literature is furnished with information on the sterling attributes of adsorption technique as a panacea for the treatment of PAHs–contaminated water, among other available options like ion-exchange, flocculation or coagulation, chemical oxidation, reverse osmosis and precipitation. The simplicity in design, ease of adaptability to suit process conditions, high capacity or separation efficiency of targeted pollutants and recyclability of adsorbent are the comparative advantages credited to adsorption process [3]. The earth crust or surface, agricultural and industrial wastes are currently one of the predominant sources of low-cost adsorbents and they are apt substitute for the commercially ones in terms of cost and adsorption capacity [4, 5, 6, 7, 8, 9]. In the last 2 decades, these sources have been thoroughly utilized and explored for treatment of aqueous solutions with foreign or unwanted materials. Despite this level of development, the search amongst concerned environmentalists for more low-cost alternative sources of adsorbents that may be subjected to some treatment conditions so as to possess unique features directed for the treatment of contaminated water is still ongoing.
In recent times, a nitrogenous polysaccharide that trails cellulose in abundance, which is derived from sea food wastes, has been projected as a promising material suitable for the treatment of contaminated aqueous or effluent solutions [10]. This biopolymer is known as chitosan. Its nomenclature is simply poly-β-(1→4)-2-amino-2-deoxyl-D-glucose, which primarily consists of three major reactive functional groups of amine (–NH2), acetamide (CH3CONH2) and primary and secondary hydroxyl groups (–OH–) in its structural frame work [11]. The chemical nature, positive charge, flexibility of the structural framework and presence of high amount of amine and hydroxyl groups of chitosan serve as active adsorption sites necessary for the treatment of contaminated aqueous solution [7, 12, 13]. It has tremendously gained enormous economic importance being used, among others, as plasticizer [14], stabilizer [15], preservatives [16] and drug deliverer [17]. It has equally attracted environmental interest owing to its low cost, insensitivity to toxic substances, ease of modification, biodegradable nature, biocompatibility, renewability and the ability to chelate pollutants of various hazardous effects [12, 18, 19]. However, chitosan adsorption performance is pH sensitive. In acidic media, the amino group ionizes to become cationic and predisposes it easily to dissolute in the medium and exhibits more polyelectrolyte attributes [12]. Hence, it is subjected to some modification process by way of graft or cross linking to improve and enhance its mechanical and physical properties to possess the desirable features. Researchers mostly settle for the former in lieu of the latter because it is void of compromise of some adsorption sites. One of the readily available less expensive materials, which can be blended or impregnated with chitosan to hype the physical and mechanical properties is the clay minerals such as bentonite clay. Bentonite clay has the molecular formula, Mg2Al10Si24O60(OH)12[Na,Ca] [20] and is formed from the product of devitrification and chemical alteration material of igneous origin [21]. It is a smectite clay that contains largely montmorillonite [22, 23]. It was widely reported and described as a 2:1 type of aluminosilicate whose structure consists of two-dimensional layers sandwiched centrally with octahedral sheet of alumina fused to two external silicate layers [24, 25]. According to Anirudhan and Ramachandran [26], bentonite clay possesses the unique characteristics of exhibiting isomorphous substitution (Al3+ for Si4+ common in the tetrahedral layer and Mg2+ for Al3+ in the octahedral layer) and ion exchange between inorganic cations (Na+, Ca2+, amongst others) at its disposal to provide a balance between the negative and positive charges. In addition, bentonite clay is broadly classified according to predominate cations as Na-bentonite and Ca-bentonite, amongst others. It is characterized with a net variable negative charge that attracts water molecules leading to expansion in size, especially the Na-bentonite, possession of very thin layers and small particle sizes that influence and meaningfully contribute notably for their larger surface area, higher cation exchange, thermal stability, adsorption capacity, swelling ability, plasticity, shrinkage properties and other endearing physio-chemical properties suitable for myriad industrial and scientific applications than other types of clay [21, 25, 27, 28, 29, 30]. Similarly, the raw calcium bentonite clay is bedeviled with poor settling characteristics, particle size, hydrophilic nature, among others, that hinder the adsorption of organic compounds like polycyclic aromatic hydrocarbon (PAHs) [25]. These challenges associated with chitosan and bentonite mineral clay can be averted through modification process leading to the formation of hybrid composites or matrix with noticeable desirable qualities and high performance in terms of physical, chemical and mechanical properties [31]. The use of chitosan-bentonite matrix has been reported as a viable adsorbent for the separation of pollutants like heavy metals, dyes compounds, organic compounds, to mention but a few, from aqueous solutions especially those garnished with surfactants (such as cetyl trimethyl ammonium bromide, CTAB) to enhance interlayer spacing of the bentonite structural frame work and introduce NH4 + as functional group in the composite or hybrid adsorbent [32]. CTAB, with molecular formula [(C16H33)N(CH3)3] Br, finds extensive applications in biological, medical, protein electrophoresis and DNA extraction processes. It has equally been used for applications from nanoparticle synthesis to cosmetics. It is frequently used as an effective means of introducing organic cations for transformation from hydrophilicity to hydrophobicity and organophilicity [25]. In addition, it facilitates adequate interlayer opening for chitosan intercalation [29, 33] coupled with the electrostatic attraction of NH3 + and the available negative sites bentonite structure [34]. This is important because adsorption of organic molecules onto clay minerals is influenced by the chemical properties of the molecules and its surface properties [35].
The success of any adsorption process largely depends on the nature, adsorption capacity of the adsorbent used and the optimum process variables. Against the backdrop, the appropriate optimization and modeling tool must be employed to achieve optimum variables conditions for high efficiency removal of the selected PAHs (such as naphthalene used in this study) and the pollutants under consideration. Several modeling tools are in vogue and are widely applied for input-output set of data particularly in engineering fields. One of the tools with outstanding performance is the artificial neural network (ANN), which is a branch of the artificial intelligence (AI). Artificial neural network (ANN) has proved to be a good modeling tool endearing its applications to so many research problems involving non-linear or continuous functions owing to its high degree of accuracy [36]. It is categorized as an artificial intelligence modeling technique due to its unique and resounding ability to capture and recognize patterns for establishing relationship between input and output data. Equally, it can conveniently handle huge amount of data with notable complex features and generalize them through self-learning to arrive at the best output despite the enormity of available inputs. Moreover, it makes sound judgment of the high prediction accuracy with new data set within the purview of the experimental work, it is void of complicated programming and the training process is without prior knowledge of the data set of which it is intended to be modeled [37, 38]. Modeling process is geared towards optimization to achieve the optimum conditions of the process variables. There are basically two methods, which are often used to determine the optimum set of design variables that can then provide minimum or maximum value of the objective function associated from the experimental design. These methods are gradient and search methods [38, 39]. The gradient based method is more or less prone to local optimization as against the search-based method. To improve the performance of ANN in achieving global optimization, the evolutionary algorithm such as the genetic algorithm, one of the choicest and most popular algorithms, is employed [40]. The dearth of insightful information of the interaction and relative importance, modeling and optimization of the process variables involved in the production of the matrix of chitosan–CTAB–bentonite clay used as adsorbent for the treatment of aqueous solution contaminated with naphthalene necessitated this study, which has not been reported in the literature to the best our knowledge. Hence, the primary design of this study is to carry out modeling and optimization studies of the adsorption of naphthalene on the synthesized composite nanoparticles of chitosan– CTAB–sodium bentonite clay using artificial neural network (ANN) and ANN–genetic algorithm (GA) respectively. This is with the objectives of obtaining applicable models and optimum conditions for the % removal of naphthalene and adsorption capacity of the synthesized composite adsorbent. In addition, the prepared adsorbent was characterized using EDX, SEM, FTIR, XRF and XRD techniques. The efficacy of the nanoparticles of chitosan–CTAB–sodium bentonite clay in the removal of naphthalene from aqueous wastewater was reported in this study. Hence, the prepared material in this study is a viable alternative adsorbent for the treatment of industrial wastewater containing naphthalene.
Methodology
Materials
The states and sources of the materials used in this work have been succinctly reported by Olafadehan, et al. [41], which include raw bentonite clay, Archachatina marginata (African giant snail) shell waste, hydrochloric acid (HCl), ethanoic acid, sodium trioxocarbonate (IV) (Na2CO3), ammonium ethanoate (CH3COONH4), sodium hydroxide (NaOH), naphthalene (C8H10), methylene blue (C16H18ClN3S) and cetyltrimethylammonium bromide (CTAB), [(C16H33) N(CH3)3]Br.
Preparation of Composite Nanoparticles
The preparation of composite nanoparticles of chitosan– CTAB–Na bentonite clay was reported in the work of Olafadehan, et al. [41]. In this study, this composite adsorbent was used for the optimization studies of naphthalene adsorption.
Measurement of the Physicochemical Properties
The measurement of the physicochemical properties of the resulting chitosan–CTAB–Na bentonite clay nanoparticles is reported elsewhere [41]. This includes specific gravity, moisture content, bulk and tapped density, particle (true) density, porosity, Hausner ratio, iodine number, void volume, surface zero-point charge, swelling index, Barrett, Joyner and Halenda (BJH) pore diameter, cation exchange capacity (CEC), total pore volume and micropore volume.
Characterization of Chitosan-CTAB-Na Bentonite Clay Hybrid Matrix
The detailed characterization of the prepared chitosan– CTAB–Na bentonite clay nanoparticles has been reported by Olafadehan, et al. [41]. This includes Brunaüer-Emmet-Teller (BET) surface area, Energy Dispersive X-ray Spectroscopy (EDX), scanning electron microscopy (SEM), Fourier Transform Infrared Spectroscopy (FTIR), X-ray fluorescence spectrophometry and X-ray Diffraction (XRD analyses.
Batch Adsorption Experiment of Naphthalene
The standard and stock solutions of naphthalene were prepared by dissolving 5 g of it in 1000 mL of deionized water and glacial ethanol mixture (40 v/v%). The mixture was thoroughly stirred to attain homogenous solution. The solution concentration of 250 mg/L maintained throughout the experimental runs was obtained by stepwise dilution. Sorbent dose of 50 mg was added to the various solutions in each experimental run. The solution mixtures were agitated in a mechanical shaker (JP Selecta SKU 3000974) for 45 min. Subsequently, the solution mixture was filtered with Whatman Grade 44 ashless thin filter paper, 125 mm circle. The equilibrium concentration of naphthalene was evaluated using UV-visible spectrophotometer at maximum wavelength of 270 nm. The amount of naphthalene per gram of the adsorbate and the percentage removal, e R , were obtained using Equations (1) and (2) respectively:
− = 0 (1)
V m c c q e e
c − = c c c R e e (2)
0 ×
100
0 where eq is the equilibrium amount of naphthalene in the adsorbed phase (mg/g), 0_c_ and ec the initial and equilibrium concentrations of naphthalene in the aqueous solution (mg/L), c m the mass of the composite adsorbent (g) and V the volume of aqueous solution in contact with the adsorbent (L).
Optimization Studies
The optimization technique of artificial neural network (ANN) was used to model and optimize the synthesis process variables investigated in this study.
Experimental Design
The number of experimental runs for a full central design composite (CCD) adopted in this study is determined using Equation (3) [42, 43]:
c n n n N + + = 2 2 (3)
where the number of factorial runs ( ) n 2 = , the number of axial runs ( ) n 2 = for enabling the estimation of experimental error, cn the number of center runs needed to ensure constant variance in model prediction and n the number of the independent variables. For the four independent variables (surfactant concentration, 1 X , activation time,
2 X , activation temperature, 3 X and chitosan dosage, 4 X ) investigated in this study, the full experimental design consists of 31 runs with 16 factorial, 8 axial and 7 center points, which was obtained using Equation (3). Table 1 depicts the values of the coded and uncoded independent variables, experimental range and levels.
| Control factors | −α(−2) | -1 | 0 | 1 | +α(+2) |
|---|---|---|---|---|---|
| Surfactant concentration, X (mg/L) 1 | 20 | 40 | 60 | 80 | 100 |
| Activation time, X (h) 2 | 1 | 1.5 | 2 | 2.5 | 3 |
| Activation temperature, X (oC) 3 | 60 | 70 | 80 | 90 | 100 |
| Chitosan dosage, X (g) 4 | 2 | 3 | 4 | 5 | 6 |
Table 1: Coded and uncoded factors for the design of experimental range and levels. The coded values were obtained using Equation
( ) max − + = − (4)
2 2 min X X X X X X
i min max The full experimental design is displayed in Table 2.
| Experimental runs (standard order) | X (mg/L) 1 | X (h) 2 | X (oC) 3 | X (g) 4 |
|---|---|---|---|---|
| 1 | 40 | 1.5 | 70 | 3 |
| 2 | 80 | 1.5 | 70 | 3 |
| 3 | 40 | 2.5 | 70 | 3 |
| 4 | 80 | 2.5 | 70 | 3 |
| 5 | 40 | 1.5 | 90 | 3 |
| 6 | 80 | 1.5 | 90 | 3 |
| 7 | 40 | 2.5 | 90 | 3 |
| 8 | 80 | 2.5 | 90 | 3 |
| 9 | 40 | 1.5 | 70 | 5 |
| 10 | 80 | 1.5 | 70 | 5 |
| 11 | 40 | 2.5 | 70 | 5 |
| 12 | 80 | 2.5 | 70 | 5 |
| 13 | 40 | 1.5 | 90 | 5 |
| 14 | 80 | 1.5 | 90 | 5 |
| 15 | 40 | 2.5 | 90 | 5 |
| 16 | 80 | 2.5 | 90 | 5 |
| 17 | 20 | 2 | 80 | 4 |
| 18 | 100 | 2 | 80 | 4 |
| 19 | 60 | 1 | 80 | 4 |
| 20 | 60 | 3 | 80 | 4 |
| 21 | 60 | 2 | 60 | 4 |
| 22 | 60 | 2 | 100 | 4 |
| 23 | 60 | 2 | 80 | 2 |
| 24 | 60 | 2 | 80 | 6 |
| 25 | 60 | 2 | 80 | 4 |
| 26 | 60 | 2 | 80 | 4 |
| 27 | 60 | 2 | 80 | 4 |
| 28 | 60 | 2 | 80 | 4 |
| 29 | 60 | 2 | 80 | 4 |
| 30 | 60 | 2 | 80 | 4 |
| 31 | 60 | 2 | 80 | 4 |
Table 2: Experimental design generated by MINITAB 17.
Artificial Neural Network
The artificial neural network (ANN) is a technique widely applied as a modelling tool in many areas of research. It is a modeling tool whose operation was configured after the biological nervous system under the auspices of the brain. It can adequately model simple and complex non-linear problems. The neural network exists in different forms such as feed forward back propagation, feed forward distributed time delay, feed forward time-delay, generalized regression, Hopfield, layer recurrent, linear layer, probabilistic, radial basis, self-organizing map, among others [44]. The feed forward back propagation is the most popular and widely reported type of neural network replete in the literature. It is the type of neural network marked with multiple layers that are interconnected, the gradient error is calculated from input to output layer; propagates the error estimated backward via the layers to update the weights and biases by modification in process yield the desired results [45]. The feed forward back propagation network is used in this work because of its unique ability to model processes by updating weights and bias associated with its structure after repeated training cycles. In terms of structure, the feed forward back propagation network, as depicted in Figure 1, consists of three layers: input, hidden and output layers.
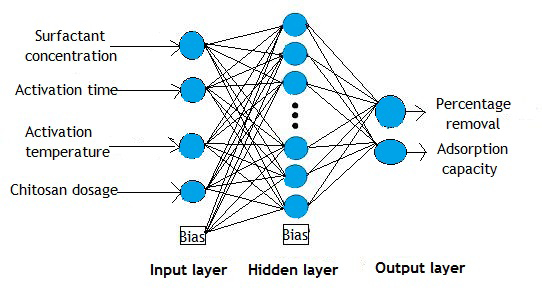
The input layer accommodates the input variables, ( ) n i X i ,....., 2 ,1 = , which are surfactant concentration,
1 X , activation time, 2 X , activation temperature, 3 X , and chitosan dosage, 4 X . The hidden layer houses the neurons with weights and bias. The input variables are specifically allotted to the neurons, ( )z i ni ,....., 2 ,1 = , which aid the establishment of a relational equation that comprises of the weights, ij w and bias term, ib , to give the weighted output in the form [44]:
n ∑ = + = i i i ij i b x w C
(5)
1 The scalar weighted output is passed through a transfer function interconnecting the layers. The transfer functions associated with feed forward back propagation include hyperbolic tangent sigmoid (tansig), log-sigmoid (logsig) and linear (purelin) expressed respectively as follows [41]: Hyperbolic tangent sigmoid transfer function (tansig):
1 1 ,1 1 2
2 ≤ ≤ − − + = − i x i F e F (6)
Sigmoidal transfer function: 1 0 , 1 1 ≤ ≤ + = − i x i F e F (7)
Purelin (linear): ∞ + ≤ ≤ ∞ − = i i F x F , (8) From the transfer functions given in Equations (6)– (8), depending on the type of the activation function at the hidden and output layers after optimizing the neural network, Equation (5) becomes:
( ) i i C f F = (9)
In this present investigation, the activation function at the hidden and output layers were tansig and purelin functions respectively. Hence, Equation (9) can be simply expressed as [46]:
[ ] ( ) { } 0 21 12 12 21 tan (1), (2), (3), (4) Y purelin w sig w x x x x b b = × × + + (10) where )3 ( ,) 2 ( ,)1( x x x and ) 4 (x represents the inputs,
12 w and 12 b are the weights and bias of hidden layer, 21 w and
21 b are the weight and bias of the output layer. The relative importance of the input variables is usually evaluated using the connection weight method such as Garson algorithm and Olden algorithm or by model response method such as sensitivity analysis.
Results and Discussion
Characterization of the Chitosan-CTAB-Na Bentonite Clay Nanoparticles
Physicochemical Characteristics: The physicochemical characteristics of the composite nanoparticles of chitosan- CTAB-sodium bentonite clay used as adsorbent in this study is shown in Table 3 [41].
| S/No. | Parameters | Values |
|---|---|---|
| 1 | Specific gravity | 0.7179 |
| 2 | Moisture content (%) | 3.04 |
| 3 | Bulk density (g/cm3) | 0.8367 |
| 4 | Particle (true) density (g/cm3) | 3.7397 |
| 5 | Porosity | 0.7557 |
| 6 | Tapped density | 0.9136 |
| 7 | Hausner ratio | 1.0919 |
| 8 | Iodine number (mg/g) | 1682 |
| 9 | Pore (void) volume | 0.8272 |
| 10 | pH zpc | 7.2 |
| 11 | BET surface area (m2/g) | 1,668.00 |
| 12 | MB surface area (m2/g) | 1,984.05 |
| 13 | Cation exchange capacity (millieq/100 g) | 4840 |
| 14 | Barrett–Joyner–Halender (BJH) pore diameter (Å) | 20.82 |
| 15 | Total pore volume (cm3/g) | 0.8682 |
| 16 | Micropore volume (cm3/g) | 0.3219 |
| 17 | Swell/ degree of expansivity (%) | 97.76 |
Table 3: Physiochemical properties of the prepared chitosan–CTAB–Na bentonite clay.
In Table 3, the estimated external surface area of the composite adsorbent using the methylene blue method (1,984.053m2/g) is greater than the estimated BET surface area of 1,668 m2/g. This may be as a result of the inability of N2 to adequately penetrate the internal region of swelling clay while the methylene blue (MB) method can account for both external and internal surface areas [47, 48]. The composite adsorbent prepared in this study is adjudged to be a good material with excellent flow ability for the adsorption of naphthalene since the Hausner ratio is within 1.00–1.11 [49]. The cation exchange capacity (CEC) is a measure of the quantity of readily available exchangeable cations sufficient to neutralize the negative charge in the bentonite structure expressed in milliequivalent per 100 g of the adsorbent [50, 51].
Ammonium ethanoate was used for evaluating the amount of CEC, which was obtained as 4840 milliequivalent/100 g of the composite adsorbent. The swelling capacity/ratio/ index of the composite adsorbent calculated as 97.76% is credited to bentonite clay, the primary constituent in the matrix and a confirmation of the swelling ability of bentonite clay. The porosity value is an indication and reflection of the amount of space not occupied by the framework of atoms that make-up the structure of the composite adsorbent. The result shows that 75.57% of the total volume of the composite adsorbent structure is made up of void in the form of cavities, channels or interstices but it does not reveal the total fraction of voids or their distributions [52, 53]. The Barrett–Joyner–Halender (BJH) pore diameter value gives an idea of the nature and classification of the porosity of the adsorbent as microporous if the pore diameter is within the range of 2–50 nm [54, 55] and thus falls within the purview of nanoparticles [56]. Thus, microporous and composite nanoparticles of chitosan–CTAB– bentonite clay was obtained in this study. The value of the micropores volume in comparison with the total pore volume gives an indication that the composite adsorbent comprises more macropores than micropores with a percentage mesopore volume of 74.4413% and micropore volume of 25.5586%. The mesopores facilitate the adsorption of the large molecular size naphthalene molecules [57, 58, 59] to the structural framework to the credit of the CTAB surfactant applied that enabled the pore size control from the typical micropores nature of clay to mesopores [60, 61] contrary to the result of Hussein, et al. [62], which reported decrease in surface area as one compares the precursor of the composite adsorbent, however, without the use of surfactant. The pH zero surface charges of the composite adsorbent (i.e., nanoparticle of chitosan–CTAB–sodium bentonite clay) was obtained as 7.2.
EDX, SEM, FTIR, XRF and XRD
The energy dispersive X-ray (EDX) spectroscopy and the micrographs of the surface outlook of the prepared composite nanoparticles of chitosan–CTAB–Na bentonite clay before and after adsorption of naphthalene respectively at different magnifications of 9,000X, 10,000X and 11,000X are reported by Olafadehan, et al. [41]. The FTIR spectra and X-ray fluorescence (XRF) analyses of raw bentonite clay (Ca–bentonite clay), Na–bentonite clay and surfactant Na- bentonite clay impregnated on chitosan (chitosan–CTAB– sodium bentonite clay) were reported elsewhere [41]. The XRD analysis for the surfactant modified Na-bentonite clay impregnated on chitosan was reported by Olafadehan, et al. [41].
ANN Analysis
The modelling was actualized using MATLAB 2018® with the inbuilt nntool. The experiment data was normalized and apportioned into various set or categorized for training, testing and validation. In this investigation, 70%, 15% and 15% of the experimental data were used for training, testing and validation respectively. The normalization is necessary to avert overflows and reduce minimally the scaling effect of parameter values owing to high or small values of weights [46, 63, 64] and was achieved using Equation (11):
max min 2 1 i norm X X X X X − = − −
min (11) where norm X is the normalized value of i X (the input or output variable X), n i m X and x a m X are the respective minimum and maximum values of variable X.
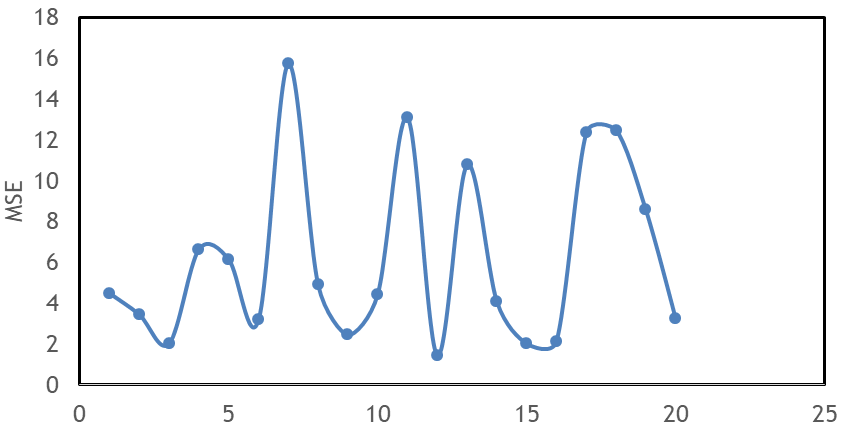
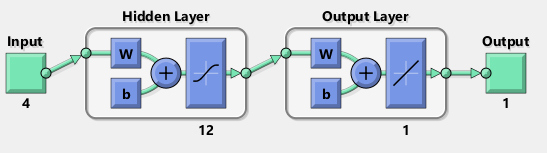
The training of the experimental data to model the production process of the hybrid adsorbent was successfully carried out with Levenberg-Marquardt algorithm with hidden layers of 12 neurons after optimization of the neural network architecture with minimum MSE value as depicted in Figure 2 while the optimized architecture for the response variables is shown in Figure 3.
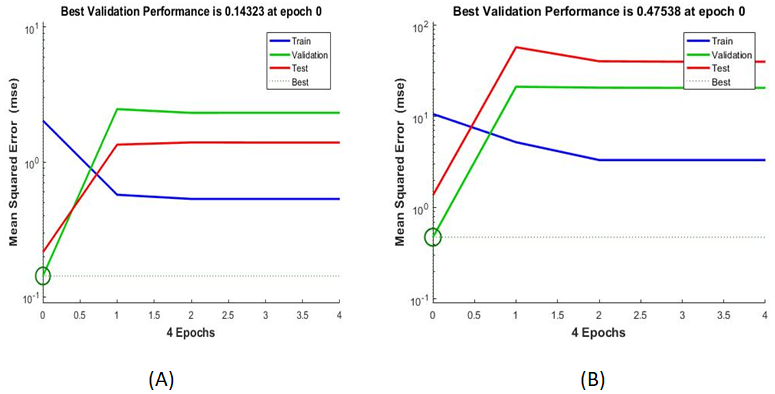
The best validation performance is provided in Figures 4a & 4b, which show the performance of the network’s training process measured in terms of MSE displayed on log scale. The resultant-mean square error of 0.14323 and 0.47538 for percentage naphthalene removal and the adsorption capacity of the composite adsorbent respectively are quite small after 4 epochs or iterations. The training curve diminishes more than the validation curve, which indicates that the performance of the trained network with the learning data is better than the data not involved in the prior learning process.
ANN Empirical Function
An ANN empirical relation was obtained using the procedure outlined in Shahryari, et al. [65] whereby the weights ( i W ) and biases ( ib ) of the optimized network presented in Tables 4 and 5 are employed. The predicted models for % removal of naphthalene and adsorption capacity of the composite nanoparticles of chitosan–CTAB– Na bentonite clay are given in Equations (12) and (13) respectively:
( ) 7 6 5 4 3 2 1 4938 .0 4982 .0 6690 .0 3162 .0 2572 .0 0202 .0 0127 .0 F F F F F F F R pred e + + − − + − =
8 9 10 11 12 0.4767 0.5653 0.0475 0.0117 0.5528 0.1123 F F F F F + + + + − − (12) ( ) 7 6 5 4 3 2 1 6636 .0 1085 .0 4999 .0 4008 .0 3476 .0 0208 .0 3710 .0 F F F F F F F q pred e + − − − + − − =
8 9 10 11 12 0.6095 0.1897 0.3065 0.2966 0.3607 0.6434 F F F F F − − − − − + (13) where the coefficients are the weights and biases to the output layer and iF is the tansit activation function used in the hidden layer given as:
( ) 2 2 1 1, 1 12 iE iF e i − = + − = − (14)
for the optimized number of neurons using the Bayesian regularization training algorithms. The weighted sum of the input, iE , defined as:
i i i i b X w E + × = (15)
Application of Equation (22) to the four process variables under study yields:
i i i i i i b X w X w X w X w E + × + × + × + × = 4 4 3 3 2 2 1 1 (16) The training, validation and testing results in Figure 5 show that 2 R values of 0.97004 and 0.97425 for training; 0.99747 and 0.99808 for validation; 0.99623 and 0.99627 for testing and 0.97478 and 0.97895 for the overall process respectively are indication of good fitness of the ANN models to the % removal of naphthalene and adsorption capacity of the composite nanoparticles of chitosan-CTAB-Na bentonite clay as adsorbent.
Relative Importance of Process Variables The response model sensitive analysis was used to ascertain the relative importance of the process variables with the aid of nntool in MATLAB 2018 software. The results in Table 6 show that surfactant concentration, 1 X , exhibits the highest regression value of 0.5885 and RSME minimum error of 3.398 amongst the single factors considered, followed by
2 X , 4 X and 3 X in that sequence. For the double interactive effect, the interaction of surfactant concentration, 1 X , and activation time, 2 X , registered the highest regression value ( 2 R = 0.6998, RSME = 2.967) and effect while the interaction of surfactant concentration, 1 X , and chitosan dosage, 4 X , ranked second while the interactions, 3 1_X_ X , 3 2 X X , 4 2 X X and 4 3_X_ X ranked third, fourth, fifth and sixth respectively. Similarly, the surfactant concentration, 1 X , activation time,
2 X , and chitosan dosage, 4 X , gave the highest effect among the three factors ( 2 R = 0.8143, RSME=2.2922). Finally, the four factors interaction gave a high regression in predicting the response variables where the value of RSME decreased from 2.2922 to 1.0935 with the inclusion of 3 X .
Fitness and Comparison of ANN Models with Experimental Data The bias, Bi , value was estimated for both responses (% removal of naphthalene and adsorption capacity of the prepared composite nanoparticles of chitosan-CTAB-Na bentonite clay) using Equation (17) [66]:
| Neutron | 1 | 2 | 3 | 4 | 5 | 6 | 7 | 8 | 9 | 10 | 11 | 12 |
|---|---|---|---|---|---|---|---|---|---|---|---|---|
| Input 1 (w i1) | -1.6108 | -1.0731 | -1.4334 | -1.3252 | 1.4732 | 2.2037 | 2.0619 | 0.90345 | -0.06057 | -1.1942 | 0.98015 | -1.4537 |
| Input 2 ( w i2) | -1.1499 | -1.4549 | 1.6223 | 2.0623 | -1.6065 | 0.43478 | 1.616 | -1.7341 | 1.3155 | -0.15883 | -0.01606 | 1.0922 |
| Input 3 ( w i3) | 1.085 | 1.6781 | 1.2409 | -0.62882 | 1.5771 | -1.3895 | -0.17318 | 1.7145 | -1.6052 | -1.6925 | 1.9413 | -1.795 |
| Input 4 ( w i4) | -0.94067 | -0.25848 | -1.221 | -0.03163 | 1.5617 | 0.10943 | 0.62915 | 1.7382 | -1.45 | 1.2566 | -1.2038 | 0.028271 |
| Output weights | 0.012719 | -0.20237 | 0.25718 | -0.31618 | -0.66897 | 0.49815 | 0.49383 | 0.47665 | 0.56532 | 0.047469 | 0.011672 | -0.55277 |
| Input bias, b i | 2.663 | 2.5883 | 1.126 | 1.7154 | -0.471 | -0.08647 | 0.67645 | 0.76394 | 0.83465 | -1.4236 | 2.448 | -2.7209 |
| Output bias, b j | -0.11226 |
Table 4: ANN optimized connection weights and biases of percentage removal of naphthalene.
| Neutron | 1 | 2 | 3 | 4 | 5 | 6 | 7 | 8 | 9 | 10 | 11 | 12 |
|---|---|---|---|---|---|---|---|---|---|---|---|---|
| Input 1 ( w i1) | -1.8328 | 0.018279 | 1.5421 | 1.9834 | 2.9306 | 0.35674 | -2.7643 | -0.861 | 1.2955 | -1.6631 | -1.6631 | 1.0973 |
| Input 2 ( w i2) | -1.3799 | 1.7741 | -0.75282 | -1.4597 | -0.40348 | 0.10993 | -1.6344 | 2.1825 | -0.40149 | -0.40149 | -0.53186 | 1.2705 |
| Input 3 ( w i3) | -1.3558 | 1.0569 | 2.0988 | -1.2134 | -0.22985 | -2.3123 | -0.47708 | 0.64505 | 1.6919 | 1.6919 | -1.9466 | 0.050203 |
| Input 4 ( w i4) | 0.062003 | -1.5822 | -0.53871 | -1.2991 | 0.37565 | -0.77309 | -1.3133 | 0.51045 | -0.86492 | -0.86492 | 0.94824 | 0.89316 |
| Output weights | -0.37098 | -0.02077 | 0.34761 | -0.40078 | 0.49986 | -0.10849 | 0.66362 | -0.60949 | -0.18969 | -0.30653 | -0.29661 | -0.36068 |
| Input bias, b i | 2.4595 | -2.0844 | -1.208 | -0.93916 | -0.68011 | -0.31968 | 0.57753 | -1.2117 | -0.92617 | 2.2824 | -1.4416 | 3.4343 |
| Output bias, b j | 0.64342 |
Table 5: ANN optimized connection weights and biases of adsorption capacity of the composite nanoparticles of chitosan– CTAB–Na b
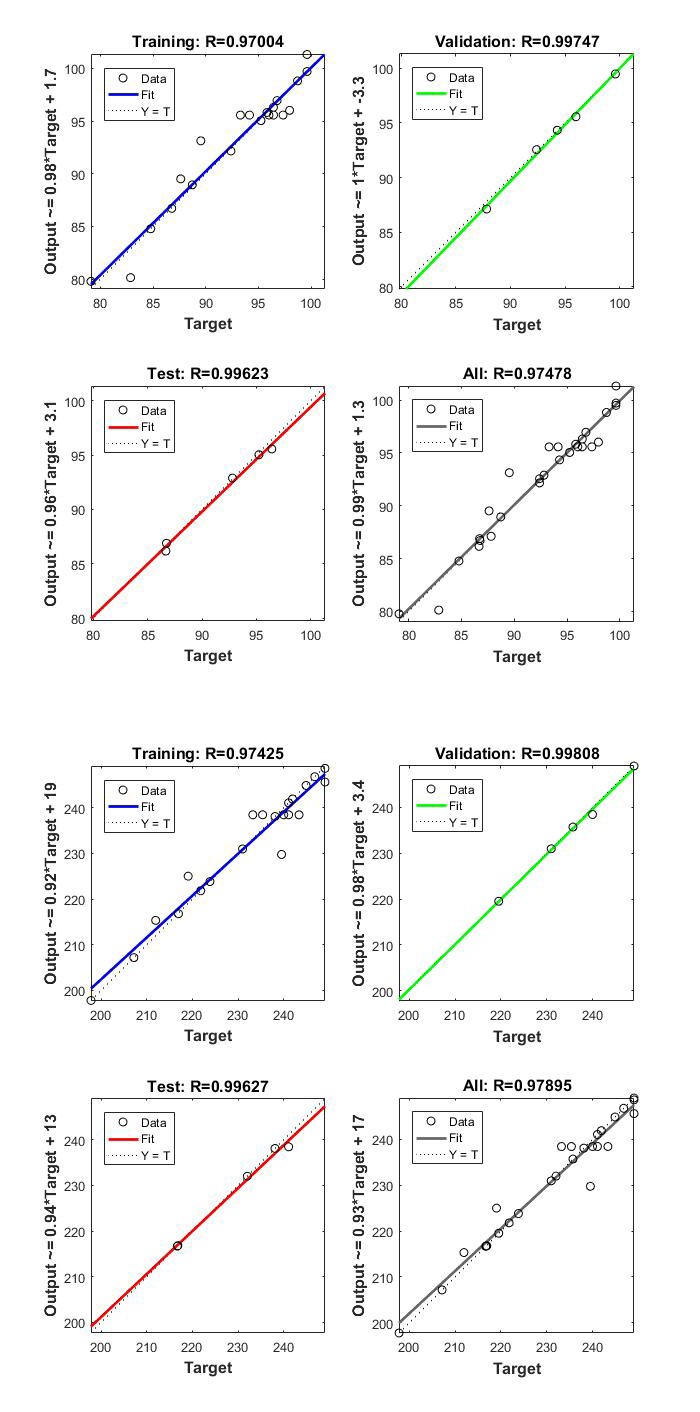
(a)
(b) Figure 5: Linear regression analysis between the experimental values and predicted values of ANN for training, validation, testing and overall (a) naphthalene percentage removal, (b) adsorption capacity of chitosan–CTAB–sodium bentonite clay composite adsorbent.
| S/No. | Parameters | RMSE | R2 | Best linear equation | Ranking |
|---|---|---|---|---|---|
| 1 | X 1 | 3.3982 | 0.5885 | Y=0.9465X + 4.8217 | 1 |
| 2 | X 2 | 4.9719 | 0.1327 | Y=0.8963X +8.9953 | 2 |
| 3 | X 3 | 5.1923 | 0.0451 | Y=0.8085X +17.351 | 4 |
| 4 | X 4 | 5.1235 | 0.0603 | Y=1.0583X - 5.164 | 3 |
| Double-factor effect | |||||
| 5 | X X 1 2 | 2.9669 | 0.6998 | Y=0.7869X +19.822 | 1 |
| 6 | X X 1 3 | 3.3777 | 0.6004 | Y=0.8929X +9.7844 | 3 |
| 7 | X X 1 4 | 3.0947 | 0.6565 | Y=1.0069X – 0.5995 | 2 |
| 8 | X X 2 3 | 4.9509 | 0.146 | Y=0.7062X + 27.296 | 4 |
| 9 | X X 2 4 | 5.664 | 0.0875 | Y=0.4005X +56.079 | 5 |
| 10 | X X 3 4 | 5.4667 | 0.0599 | Y=0.41X +54.561 | 6 |
| Three-factor effect | |||||
| 11 | X X X 1 2 3 | 2.3473 | 0.8038 | Y=0.9979X + 0.398 | 2 |
| 12 | X X X 1 2 4 | 2.2922 | 0.8143 | Y=0.8366X +15.555 | 1 |
| 13 | X X X 2 3 4 | 5.3133 | 0.157 | Y=0.4903X + 47.273 | 3 |
| Four-factor effect | |||||
| 14 | X X X X 1 2 3 4 | 1.0935 | 0.9745 | Y=0.9628X +3.4044 |
Table 6: Sensitivity analysis of process variables.
= ∑ (17)
y Bi In n y =
1 exp n i t ,exp
1 , i i calc The bias values of 1.000281 and 1.000127 were estimated for % removal of naphthalene and adsorption capacity of the composite adsorbent using ANN technique respectively. The approximated value of 1 for each response translates that the errors are normally distributed depicting a good model fit using ANN technique [66]. Equally, the following error functions were used to compare the predicted ANN models with the experimental data of % removal of naphthalene and adsorption capacity of the composite nanoparticles of chitosan–CTAB–Na bentonite clay [67, 68, 69, 70, 71, 72]:
n ( )
2 ∑ Y Y R Y Y
− = − − , , 2 1
i e i p i n
1 = (18) ( )
2 ∑ , 1 i p e i
= ( ) 2 2 1 . 1 1 1 n adj R R n k − = − − × −−
(19) n ( )
2 = − = ∑ i p i e i Y Y RMSE n
, , 1 (20)
1 n i e i p i MAE Y Y n = = − ∑ (21)
, , 1 Y Y − =
, , 1 (22)
n ∑ = p i e i Y
n MAPE
1 , i e i Y Y
− = , , 100 (23)
n ∑ = p i e i Y
n MPE
1 , i p i
( ) 100 × = e Q RMSE SEP (24)
1 n ( ) ∑
2 , , Y Y n TIC
− = n i e i p i
1 = (25)
1 1 n ∑ ∑
1 0 , 1 = W I Y Y Y Y
1 (26) [ ]
2 , , , , i e i e i e i p i
1 = ( )( ) n
∑ Y Y Y Y R
− − = n
1 , , , , i p i p i e i e i
= (27) n ( ) ( ) ∑ ∑
1 = = CI WI R = × (28)
where n is the number of experimental runs, e iY , [=( ) xpt e i e R , or ( ) xpt e i eq , ] the measured adsorption data for run i, and pred iY , [=( ) pred i e R , or ( ) pred i eq , ] the predicted (or calculated) adsorption data for run i, 2 R is the coefficient of determination, RMSE the root mean square, MAE the mean absolute error, MAPE the mean absolute percentage error, MPE the mean percentage error, SPE the standard error prediction, TIC the Theil Inequality Coefficient, WI the Willmott index and CI the confidence or performance index.
The fit of the predicted % removal of naphthalene and adsorption capacity of the composite nanoparticles of chitosan-CTAB-Na bentonite clay as adsorbent with the experimental data can equally be developed based on the statistical function such as the Durbin-Watson Test (DWT). The DWT is an autocorrelation test in the differences between the experimental and predicted data (i.e., the residuals) from the analysis of statistical regression, such that 4 0 ≤ ≤DWT . For positive and negative autocorrelations, 2 0 < ≤DWT and 4 2 ≤ < DWT respectively. However, there is no autocorrelation detected in the sample if 0.2 = DWT . The value of DWT must be at least 1.0 for a good model [73]. The Durbin-Watson statistic is given by [72]:
SES SDS DWT = (29) where the sum of errors squared, SES, is given by:
n ( ) 2 2 2 2 2 2 ,exp , 1 2 3 1 1
i t i pred n n i SES Y Y ε ε ε ε ε − = = − = + + + + + ∑ (30)
. . . .
and the sum of differences squared (SDS) is given by:
( ) ( ) ( ) ( ) 2 1 2 3 4 2 2 3 2 1 2 .... − − + + − + − + − = n n SDS ε ε ε ε ε ε ε ε (31) and ( ) n i i ,...., 2 ,1 = ε is the difference between the experimental adsorption data, xpt e iY , and the predicted value, pred iY , .
The comparison between the experimental and predicted values of the two responses (i.e., % removal of naphthalene and adsorption capacity of the composite nanoparticles of chitosan–CTAB–Na bentonite clay ) using ANN technique are presented in Table 7 and depicted in Figure 6.
| (R ) (%) e expt | (R ) (%) e pred | % error | (q ) (mg/g) e expt | (q ) (mg/g) e pred | % error |
|---|---|---|---|---|---|
| 79.1 | 79.1 | 0 | 197.75 | 197.537 | 0.1077 |
| 96.43 | 96.4272 | 0.0029 | 241.075 | 241.01 | 0.027 |
| 86.67 | 86.6712 | -0.0014 | 216.675 | 216.611 | 0.0295 |
| 97.96 | 97.9595 | 0.0005 | 244.9 | 244.82 | 0.0327 |
| 87.81 | 88.3584 | -0.6245 | 219.525 | 219.545 | -0.0091 |
| 95.81 | 95.8094 | 0.0006 | 239.525 | 239.536 | -0.0046 |
| 88.72 | 88.7211 | -0.0012 | 221.8 | 213.414 | 3.7809 |
| 99.62 | 99.6202 | -0.0002 | 249.05 | 245.423 | 1.4563 |
| 84.77 | 84.741 | 0.0342 | 211.925 | 211.986 | -0.0288 |
| 95.24 | 95.2365 | 0.0037 | 238.1 | 238.189 | -0.0374 |
| 92.39 | 93.06 | -0.7252 | 230.975 | 230.98 | -0.0022 |
| 99.62 | 99.6189 | 0.0011 | 249.05 | 248.906 | 0.0578 |
| 86.72 | 86.7221 | -0.0024 | 216.8 | 216.723 | 0.0355 |
| 99.62 | 99.6202 | -0.0002 | 249.05 | 248.935 | 0.0462 |
| 96.77 | 94.1989 | 2.6569 | 241.925 | 240.567 | 0.5613 |
| 98.72 | 98.7187 | 0.0013 | 246.8 | 245.824 | 0.3955 |
| 82.86 | 82.8599 | 0.0001 | 207.15 | 206.928 | 0.1072 |
| 95.24 | 95.24 | 0 | 238.1 | 238.209 | -0.0458 |
| 86.77 | 86.7724 | -0.0028 | 216.925 | 216.888 | 0.0171 |
| 94.29 | 94.8912 | -0.6376 | 235.725 | 238.434 | -1.1492 |
| 89.53 | 89.5287 | 0.0015 | 223.825 | 232.19 | -3.7373 |
| 92.39 | 91.1929 | 1.2957 | 230.975 | 230.994 | -0.0082 |
| 87.62 | 87.6201 | -0.0001 | 219.05 | 219.082 | -0.0146 |
| 92.81 | 92.8094 | 0.0007 | 232.025 | 239.126 | -3.0604 |
| 96.43 | 95.8111 | 0.6418 | 241.075 | 238.574 | 1.0374 |
| 96 | 95.8111 | 0.1968 | 240 | 238.574 | 0.5942 |
| 96.43 | 95.8111 | 0.6418 | 241.075 | 238.574 | 1.0374 |
| 97.34 | 95.8111 | 1.5707 | 243.35 | 238.574 | 1.9626 |
| 93.29 | 95.8111 | -2.7024 | 233.225 | 238.574 | -2.2935 |
| 96 | 95.8111 | 0.1968 | 240 | 238.574 | 0.5942 |
| 94.15 | 95.8111 | -1.7643 | 235.375 | 238.574 | -1.3591 |
Table 7: Experimental % removal of naphthalene, ( ) _xpt_ _e_ _e_ _R_ , and adsorption capacity, ( ) _xpt_ _e_ _e_ _q_ , of compo
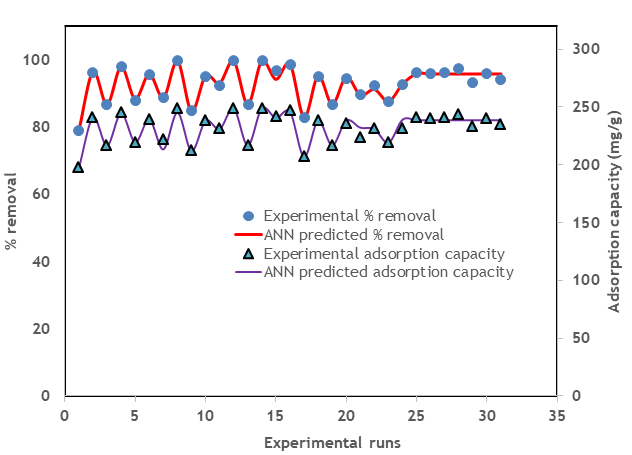
The values of the average absolute deviation (AAD) for the % removal of naphthalene and adsorption capacity of the prepared adsorbent are computed to be 0.0305 and 0.0298 respectively using the predicted ANN models. Moreover, the % errors as revealed in Table 7 are less than 5% for both responses. These are demonstrations of the fact that the ANN model for each of the responses is satisfactory for correlating the experimental adsorption data of naphthalene on the composite nanoparticles of chitosan–CTAB–Na bentonite clay as adsorbent since the lower the AAD and the % error values, the more reliable is the model. Equally, the computed error functions’ values are 2 R = 0.9750, 2 .R adj = 0.9740, RMSE = 0.8318, MAE = 0.0135, MAPE = 0.4422, MPE = 1.4275, SPE = 0.8962, TIC = 0.0045, WI = 0.9937, R = 0.9878, CI = 0.9816 and DWT = 1.9130 for % removal of naphthalene. For the adsorption capacity of composite nanoparticles of chitosan-CTAB-Na bentonite clay, 2 R = 0.9580, 2 .R adj = 0.9570, RMSE = 2.7427, MAE = 0.0465, MAPE = 0.7623, MPE = 1.9918, SPE = 2.9552, TIC = 0.0066, WI = 0.9863, R = 0.9735, CI = 0.9601 and DWT = 2.0030. The model with the high values of R, 2 R , 2 .R adj , WI, CI and DWT and the very low value of all other error functions (RMSE, MAE, MAPE, MPE, SPE, and TIC) depicts the satisfactory fit of the model. According to Marey et al. [74], confidence (or performance) index, CI > 0.85 depicts excellent process modeling for the ANN models applied in this study. Hence, the ANN models can be reliably applied to the experimental adsorption data of naphthalene on the chitosan–CTAB–sodium bentonite composite nanoparticles as adsorbent.
Optimization of Process Variables
The optimal process conditions for the synthesis of the chitosan-bentonite composite adsorbents were carried out using the hybrid of ANN-GA optimization techniques in the MATLAB R2018b software environment.
Genetic algorithm is a population based probabilistic iterative, search and optimization techniques, which operate on the mechanism and premises of natural genetics and evolution. It is a renowned stochastic search technique that improves performance by its unique ability to locate regions within the purview of any solution space to arrive at optimal solutions beyond the entrapment of local minima which other models use in this article are prone to Bello and Olafadehan [67]. The genetic algorithm tool box embedded in MATLAB R2018b software was used for the optimization process at the default settings. By default, genetic algorithms generate minimum values. However, for maximum values of the process variables, 1 X , 2 X , 3 X and 4 X , the fitness function adopted is usually converted to maximization by inversing or changing the sign [75] and applying the principle of Pareto analysis especially for multiple variable responses [67]. For the ANN-GA, the weights and biases were represented in the form of Equations (12) and (13) and used in the tool box. The fitness value with the least MSE value of the response variables alongside the corresponding process variables was selected as the optimum conditions. Hence, the optimum conditions obtained with ANN-GA are surfactant concentration, 1 X = 70.7580 mg/L, activation time, 2 X = 2.9940 h, activation temperature, 3 X = 99.9880oC, and chitosan dosage, 4 X = 2.0340 g. Comparison of the predicted response variables of 99.1461% removal of naphthalene and 249.67 mg/g adsorption capacity of the composite adsorbent) using the ANN-GA models with their corresponding experimental values of 99.35% and 250.16 mg/g reveal % errors of 0.2056 and 0.1960 respectively. Hence, excellent prediction ability of the ANN-GA model was obtained having portrayed very low percentage error. The blend of the inductive learning ability of the neural network and the deductive learning of the genetic algorithm on the objective function may have aided the superlative performance of ANN-GA in predicting the experimental adsorption data.
Adsorption of Naphthalene
Table 8 highlights the adsorption capacity of some adsorbents for the adsorption of naphthalene and the value obtained in this study using chitosan–CTAB–sodium bentonite clay composite nanoparticles as adsorbent at temperatures between 298 and 303 K. It is obvious that the adsorption capacity of the prepared composite adsorbent used in this study is higher than the value obtained for the adsorbents employed in the literature. Hence, the composite adsorbent of chitosan–CTAB–sodium bentonite clay is highly recommended for the removal of contaminated aqueous solution containing polycyclic aromatic compounds, especially naphthalene.
| S/No. | Adsorbents | Adsorption capacity (mg/g) | Reference |
|---|---|---|---|
| 1 | Chitosan beads modified with FeO and TiO nanoparticles 2 | 149.3 | Ruiz, et al. [76] |
| 2 | Chitosan hydrogel beads impregnated with surfactant | 32.39 | |
| 3 | Granular ripe orange peels | 3.8168 | Owabor and Audu [77] |
| 4 | Activated carbon prepared from bean pods | 85-300 | Cabal, et al. [78] |
| 5 | Activated carbon prepared from walnut | 74 - 118.18 | Wu, et al. [79] |
| 6 | Activated carbon prepared from rice husks | 104.5 | Yakout, et al. [80] |
| 7 | Chitin | 0.138 | |
| 8 | Chitosan | 0.112 | |
| 9 | Activated carbon prepared from coconut shell | 0.023 | |
| 10 | Activated carbon prepared from sugar cane bagasse | 0.013 | Crisafully, et al. [81] |
| 11 | Coal based activated charcoal | 36.23 | Ge, et al. [82] |
| 12 | AG-5 carbon | 20.52-24.57 | Puszkarewilz and Kaleta [83] |
| 13 | DTO carbon | 30.28-48.27 | |
| 14 | Clinoptilolite | 0.89-1.05 | |
| 15 | Humic modified Ca-bentonite clay (HB) | 0.00461 | Unuabonah, et al. [84] |
| 16 | Sodium dodecyl sulfate modified Ca-bentonite clay (SB) | 0.00176 | |
| 17 | Carica papaya and Ca-bentonite composite ( HYCA) | 0.00858 | |
| 18 | Micro wave assisted starch derived carbon (HMAC) | 160.7 | Liu, et al. [85] |
| 19 | Anthracite coal activated carbon (ACAC) | 165.67 | Liu, et al. [86] |
| 20 | Bituminous coal activated carbon (BCAC) | 161.21 | |
| 21 | Long flame coal activated carbon (LCAC) | 147.1 | |
| 22 | Zinc sulfide-activated carbon composite | 142.68 | Ghaedi, et al. [46] |
| 23 | Chitosan-CTAB-bentonite clay | 250.16 | This article |
Table 8: Comparison of adsorption capacity of some adsorbents for the adsorption of naphthalene (temperature = 298–303K).
Conclusion
The composite nanoparticles of chitosan– cetyltrimethylammonium bromide (CTAB)–sodium bentonite clay were synthesized and characterized using analytical techniques of energy dispersive X-ray spectroscopy (EDX), scanning electron microscopy (SEM), Fourier transform infrared (FTIR) spectroscopy, X-ray fluorescence (XRF) and X-ray diffraction (XRD). The characterization results apprised of the good potential of bentonite clay modified with surfactant CTAB impregnated with chitosan flakes as adsorbent for the treatment of aqueous solution contaminated with polycyclic aromatic hydrocarbons, especially naphthalene. The modeling and optimization studies of the adsorption of naphthalene on the prepared composite adsorbent aver that the predicted ANN models can be applied in modeling the adsorption process and the hybrid of ANN and genetic algorithm can be used to determine the optimum conditions of the process. Conclusively, the prepared adsorbent in this study is a viable alternative adsorbent for the treatment of industrial wastewater containing naphthalene.
Statements and Declarations
Funding
Not applicable. So, the authors hereby declare that no specific funds, grants, or other support from funding agencies in the public, commercial or non-profit sector, were received during the preparation and submission of this work.
Compliance with Ethical Standards
Conflict of Interest
On behalf of the other authors, the corresponding author states that there is no conflict of interest that is directly or indirectly related to this work within the last 3 years of commencement of the work to the period of submitting it.
References
-
Darajeh N, Alizadeh H, Farraji H, Park J, Barghi A, et al. (2020) Removal of Polycyclic Aromatic Hydrocarbon (PAHs) by Different Physicochemical Methods; A Mini- Review. Journal of Energy and Environmental Pollution 1(2): 44-50.
-
Patel AB, Shaikas S, Jain KR, Desai C, Madamwar D, et al. (2020) Polycyclic Aromatic Hydrocarbons: Sources, Toxicity and Remediation Approaches. Frontiers in Microbiology 11: 1-23.
-
Saeed T, Naeem A, Mahmood T, Khan NH (2019) Preparation of Nano-particles and Their Applications in Adsorption. In: Fayaz A, et al. (Eds.), Engineered Nanomaterials, Health and Safety. IntechOpen, pp: 1-15.
-
Dias JM, Alvim-Ferraz MCM, Almeida MF, Rivera-Utrilla J, Sánchez-Polo M, et al. (2007) Waste Materials for Activated Carbon Preparation and its Use in Aqueous- Phase Treatment: A Review. Journal of Environmental Management 85(4): 833-846.
-
Soleimami M, Kaghazchi T (2007) Agricultural Waste Conversion to Activated Carbon by Chemical Activation with Phosphoric Acid. Chemical Engineering Technology 30(5): 649-654.
-
Khali HPSA, Jawaid M, Firoozians P, Rashid U, Islam A, et al. (2013) Activated Carbon from Various Agricultural Wastes by Chemical Activation with KOH: Preparation and Characterization. Journal of Biodiesel Materials and Bioenergy 7(6): 1-7.
-
Auta M, Hameed BH (2014) Chitosan-Clay Composite as Highly Effective and Low-Cost Adsorbent for Batch and Fixed-Bed Adsorption of Methylene Blue. Chemical Engineering Journal 237: 352-361.
-
Ratan JK, Kaur M, Adiraju B (2018) Synthesis of Activated Agricultural Waste using A Simple Method: Characterization, Parametric and Isotherm Study. Materials Today: Proceedings 5(2): 3334-3345.
-
Blachnio M, Marczewska AD, Charmas B, Strzaika MZ, Bogatyrov V, et al. (2020) Activated Carbon from Agricultural Wastes for Adsorption of Organic Pollutants. Molecules 25(21): 5105.
-
Kyzas GZ, Bilikiaris DN, Mitropoulos AC (2017) Chitosan Adsorbents for Dye Removal: A Review. Society of Chemical Industry 66(12): 1800-1811.
-
Zhang J, Xia W, Liu P, Cheng Q, Tahi T, et al. (2010) Chitosan Modification and Pharmaceutical/Biomedical Applications. Marine Drugs 8(7): 1962-1987.
-
Lizardi-Mendoza J, Monal AWM, Valencia GFM (2016) Chemical Characteristics and Functional Properties of Chitosan. In: Romanazzi G, et al. (Eds.), Chitosan in the Preservation of Agricultural Commodities, México, pp: 3-31.
-
Eddya M, Tbibs B, El-Hami K (2020) A Comparison of Chitosan Properties after Extraction from Shrimps Shells by Diluted and Concentrated Acids. Heliyon 6(2): 1-17.
-
Vlacha M, Giannakas A, Katapodis P, Stamatis H, Ladavos A, et al. (2016) On the Efficiency of Oleic Acid as Plasticizer of Chitosan/Clay Nanocomposites and Its Role on Thermo-Mechanical, Barrier and Antimicrobial Properties – Comparison with Glycerol. Food Hydrocolloids 57: 10-19.
-
Lionzo MIZ, Dressler AC, Mertins O, Pohlmann AR, Silveira NP, et al. (2011) Chitosan as Stabilizer and Carrier of Natural Based Nanostructures. In: Beck R, et al. (Eds.), Nanocosmetics and Nanomedicines, Brazil, pp: 163-177.
-
Duan C, Meng X, Meng J, Khan MIH, Dai L, et al. (2019) Chitosan as A Preservative for Fruits and Vegetables: A Review on Chemistry and Antimicrobial Properties. J Bioresources and Bioproducts 4(1): 11-21.
-
Li J, Cai C, Sun T, Wang L, Wu H, et al. (2018) Chitosan- Based Nanomaterials for Drug Delivery. Molecules 23(10): 2661-2686.
-
Chiou SH, Wu WT, Huang YY (2001) Effects of the Characteristics of Chitosan on Controlling Drug Release of Chitosan Coated PLLA Microspheres. Journal of Microencapsulation 18(5): 613-625.
-
Cheung R, Ng T, Wong J, Chan W (2015) Chitosan: An Update on Potential Biomedical and Pharmaceutical Applications. Marine Drugs 13(8): 5156-5186.
-
Thany ZW, Ridha AM (2018) Use of Chitosan Impregnated Bentonite as an Adsorbent for Remediation of Oil Spill from Aqueous Solution. International Journal of Engineering and Technology 7(4): 4380-4387.
-
Oliveira CIR, Rocha MCG, Silva ALN, Bertolino LC (2016) Characterization of Bentonite Clays from Cubati, Paraiba (Northeast of Brazil). Ceramica 62(343): 272-277.
-
Shah LA, Khattak NS, Valenzuela MGS, Manan A, Diaz FRV, et al. (2013) Preparation and Characterization of Purified Na-Activated Bentonite from Karak (Pakistan) for Pharmaceutical Use. Clay Minerals 48(4): 595-603.
-
Miyoshi Y, Tsukimura K, Morimoto K, Suzuki M, Takagi T, et al. (2018) Comparison of Methylene Blue Adsorption on Bentonite Measured using the Spot and Colorimetric Methods. Applied Clay Science 151: 140-147.
-
Mockovčiaková A, Orolínová Z (2009) Adsorption Properties of Modified Bentonite Clay. Chemine Technologija 50: 47-50.
-
Jović-Jovičić N, Milutinovic-Nikolic A, Banković P, Dojčtnović B, Nedic B, et al. (2010) Synthesis, Characterization and Adsorptive Properties of Organo Bentonites. Acta Physica Polonica A 117(5): 849-854.
-
Anirudhan TS, Ramachandran M (2015) Adsorption Removal of Basic Dyes from Aqueous Solutions by Surfactants Modified Bentonite Clay (Organo Clay): Kinetic and Competitive Adsorption Isotherm. Process Safety and Environmental Protection 95: 215-225.
-
Karaca S, Gürses A, Edjer Korucu M (2013) Investigation of the Orientation of CTA+ Ions in the Interlayer of CTAB Pillared Montmorillonite. Journal of Chemistry pp: 1-10.
-
Ombaka O (2016) Characterization and Classification of Clay Minerals for Potential Applications in Rugi Ward, Kenya**.** African Journal of Environmental Science and Technology 10: 415-431.
-
Rihayat T, Satriananda S, Riskina S, Syahputra W, Mawaddah N, et al. (2019) Formulation of Polyurethane with Bentonite-Chitosan as Filler Applied to Carbon Steel as an Antibacterial and Environmentally Friendly Paint. International Conference on Science and Innovated Engineering (I-COSINE)-Materials Science and Engineering 536: 1-9.
-
Altun T (2020) Preparation and Application of Glutaraldehyde Cross-Linked Chitosan Coated Bentonite Clay Captures: Chromium (VI) Removal from Aqueous Solution. Journal of the Chilean Chemical Society 65(2): 4790-4797.
-
Samiey B, Cheng CH, Wu J (2014) Organic-Inorganic Hybrid Polymers as Adsorbents for Removal of Heavy Metals Ions from Solution: A Review. Materials 7(2): 673-726.
-
Pandey P, De N (2018) Surfactant-Induced Changes in Physicochemical Characters of Bentonite Clay. International Research Journal of Pure and Applied Chemistry 15(4): 1-11.
-
Rittirong K, Uasopon S, Prachayawasin P, Euaphantasate N, Aiempanakit K, et al. (2015) CTAB as a Soft Template for Modified Clay as Filler in Active Packaging. Data in Brief 3: 47-50.
-
Teofilović V, Pavličević J, Bera O, Jovičić M, Simendić JB, et al. (2014) The preparation and thermal properties of chitosan/bentonite composite beads. Hemijska Industrija 68(6): 653-659.
-
Zohra B, Aicha K, Fatima S, Nourredine B, Zoubir D, et al. (2008) Adsorption of Direct Red 2 on Bentonite Modified by Cetyltrimethylammonium Bromide. Chemical Engineering Journal 136(2-3): 295-305.
-
Aminabad MS, Maleki A, Hadi M (2014) Application of Artificial Neural Network (ANN) for the Prediction of Water Treatment Plant Influent Characteristics. Journal of Advances in Environmental Health Research 1(2): 2-13.
-
Baxter SJ, Stanley QZ, Smith DW (2002) Developing Artificial Neural Network Models of Water Treatment Processes: A Guide for Utility. Journal of Environmental Engineering and Science 1(3): 201-211.
-
Abdolrasol MGM, Hussain SMS, Ustun TS, Sarker MR, Hannan MA, et al. (2012) Artificial Neural Networks Based Optimization Techniques: A Review. Electronics 10(21): 1-43.
-
Kumari JR (2016) Optimization Techniques – A Review. International Journal of Engineering Research and Applications 6(11): 1-5.
-
Venter G (2010) Review of Optimization Techniques. In: Blockley R, et al. (Eds.), Encyclopedia of Aerospace Engineering. John Wiley and Sons, pp: 1-13.
-
Olafadehan OA, Bello VE, Amoo KO (2022) Production and Characterization of Composite Nanoparticles Derived from Chitosan, CTAB and Bentonite Clay. Chemical Papers 76: 5063-5086.
-
Mourabet M, Rhilassi A, Ziatni MB, Taitai A (2014) Comparative Study of Artificial Neural Network and Response Surface Methodology for Modelling and Optimization of the Adsorption capacity of Fluoride onto Apatitic Tricalcium Phosphate. Universal Journal of Applied Mathematics 2(2): 84-91.
-
Bayuo J, Abukari MA, Pelig-Ba KB (2020) Optimization using Central Composite Design (CCD) of Response Surface Methodology (RSM) for Biosorption of Hexavalent Chromium from Aqueous Media. Applied Water Science 10: 1-12.
-
Vassiliadis S, Rangoussi M, Cay A, Provalidis C (2010) Artificial Neural Networks and Their Applications in the Engineering of Fabrics. In: Dubrovski PD, et al. (Eds.), Woven Fabric Engineering, pp: 111-134.
-
Chang YT, Lin J, Shieh JS, Abbod MF (2012) Optimization of the Initial Weights of Artificial Neural Networks via Genetic Algorithm Applied to Hip Bone Fracture Prediction. Advances in Fuzzy Systems pp: 1-10.
-
Ghaedi M, Daneshyar A, Asfaram A, Purkait MK (2016) Adsorption of Naphthalene onto High-Surface- Area Nanoparticle Loaded Activated Carbon by High Performance Liquid Chromatography: Response Surface Methodology, Isotherm and Kinetic Study. RSC Advances 6(59): 54322–54330.
-
Itodo AU, Abdulrahman FW, Hassan LG, Maigandi SA, Itodo HU, et al. (2010) Application of Methylene Blue and Iodine Adsorption in the Measurement of Specific Surface Area by Four Acid and Salt Treated Activated Carbons. New York Science Journal 3(5): 1-9.
-
Yukselen Y, Kaya A (2008) Suitability of the Methylene Blue Test for Surface Test for Surface Area, Cation Exchange Capacity and Swell Potential Determination of clayey soils. Engineering Geology 102(1-2): 38-45.
-
Thakur G, Singh A, Singh I (2015) Chitosan- Montmorillonite Polymer Composites: Formulation and Evaluation of Sustained Release Tablets of Aceclofenac. Scientia Pharmaceutica 84(4): 603-617.
-
Rihayat T, Salim S, Arlina A, Fona Z, Jalal R, et al. (2018) Determination of CEC Value (Cation Exchange Capacity) of Bentonites from North Aceh and Bener Meriah, Aceh Province, Indonesia using Three Methods. IOP Conference Series: Materials Science and Engineering 334: 012054.
-
Kausar A, Naeem K, Hussain T, Nazli ZIH, Bhatti HN, et al. (2019) Preparation and Characterization of Chitosan/ Clay Composites for Direct Rose FRN Dye Removal from Aqueous Media: Comparison of Linear and Nonlinear Regression Methods. Journal of Materials Research and Technology 8(1): 1161-1174.
-
Hu Z, Srinivasan MP, Ni Y (2000) Preparation of Mesoporous High-Surface-Area Activated Carbon. Advanced Materials 12: 62-65.
-
Scherdel C, Reichenauer G, Wiener M (2010) Relationship Between Pore Volumes and Surface Areas Derived from the Evaluation of N2-sorption data by DR-, BET- and t-plot, Microporous and Mesoporous Materials 132(3): 572-575.
-
Kumar A, Jena HM (2016) Preparation and Characterization of High Surface Area Activated Carbon from Fox Nut (Euryale ferox) Shell by Chemical Activation with H3PO4. Results in Physis 6: 651-658.
-
Kashif M, Cao Y, Yuan G, Asif M, Javed K, et al. (2019) Pore Size Distribution, Their Geometry and Connectivity in Deeply Buried Paleogene Es1 Sandstone Reservoir, Nanpu Sag, East China. Petroleum Science 16: 981-1000.
-
Kumari P, Alam M, Siddiqi WA (2019) Usage of Nanoparticles as Adsorbents for Waste Water Treatment: An Emerging Trend. Sustainable Materials and Technologies 22: 1-14.
-
Luiz T, Finglas PM (1993) The Encyclopedia of Food Sciences and Nutrition. 2nd (Edn.), Academic Press, pp: 155.
-
Baba M, Kowaka Y, Nagashima U, Ishimoto T, Goto H, et al. (2011) Geometrical Structure of Benzene and Naphthalene: Ultrahigh-Resolution Laser Spectroscopy and Ab initio-Calculation. The Journal of Chemical Physics 135(5): 054305.
-
Peeters E, Cami J (2011) polycyclic aromatic hydrocarbons. In: Gargaud M. et al. (Eds.), Encyclopedia of Astrobiology. Springer, Berlin, Germany, pp: 105-140.
-
Schwanke AJ, Balzer R, Pergher S (2017) Microporous and Mesoporous Materials from Natural and Inexpensive Sources. Handbook of Ecomaterials, pp: 1-22.
-
Chikwe TN, Ewuzie HE, Ngobiri NC, Okoye IP (2018) Competitive Adsorption of Xylene and Toluene on Modified and Unmodified Magnesium Exchanged Bentonite Clay Mineral. Journal of Applied Sciences and Environmental Management 22(3): 298-303.
-
Hussein MZ, Yarmo MA, Rahman MZH, Zainal Z, Liang AAS, et al. (2001) Texture and Microstructure of Chitosan- Treated Bentonite and Its Calcined Products. Malaysian Journal of Analytical Sciences 7(1): 35-40.
-
Wawrzynczak A, Marchel BM (2019) Application of the Artificial Neural Network in the forecasting of the Airborne Contaminant. Journal of Physics 1391: 1-10.
-
Chittoo BS, Sutherland C (2019) Adsorption using Lime- Iron Sludge–Encapsulated Calcium Alginate Beads for Phosphate Recovery with ANN- and RSM-Optimized Encapsulation. Journal of Environmental Engineering 145(5): 04019019.
-
Shahryari Z, Sharifi A, Mohebbi A (2013) Artificial Neural Network (ANN) Approach for Modeling and Formulation of Phenol Adsorption onto Activated Carbon. Journal of Engineering Thermophysics 22(4): 322-336.
-
Kumar RV, Moorthy IG, Pugazhenthi G (2015) Modeling and Optimization of Critical Parameters by Hybrid RSM- GA for the Separation of BSA using Tubular Configured MFI-Type Zeolite Microfiltration Membrane. RSC Advances 106: 1-44.
-
Bello VE, Olafadehan OA (2021) Comparative Investigation of RSM and ANN for Multi-Response Modeling and Optimization Studies of Derived Chitosan from Archachatina marginata Shell. Alexandria Journal of Engineering 60(4): 3869-3899.
-
Awolusi TF, Oke OL, Akinkurolere OO, Atoyebi OD (2019) Comparison of Response Surface Methodology and Hybrid-Training Approach of Artificial Neural Network in Modelling the Properties of Concrete Containing Steel Fibre Extracted from Waste Tires. Cogent Engineering 6: 1-19.
-
Ram Talib NS, Halmi MIE, Abd-Ghani SS, Zaidan UH, Shukor MYA (2019) Artificial Neural Networks (ANNs) and Response Surface Methodology (RSM) Approach for Modelling the Optimization of Chromium (VI) Reduction by Newly Isolated Acinetobacter Radioresistens Strain NS-MIE from Agricultural Soil. BioMed Research International 2019(1): 1-14.
-
Igwegbe CA, Mohmmadi L, Ahmadi S, Rahdar A, Khadkhodaiy D, et al. (2019) Modeling of Adsorption of Methylene Blue Dye on Ho-CaWO4 Nanoparticles using Response Surface Methodology (RSM) and Artificial Neural Network (ANN) Techniques. Methods 6: 1779- 1797.
-
Yaseen ZM, Ebtehaj I, Kim S, Sanikham H, Asadi H, et al. (2019) Novel Hybrid Data-Intelligence Model for Forecasting Monthly Rainfall with Uncertainty Analysis. Water 11: 1-23.
-
Olafadehan OA (2021) Fundamentals of Adsorption Processes. Lambert Academic Publishing, OmniScriptum, India, pp: 508.
-
Shahbeig H, Bagheri N, Ghorbanian SA, Hallajisani A, Poorkarimi S, et al. (2013) A New Adsorption Isotherm Model of Aqueous Solutions on Granular Activated carbon. World Journal of Modelling and Simulation 9: 243-254.
-
Marey S, Aboukarima A, Almajhadi Y (2020) Predicting the Performance Parameters of Chisel Plow using Neural Network Model. Engenharia Agrícola Jaboticabal 40(6): 719-731.
-
Kalathinga MSH, Basak S, Mitra J (2019) Artificial Neural Network Modelling and Genetic Algorithm Optimization of Process Parameters in Fluidized Bed Drying of Green Tea Leaves. Journal of Food Process Engineering 43(1): 1-7.
-
Ruiz DAPS, Ávila GD, Suesca CA, Delgado ADG, Herrera A, et al. (2020) Ionic Cross-Linking Fabrication of Chitosan- Based Beads Modified with FeO and TiO2 Nanoparticles: Adsorption Mechanism Toward Naphthalene Removal in Seawater from Cartagena Bay Area. American Chemical Society Omega 5(41): 26463-26475.
-
Owabor CN, Audu JE (2010) Studies on the Adsorption of Naphthalene and Pyrene from Aqueous Medium using Ripe Orange Peels as Adsorbent. Global Journal of Pure and Applied Science 16(1): 131-139.
-
Cabal B, Budinova T, Ania CO, Tsyntsarski B, Parra JB, et al. (2009) Adsorption of Naphthalene from Aqueous Solution on Activated Carbons Obtained from Bean Pods. Journal of Hazardous Materials 161(2-3): 1150-1156.
-
Wu Z, Sun Z, Liu P, Li Q, Yang R, et al. (2020) Competitive Adsorption of Naphthalene and Phenanthrene on Walnut Shell Based Activated Carbon and the Verification via Theoretical Calculation. RSC Advances 10: 10703-10714.
-
Yakout SM, Daifullah AM, El-Reefy SA (2013) Adsorption of Naphthalene, Phenanthrene and Pyrene from Aqueous Solution using Low Cost Activated Carbon Derived from Agricultural Wastes. Adsorption Science & Technology 31(4): 293-302.
-
Crisafully R, Milhome MAL, Cavalcante RM, Silveira ER, Nascimento RF, et al. (2008) Removal of Some Polycyclic Aromatic Hydrocarbons from Petrochemical Wastewater using Low-Cost Adsorbents of Natural Origin. Bioresource Technology 99(10): 4515-4519.
-
Ge X, Tian F, Wu Z, Yan Y, Cravotto G, et al. (2015) Adsorption of Naphthalene from Aqueous Solution on Coal-Based Activated Carbon Modified by Microwave Induction: Microwave Power Effects. Chemical Engineering and Processing: Process Intensification 91: 67-77.
-
Puszkarewicz A, Kaleta J (2020) The Efficiency of the Removal of Naphthalene from Aqueous Solutions by Different Adsorbents. International Journal of Environmental Research and Public Health 17(16): 5969.
-
Unuabonah I, Olu-Owolabi EI, Böhm LB, Düring RA (2017) Adsorption of Polynuclear Aromatic Hydrocarbons from Aqueous Solution: Agrowaste-Modified Kaolinite vs Surfactant Modified Bentonite. Bulletin of the Chemical Society of Ethiopia 30(3): 369-376.
-
Liu P, Wu Z, Ge X, Yang X (2019) Hydrothermal Synthesis and Microwave-Assisted Activation of Starch-Derived Carbons as an Effective Adsorbent for Naphthalene Removal. RSC Advances 9(21): 11696-11706.
-
Liu D, Wu Z, Ge X, Cravotto G, Wu Z, et al. (2016) Comparative Study of Naphthalene Adsorption on Activated Carbon Prepared by Microwave-Assisted Synthesis from Different Typical Coals in Xinjiang. Journal of the Taiwan Institute of Chemical Engineers 59: 563-568.
- Nigeria’s Vulnerability in the Face of Global Energy Policy
- A Simulation Study of Investigation of Optimum Oil Production Performance by Applying Various Gas Injection Methods in Oil Reservoir
- Characterization of Permo-Triassic Reservoirs through Thermal Maturity Assessment of Westphalian Source Rocks in the Cheshire Basin
- Influence of Microwax on the Rheological and Thermal Behaviour of a Wax Crude Oil
- Real-Time Monitoring and Performance Optimization of Steam Injection in Heavy Oil Reservoirs Using Fiber Optic Sensing and Integrated Predictive Simulation Models
- Rapid On-Site Determination of the Total Petroleum Hydrocarbon Content of Soils by Handheld Fourier Transform Near-Infrared Spectroscopy: Development of a Global, Site- and Scanner- Independent Calibration Model