Improving the Accuracy of Experimental Hydrate Equilibrium Point Determination: A Mini-Review
Reliable gas hydrate equilibrium data is necessary to assess the severity of hydrate problems in the oil and gas industry and successfully implement the benefit of hydrate technologies in different areas such as hydrate-based CO2 capture and storage. Furthermore, the hydrate equilibrium point prediction models rely on tuning experimental data. In this mini-review, various techniques for hydrate dissociation point (DP) measurement either in the presence or absence of liquid water phase are discussed to improve the accuracy of the measurement. While both Visual and non-visual techniques can be used to measure hydrate DP, the non-visual isochore procedure is the most common technique. The stepwise heating procedure for hydrate dissociation to measure the DP is recommended due to its ability to improve accuracy and save time. However, it is essential to exercise caution during the data interpretation to avoid measuring inaccurate DP. In particular, considering the dissociation of various hydrate structures is crucial to enhance the accuracy of DP determination when employing non-visual techniques.
Introduction
Accurate experimental data on hydrate dissociation point measurement remains crucial for the development of reliable thermodynamic models [1] and machine learning approaches [2] for predicting the hydrate equilibrium point. While significant progress has been made in these predictive methods, their effectiveness heavily relies on the availability of precise experimental data. Therefore, conducting precise and reliable measurements of hydrate equilibrium points is important in advancing our understanding and modelling of hydrate behaviour. These measurements serve as a foundation for enhancing the accuracy of predictive models and they are crucial for industries involved in gas and oil exploration and production to improve efficiency and safety in hydrate-related applications such as carbon capture and storage using hydrate-based technologies.
Gas hydrates are ice-like crystalline compounds typically formed at a higher pressure and lower temperature through the physical intermolecular interactions of water and gas molecules, i.e., the gas molecules are encaged in the solid lattice of water molecules. Various hydrate structures (such as structure-I, structure-II, and structure-H) can form depending on the size of gas molecules and pressure- temperature conditions [3]. For gas hydrates to form, three essential conditions must be met: the presence of appropriate temperature and pressure conditions, the availability of a suitable-sized guest molecule (e.g., methane, ethane, carbon dioxide, etc.), and the presence of water molecules as the host molecules. These water molecules can exist in two forms: as free liquid water or in the vapour phase when a free water phase is absent. In the absence of free water phase, the hydrate equilibrium point significantly depends on water content, i.e., the hydrate phase boundary shifts to the lower temperature and higher pressure as the water content is reduced. Depending on the form of water, various techniques have been used to measure the hydrate equilibrium point which are discussed in this mini-review paper.
Hydrate formation conditions depend on several factors, including the rate of cooling, degree of subcooling, hydrate history, presence of foreign materials, and mixing rate. Therefore, the hydrate formation point may not be predictable or replicable. In contrast, the hydrate dissociation point is replicable and represents a thermodynamic equilibrium state, i.e., it is used to measure the hydrate equilibrium point. While a significant amount of published data exists on hydrate dissociation points, there can be some disagreement among the reported values. The difference in reported dissociation points can be due to several factors, including experimental techniques, measurement methods, data interpretation, amount of water/gas, etc. In this mini-review paper, various techniques for measuring hydrate dissociation points have been discussed to improve the accuracy of measurement.
Hydrate Equilibrium Point in the Presence of Liquid Water
Pressure, Temperature and Volume Analysis
Visual observation and nonvisual (through data analysis) techniques could be used to experimentally measure the hydrate equilibrium point when the free liquid water phase is present in the system. Isochoric [4], isothermal [5], and Isobaric [6] are three procedures that could be used (either for visual or nonvisual technique) to determine the hydrate equilibrium point.
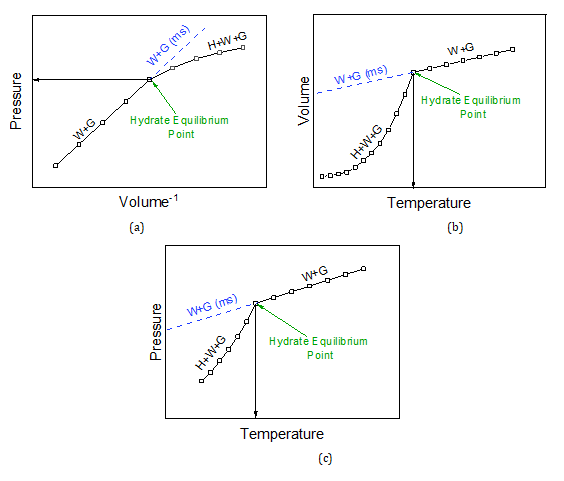
In the isothermal procedure, hydrates are formed by increasing the pressure and dissociated by decreasing the pressure. This cyclic process allows for the study of hydrate formation and dissociation under constant temperature conditions, i.e., to analyse hydrate stability and equilibrium point. A variable volume cell allows to change in the cell pressure and to measure hydrate equilibrium pressure at constant temperature [7]. It has been suggested that the corresponding equilibrium time in the isothermal procedure is faster than isochoric equipment [7]. In this procedure, the cell is compressed to reach a sufficiently high pressure for hydrate formation. Following this, the cell volume is gradually expanded to decrease the pressure, allowing for either visual inspection of hydrate dissociation or interpretation of data (graphical analysis). The pressure-volume-1 diagram can be used for the graphical analysis as illustrated in Figure 1a. Starting from high pressure where hydrates are present, increasing the cell volume reduces the pressure inside the cell, leading to the dissociation of the hydrate. Thus, the slope of the line is not straight. In contrast, when all hydrates are dissociated, the slope of the line becomes nearly straight. This point, where the slope changes, can be recognized as the hydrate equilibrium pressure.
A similar approach can be used to determine the hydrate equilibrium point in the isobaric experiment under constant pressure either through visual inspection or data interpretation. After the formation of hydrates at low temperatures, heat is applied to the system to raise the temperature and induce hydrate dissociation, i.e., a corresponding volume change indicates hydrate dissociation. Meanwhile, the cell volume is expanded to maintain constant pressure within the system. The volume versus temperature plot could be used to determine the hydrate equilibrium point as shown in Figure 1b. A constant heating rate could be applied in this procedure. However, a high heating rate can result in inaccurate predictions of hydrate equilibrium [8].
The isochoric procedure, which is a constant volume process, is the most common procedure to determine hydrate equilibrium points. This method is widely used because it only requires a non-variable volume cell for conducting experiments. In this method, the hydrates are initially formed at low temperatures, and then heat is applied to the system to raise the temperature and induce hydrate dissociation under constant volume. In addition to the visual method, the interpretation of the pressure-temperature plot could be used to determine the hydrate equilibrium point, as shown in Figure 1c.
The choice of procedure for measuring the hydrate equilibrium point is generally considered to have a minimal impact. However, it should be noted that the heating rate (in the isobaric and isochoric methods) can have a significant influence on the accuracy of hydrate equilibrium predictions. In other words, the rate at which heat is applied during the experiment can greatly affect the resulting equilibrium conditions of the hydrate phase. Numerous studies have investigated the effect of heating rate on hydrate equilibrium temperature [8, 9]. A heating rate of up to 0.5°C/hour has been found to yield accurate predictions of hydrate equilibrium for single gas components, such as methane. However, in the case of a multicomponent gas system or when hydrate inhibitors or salts are present in the system, a much lower heating rate (e.g., <0.06°C/hour) is necessary to accurately determine the hydrate equilibrium point. It has been pointed out that the presence of kinetic hydrate inhibitors, such as PVCap, increases the energy required for hydrate dissociation [10]. Slow dissociation of hydrate outside the hydrate stability zone [11] and KHI-Induced dissociation of gas hydrates inside the hydrate stability zone [12, 13, 14] in the presence of KHIs have been also reported.
Efficient mixing is essential for obtaining a reliable hydrate equilibrium point, i.e., insufficient mixing can result in isolated hydrates from other phases. Isolated hydrates, being more stable and requiring a longer time to reach equilibrium, can introduce variations in the heating trend and potentially lead to the identification of incorrect equilibrium points [15]. Therefore, ensuring efficient mixing in the design of the experimental setup is crucial to obtain accurate results. The stirring rpm effect on high-pressure gas hydrate autoclave has been also investigated [16].
While continuous heating in the isobaric and isochoric methods is a time-consuming process due to the requirement of applying a low heating rate, a step heating method in non- visual techniques has been proposed as an efficient approach to accurately measure the hydrate equilibrium point, providing significant time savings [15]. In this technique, the hydrate equilibrium point can be determined by the intersection of heating/cooling curves which are obtained by measuring a few equilibrium points through the step heating process instead of continuous measurement. For example, as shown in Figure 2, the final hydrate dissociation point (DPfinal) could be measured as a hydrate equilibrium point by the intersection of step-heating data trends and cooling line (W+G: no hydrate line) in the isochoric procedure. Figure 2 shows the actual experimental equilibrium step-heating trends for 98% C1 + 2% C2 and 85% C1 + 12% C2 +3% C3 in the isochoric experiment. As these trends show, different hydrate dissociation points could be identified through the isochoric interpretation of equilibrium step-heating trends. For example, when performing interpolation across DP1 in Figure 2a and DP3 in Figure 2b, it can lead to the identification of an incorrect final dissociation point. Therefore, it is crucial to exercise caution when selecting the step temperature interval and performing interpolation, especially when determining the final dissociation point.
The different equilibrium step-heating trends have been investigated for various multicomponent gas systems [17, 18, 19]. The observed clear changes in the slope of the heating curves (Figure 2) are speculated to be associated with the dissociation of different hydrate structures, i.e., various hydrate structures/phases are potentially formed instead of simple sII hydrate in the multi-component gas system [17]. Furthermore, the gas composition during hydrate formation changes due to the selective incorporation of certain gas molecules into the gas hydrate structure may result in different slopes in heating curves. The duration needed to reach equilibrium at each dissociation point in the step heating method may also depend on some factors including the amount of water and gas composition, e.g., five hours time step may not be sufficient to reach equilibrium [20]. Therefore, it is important to properly analyse the step heating curves to measure accurate dissociation points (e.g., to see if the equilibrium is achieved at each step heating).
![Figure 2: Equilibrium step-heating trends with the isochoric interpretation applied to determine the dissociation points (DP) for (a) 98% C1 + 2% C2, and (b) 85% C1 + 12% C2 +3% C3. The Black dashed line is the hydrate phase boundary predicted by PVTsim. W= water, G=gas, H=hydrate, W+H(ms)=metastable cooling line. The experimental data are obtained from the previously published work [17].](/fulltextimages/10593/fig_2.png)
Figure 2: Equilibrium step-heating trends with the isochoric interpretation applied to determine the dissociation points (DP) for (a) 98% C1 + 2% C2, and (b) 85% C1 + 12% C2 +3% C3. The Black dashed line is the hydrate phase boundary predicted by PVTsim. W= water, G=gas, H=hydrate, W+H(ms)=metastable cooling line. The experimental data are obtained from the previously published work [17].
Beyond Conventional Methods: Alternative Analyses
In addition to visual technique and non-visual analysis through pressure, temperature, and volume analysis, some other techniques including differential scanning calorimeter (DSC) [21, 22] and spectroscopic techniques such as micro- Raman spectroscopy [23, 24] can be used to measure hydrate equilibrium point.
The heat flow analysing measured by DSC can be used to determine hydrate equilibrium points. A typical example of heat flow and temperature curves in the stepwise temperature increments is shown in Figure 3. Hydrate dissociation is an endothermic process and could result in ice formation [25, 26]. Therefore, following hydrate formation, dissociation is considered complete when temperature changes (stepwise incremental temperature) result in a heat response that is within the range of the sensible heat of the sample, i.e., returning to the baseline as shown in Figure 3. It has been noted that while both the conventional methods (e.g., pressure-temperature analysing technique in constant volume experiment) and DSC stepping procedure are time- consuming, the DSC stepping method requires significantly less sample [21]. High-pressure DCS techniques offer an alternative approach to accurately determine the hydrate equilibrium point, especially for complex mixtures such as those containing drilling fluid [22].
Raman spectroscopy, when coupled with a high-pressure cell, offers a valuable approach for measuring the hydrate equilibrium point [27]. This technique not only provides molecular-level evidence of hydrate dissociation but also enables the determination of macroscopic temperature and pressure conditions associated with the equilibrium state. By employing Raman spectroscopy, researchers can gain both microscopic and macroscopic insights into the hydrate system, enhancing the understanding of its equilibrium behaviour. A microfluidic device coupled with micro-Raman spectroscopy was also used to identify the hydrate phase boundary, i.e., it provides the advantage of combining visual observation with phase transition confirmation through Raman spectroscopy [23]. It was also noted that the microfluidic device enables rapid reaction times for hydrate dissociation and formation processes. The dissociation of gas hydrate could also be monitored using infrared-attenuated total reflection (IR-ATR) spectroscopic [28]. The dissociation of gas hydrate can also be investigated using other spectroscopic techniques such as nuclear magnetic resonance (NMR), Diffraction methods (e.g., neutron and X-ray), and infrared spectroscopic. However, these techniques are mainly used for studying the structure, composition, cage occupancy, formation, and dissociation of gas hydrates. Various spectroscopic techniques have been reviewed elsewhere [29].
![Figure 3: Hydrate dissociation is an endothermic process and could result in ice formation [25,26]. Therefore, following hydrate formation, dissociation is considered complete when temperature changes (stepwise incremental temperature) result in a heat response that is within the range of the sensible heat of the sample, i.e., returning to the baseline as shown in Figure 3. It has been noted that while both the conventional methods (e.g., pressure-temperature analysing technique in constant volume experiment) and DSC stepping procedure are time- consuming, the DSC stepping method requires significantly less sample [21]. High-pressure DCS techniques offer an alternative approach to accurately determine the hydrate equilibrium point, especially for complex mixtures such as those containing drilling fluid [22].](/fulltextimages/10593/fig_3.png)
Hydrate Equilibrium Point in the Absence of Liquid Water
It is also possible to form hydrates in the absence of liquid water when water molecules are present in the gas or non- aqueous liquid phase (e.g., hydrocarbon phase). However, the hydrate dissociation point is highly influenced by the water content, i.e., the hydrate equilibrium temperature significantly reduces with water content at a particular pressure. Water content measurement in the isobaric procedure could be used as a technique to determine hydrate dissociation point, i.e., the Karl Fischer coulometer could be used to measure water content [30, 31]. In this technique, a minimal amount of water is employed to avoid the presence of liquid water at a specific water content. As shown in the cooling line in Figure 4, the system is initially stepwise cooled down from outside the hydrate phase region to determine the water content in the absence of water content. The water content stays constant in the absence of the hydrate phase The pressure is maintained constant throughout the experiment by adjusting the volume of the cell.
Afterwards, the hydrate is formed in the system by decreasing the temperature to a significantly low level. The water content is then measured in the stepwise temperature rise to determine the heating curve, i.e., water content as a function of temperature in the presence of hydrate. The water content of gas or non-aqueous liquid phase increases as more hydrate is dissociated. As shown in Figure 4, hydrate dissociation temperature at a certain pressure and water content could be determined by the intersection of cooling and heating curves.
![Figure 4: Simplified illustration of water content as a function of temperature for cooling line (no hydrate line) and heating curve (i.e., through hydrate dissociation by temperature increasing) to measure hydrate equilibrium point. W= water, G=gas, H=hydrate, DP=dissociation point. This typical example is inspired by previously published work [30].](/fulltextimages/10593/fig_4.png)
Figure 4: Simplified illustration of water content as a function of temperature for cooling line (no hydrate line) and heating curve (i.e., through hydrate dissociation by temperature increasing) to measure hydrate equilibrium point. W= water, G=gas, H=hydrate, DP=dissociation point. This typical example is inspired by previously published work [30].
Outlook of Hydrate Phase Equilibria
The interest in gas hydrates as a promising energy resource and their applications in various fields, such as carbon capture and storage, continues to increase. Although there are predictive methods/models related to the properties of systems containing hydrates, their accuracy may be limited in certain cases, especially for systems with impurities or high concentrations of CO2. Hence, there is still demand for additional experimental data on hydrate equilibrium points for various systems especially for the CO2 application. Therefore, exploring efficient and robust approaches for determining the hydrate phase boundary is crucial. For example, the method of controlled pressure drop from the bulk hydrate systems was proposed to determine the hydrate phase boundary instead of measuring of single equilibrium point [32]. In this method, hydrate dissociation is induced by opening the vent valve and the equilibrium conditions are measured along the phase boundary through automated tracking of pressure and temperature changes during hydrate dissociation [32].
Furthermore, hydrate phase equilibria in porous media need to be explored due to the application of gas hydrate in porous media such as gas hydrate reservoirs and CO2 hydrate storage in porous media. Although various methods have been used to measure hydrate phase equilibria in porous media [33, 34, 35], there is still more room for further exploration in this field. Ongoing research continues to improve measurement methods, expanding knowledge of gas hydrates, and their role in the energy transition, carbon capture and storage, and naturally occurring gas hydrates resource.
Conclusion
Various visual and nonvisual techniques are reviewed to measure an accurate gas hydrate dissociation point either in the presence or absence of a liquid water phase. While pressure, temperature, and volume analysis through the isothermal, isobar, and isochoric procedures are normally used to measure hydrate dissociation point as the conventional method, there are some other techniques such as differential scanning calorimeter and Raman spectroscopy. Water content measurement in the vapour or non-aqueous liquid phase can be also used to measure the hydrate dissociation point in the absence of liquid water.
The isochoric procedure is the most common technique through continuous or step heating procedures. While the accuracy of hydrate dissociation point measurement depends on many factors including mixing efficiency, heating rate, and amount of water, analysing of heating/cooling curves has been suggested to enhance the accuracy of hydrate dissociation point and save time. However, the presence of various hydrate structures in the multi-component gas system results in different heating curves leading to different dissociation points. Therefore, an accurate analysis of the heating curve is required as discussed in this review paper. For example, the final dissociation point is determined by a sharp and distinct change in the slope of the heating curve.
References
-
Sayani JKS, Lal B, Pedapati (2021) SR Comprehensive Review on Various Gas Hydrate Modelling Techniques: Prospects and Challenges. Arch Comput Methods Eng pp: 1-37.
-
Hosseini M, Leonenko Y (2023) A Reliable Model to Predict the Methane-Hydrate Equilibrium: An Updated Database and Machine Learning Approach. Renew Sustain Energy Rev 173: 113103.
-
Sloan ED (2003) Fundamental Principles and Applications of Natural Gas Hydrates. Nature 426: 353- 363.
-
AdisasmRo S, Frank RJ, Dandy Sloan E (1991) Hydrates of Carbon Dioxide and Methane Mixtures. J Chem Eng 36: 68-71.
-
Beltrán JG, Servio P (2008) Equilibrium Studies for the System Methane + Carbon Dioxide + Neohexane + Water. J Chem Eng Data 53(8): 1745-1749.
-
Sadeq D, Iglauer S, Lebedev M, Smith C, Barifcani A (2017) Experimental Determination of Hydrate Phase Equilibrium for Different Gas Mixtures Containing Methane, Carbon Dioxide and Nitrogen with Motor Current Measurements. J Nat Gas Sci Eng 38: 59-73.
-
Ngema PT, Nelson WM, Naidoo P, Ramjugernath D, Richon D (2014) Isothermal Method for Hydrate Studies Using a Transparent Variable Volume Cell. Rev Sci Instrum 85(4): 45123.
-
Gjertsen LH, Fadnes FH (2000) Measurements and Predictions of Hydrate Equilibrium Conditions. Ann N Y Acad Sci 912(1): 722-734.
-
Semenov AP, Medvedev VI, Gushchin PA, Yakushev VS (2015) Effect of Heating Rate on the Accuracy of Measuring Equilibrium Conditions for Methane and Argon Hydrates. Chem Eng Sci 137: 161-169.
-
Gulbrandsen AC, Svartaas TM (2017) Effect of Poly Vinyl Caprolactam Concentration on the Dissociation Temperature for Methane Hydrates. Energy & Fuels 31(8): 8505-8511.
-
Anderson R, Mozaffar H, Tohidi B (2011) Development of a Crystal Growth Inhibition Based Method for the Evaluation of Kinetic Hydrate Inhibitors. In Proceedings of the 7th International Conference on Gas Hydrates 3: 17-21.
-
Aminnaji M, Anderson R, Tohidi B (2019) Anomalous KHI-Induced Dissociation of Gas Hydrates inside the Hydrate Stability Zone: Experimental Observations & Potential Mechanisms. J Pet Sci Eng 178: 1044-1050.
-
Aminnaji M, Anderson R, Hase A, Tohidi B (2022) Can Kinetic Hydrate Inhibitors Inhibit the Growth of Pre- Formed Gas Hydrates? J Nat Gas Sci Eng 109: 104831.
-
Aminnaji M, Anderson R, Jarrahian K, Tohidi B (2022) Natural Pectin and Commercial Luvicap-Bio as Green Kinetic Hydrate Inhibitors: A Comparative Evaluation by Crystal Growth Inhibition Methods. Energy & Fuels 36(24): 14898-14906.
-
Tohidi B, Burgass RW, Danesh A, Ostergaard KK, Todd AC (2000) Improving the Accuracy of Gas Hydrate Dissociation Point Measurements. Ann N Y Acad Sci 912(1): 924-93.
-
Qureshi MF, Atilhan M, Altamash T, Aparicio S, Aminnaji M, et al. (2017) High-Pressure Gas Hydrate Autoclave Hydraulic Experiments and Scale-up Modeling on the Effect of Stirring RPM Effect. J Nat Gas Sci Eng 38: 50-58.
-
Aminnaji M, Anderson R, Tohidi B (2021) Experimental Measurement of Multiple Hydrate Structure Formation in Binary and Ternary Natural Gas Analogue Systems by Isochoric Equilibrium Methods. Energy & Fuels 35(11): 9341-9348.
-
Aminnaji M, Hase A, Crombie L (2023) Anti-Agglomerants: Study of Hydrate Structural, Gas Composition, Hydrate Amount, and Water Cut Effect. International Petroleum Technology Conference, Bangkok, Thailand.
-
Aminnaji M (2018) Inhibition and Dissociation of Gas Hydrates Using Glycols/Alcohols and Biodegradable Kinetic Hydrate Inhibitors. Doctoral dissertation, Heriot- Watt University, UK.
-
Tohidi B, Burgass RW, Danesh A, Todd AC (1994) Experimental Study on the Causes of Disagreements in Methane Hydrate Dissociation Data. Ann N Y Acad Sci 715(1): 532-534.
-
Lafond PG, Olcott KA, Dendy Sloan E, Koh CA, Sum AK (2012) Measurements of Methane Hydrate Equilibrium in Systems Inhibited with NaCl and Methanol. J Chem Thermodyn 48: 1-6.
-
Kharrat M, Dalmazzone D (2003) Experimental Determination of Stability Conditions of Methane Hydrate in Aqueous Calcium Chloride Solutions Using High Pressure Differential Scanning Calorimetry. J Chem Thermodyn 35(9): 1489-1505.
-
Wells JD, Chen W, Hartman RL, Koh CA (2021) Carbon Dioxide Hydrate in a Microfluidic Device: Phase Boundary and Crystallization Kinetics Measurements with Micro-Raman Spectroscopy. J Chem Phys 154(11).
-
Bollengier O, Choukroun M, Grasset O, Le Menn EL, Bellino G, et al. (2013) Phase Equilibria in the H2O–CO2 System between 250–330 K and 0–1.7 GPa: Stability of the CO2 Hydrates and H2O-Ice VI at CO2 Saturation. Geochim Cosmochim Acta 119: 322-339.
-
Aminnaji M, Tohidi B, Burgass R, Atilhan M (2017) Gas Hydrate Blockage Removal Using Chemical Injection in Vertical Pipes. J Nat Gas Sci Eng 40: 17-23.
-
Aminnaji M, Tohidi B, Burgass R, Atilhan M (2017) Effect of Injected Chemical Density on Hydrate Blockage Removal in Vertical Pipes: Use of MEG/MeOH Mixture to Remove Hydrate Blockage. J Nat Gas Sci Eng 45: 840-847.
-
Thieu V, Subramanian S, Colgate SO, Sloan Jr ED (2000) High-Pressure Optical Cell for Hydrate Measurements Using Raman Spectroscopy. Ann N Y Acad Sci 912(1): 983-992.
-
Dobbs GT, Luzinova Y, Mizaikoff B, Raichlin Y, Katzir A (2008) Infrared Spectroscopy for Monitoring Gas Hydrates in Aqueous Solution.
-
Rauh F, Mizaikoff B (2012) Spectroscopic Methods in Gas Hydrate Research. Anal Bioanal Chem 402(1): 163-173.
-
Chapoy A, Burgass R, Tohidi B, Alsiyabi I (2015) Hydrate and Phase Behavior Modeling in CO2-Rich Pipelines. J Chem & Eng Data 60(2): 447-453.
-
Youssef Z, Barreau A, Mougin P, Jose J, Mokbel I (2009) Measurements of Hydrate Dissociation Temperature of Methane, Ethane, and CO2 in the Absence of Any Aqueous Phase and Prediction with the Cubic plus Association Equation of State. Ind & Eng Chem Res 48(8): 4045-4050.
-
Zhang Y, Bhattacharjee G, Linga P (2021) A Robust and Highly Efficient Phase Boundary Method for Determining the Thermodynamic Equilibrium Conditions of Bulk Gas Hydrate Systems. Fluid Phase Equilib 540: 113034.
-
Li X-S, Zhang Y, Li G, Chen Z-Y, Yan K-F, et al. (2008) Gas Hydrate Equilibrium Dissociation Conditions in Porous Media Using Two Thermodynamic Approaches. J Chem Thermodyn 40(9): 1464-1474.
-
Clarke MA, Pooladi-Darvish M, Bishnoi PR (1999) A Method to Predict Equilibrium Conditions of Gas Hydrate Formation in Porous Media. Ind & Eng Chem Res 38(6): 2485-2490.
-
Østergaard KK, Anderson R, Llamedo M, Tohidi B (2002) Hydrate Phase Equilibria in Porous Media: Effect of Pore Size and Salinity. Terra Nov 14(5): 307-312.
- Nigeria’s Vulnerability in the Face of Global Energy Policy
- A Simulation Study of Investigation of Optimum Oil Production Performance by Applying Various Gas Injection Methods in Oil Reservoir
- Characterization of Permo-Triassic Reservoirs through Thermal Maturity Assessment of Westphalian Source Rocks in the Cheshire Basin
- Influence of Microwax on the Rheological and Thermal Behaviour of a Wax Crude Oil
- Real-Time Monitoring and Performance Optimization of Steam Injection in Heavy Oil Reservoirs Using Fiber Optic Sensing and Integrated Predictive Simulation Models
- Rapid On-Site Determination of the Total Petroleum Hydrocarbon Content of Soils by Handheld Fourier Transform Near-Infrared Spectroscopy: Development of a Global, Site- and Scanner- Independent Calibration Model