Study on Biochemical Profile of Improved Cattle at Various Stage of Lactation in Rupandehi District of Nepal
Objective: To determine the reference value of biochemical parameters of improved cattle of Rupandehi district of Nepal. Methodology: The sampling was done from the various commercial farm of Rupandehi district of Nepal. A total of 53 improved cattle (apparently healthy) were selected from farmers. It was cross sectional purposive sampling. Those cattle were divided into various predefined groups: 1. Dry periods (last 3 weeks of pregnancy) 2. Early lactating (calving to 3 weeks) 3. Mid lactating (2-4 months) and 4. Late lactation (after 4months). The serum analysis was done by using manually operated refractometer for total protein and Calorimeter with the available reagent in the market for all other parameter. Statistical analysis was done by using SPSS-20 using one way ANOVA. The data was presented as mean±standard error (SE). Result: Total protein was significantly different (P
Introduction
Background
Cattle have been reared in Nepal throughout the history and are the primary source of milk and carry the religious values as well. They are also the major source of draft power and dung and are closely related to the Nepalese civilization.
According to annual report of Department of Livestock (DLS) 2013/14, total population of cattle in Nepal is 7243916 and total milk production is 17000073 metric ton and that by cattle only is 532300 metric ton. Similarly, according to annual report of District livestock Service Office (DLSO) Rupandehi (2072/73), there are 40700 improved cattle and the number of improved milking cattle is 29534 and total milk production by cattle is 50610 metric ton. There are 442 registered cattle farm. There are large numbers of commercial dairy farm for the fulfillment of demand of dairy products. With the introduction of artificial insemination using semen from exotic dairy cattle in the dairy industries, the population of high yielding crossbred dairy cattle has been increasing, resulting in rise in milk production. Although the milk production is increased, the crossbred dairy cattle have been facing various problems in and around the perparturient period, which includes metabolic disorders, dystocia, retention of placenta and poor fertility.
In Nepal, very limited work has been done in this field. Singh, et al. [1] have documented some hematological and blood biochemical parameter in central and eastern region of Nepal. Studies have also shown that the values of these parameters once obtained can’t remain standard forever and needs re-evaluation from time to [2, 3]. As a result of using unspecific reference values, dairy practitioners, entrepreneurs and farmers have been experiencing higher rates of misdiagnosis, mistreatments and mismanagement of metabolic disorder in the herd [4]. The high-producing dairy cow always verges on abnormal homeostasis and the breeding and feeding of dairy cattle for high milk yields which is etiologically related to metabolic disease so common in these animals.
So, this study is aimed to determine the standard reference values for biochemical parameters of improved cattle of Rupandehi district of Nepal and also try to give co relation with body condition score.
Statement of Research Problem
Metabolic profile test is a pre symptomatic diagnostic aid capable of giving early warming of certain types of metabolic derangement in dairy animals [5]. Biochemical profile is essential in the evaluation of the health status of animals and is a prerequisite for the diagnosis of various pathophysiological, metabolic and nutritional disorders in cattle [6]. It has been recently proved that the metabolic profile testing as a best tool for the assessment of dairy heard’s nutritional status with simple blood test [7]. Among domestic animals, the metabolic diseases achieve their greatest importance in dairy cows and pregnant ewes. But these indices may vary depending on factors such as origin, climate, management practice, geographical distribution and stage of animals [8]. Therefore, determination of normal hematological and blood biochemical values is important for the clinical interpretation of laboratory data especially in the pregnant animals which requires adequate balanced nutritional in the perparturient period to maintain homeostasis for onset of parturition and lactation [8].
Scope and Limitations
The metabolic profile was initially designed as a pre- symptomatic diagnostic aid based on statistical analysis of blood metabolites but it has been applied to:
- Assess nutritional status
- Improve feeding management
- Diagnose metabolic disorder in dairy herds
- Select superior individuals The test processes having various scopes have certain limitation as well.
Limitation
- Limited sample size due to limited kits
- Time limit
- Expensiveness of kits Major factor for the difference in the metabolic profile is stage of lactation and season of years. Variation in blood metabolite concentrations may depend on parity, time relative to calving, pregnancy status, environmental condition, dietary nutrient and sampling handling.
Objective
General Objective: To determine the reference value of biochemical parameters of improved cattle of Rupandehi district of Nepal. Specific Objective:
- To determine various biochemical parameter like serum protein, serum albumin, serum globulin, blood urea nitrogen (BUN), creatinine, Aspartate transaminase (AST), Alanine transaminase (ALT), Alkaline phosphatase (ALP) , Calcium and Phosphorus of improved cattle at various stage of lactation.
- To compare the mean value of biochemical parameter among various stage of lactation.
Time and Place of Study
This research was conducted in Rupandehi district and at the Department of Pathology, Veterinary Programme, IAAS, TU under the supervision of Prof. Dr. DK Singh.
Literature Review
Origination of the Metabolic Profile
The Compton Metabolic Profile test (CMT) was designed by Payne, et al. to monitor the metabolic health of the herd with the original components being glucose, urea, inorganic phosphorus, Calcium, Magnesium, Sodium, Potassium, albumin, globulin, Hemoglobin and copper.
Variables in Dairy Herd Metabolic Profile Testing
The following are the key metabolic parameters that identify risk of periparturent disease collectively. Serum protein: It is also known as total protein. It includes albumin and globulin. The total protein test may be used for checking unexpected weight loss, fatigue, or the symptoms of a kidney and liver disease. Proteins are necessary for body’s growth development and health.
- Albumin: It constituent the major part of serum protein. It has one polypeptide chain with 585 amino acids. It has molecular weight of 69000D. It is elliptical in shaped. It is synthetized by hepatocytes; therefore estimation of albumin is a liver function test. It is synthesized as a precursor, and the signal peptide is removed as it passes through endoplasmic reticulum. It can come out of vascular compartment. So albumin is present in CSF and intestinal fluid [9]. It is protein that keeps fluid form leaking out of the body vessels. It was found to be associated with postpartum disease and can be used to predict disease risk in close-up and fresh periods. The fresh cows that can maintain serum albumin concentration ≥35gm/l were less likely to have postpartum disease. Serum albumin concentration ≤32.5gm/l in close up dry cows resulted in a three folds greater risk for postpartum disease. Albumin concentration in the blood has been shown to be significantly correlated with good nutritional condition and having good BCS cattle.
- Globulin: They constitute immune globulins produced by B lymphocytes as well as alpha and beta globulins synthesized mainly by hepatocytes. Gamma globulins in the serum are increased in chronic liver diseases. In cirrhosis, antibiotics against intestinal bacteria are seen, since the cirrhotic liver cannot clear the bacteria reaching through circulation [9]. The high globulin concentration may be as a result of infection. Calculating concentration of globulin usually give an indication of an animal’s immune state and in response to fighting disease and infections. Blood Urea Nitrogen: It is the amount of urea nitrogen found in blood. The liver produces urea in the urea cycle as a waste product of the digestion of protein. It is the indication of renal (kidney) health. The BUN may be in increased due to high protein diet, decreased in glomerular filtration rate (GFR), congestive heart failure, GI hemorrhage and fever. The main cause of a decreased in BUN is severe liver disease, anabolic state. It is a measurement of the amount of nitrogen found in the blood that comes from the waste product of urea. Urea is made when protein is broken down in the body and secreted from the liver. In the literature BUN is consistently lower in animals administered a β-AA. Steers administered clenbuterol presented depressed BUN concentrations. In correlation BUN concentrations, another study revealed feeding cattle ZH resulted in decreased plasma urea nitrogen (PUN) concentrations. Creatinine: It is a breakdown product of creatine phosphate in muscles and is usually produced at a fairly constant rate by the body. This conversion is spontaneous, non-enzymatic and is dependent on total muscles mass of the body [9]. The serum creatinine is most commonly used indicator of renal function. The creatinine level in blood and urine may be used to calculate the creatinine clearance (CrCl) which correlates approximately with the glomerular filtration rate (GFR). Liver Enzyme: The liver is an organ with large functional storage and regenerative capability. Several biochemical test are useful in the evaluation and management of patients with hepatic dysfunction. These tests can be used to detect the presence of liver disease, distinguish among different types of liver disorders. The useful bio meters of liver are: Aspartate transaminase (AST or SGOT), Alanine transaminase (ALT or SGPT), Alkaline phosohatase (ALP), Gamma glutamyl transpiptidase (GGT).
- Aspartate transaminase (AST): It is also known as Serum glutamic oxaloacetic transaminase (SGOT). It is a pyridoxal phosphate (PLP) dependent transaminase enzyme. AST relies on PLP (Vitamin B6) as a cofactor to transfer the amino group from aspartate or glutamate to the corresponding ketoacid. It is a marker of liver injury and shows moderate to drastic increase in parenchymal liver disease like hepatitis and malingnancies of liver. The level of AST is significantly increased in myocardial infarction [9].
- Alanine transaminase (ALT): It is also known as Serum glutamate pyruvate transaminase (SGPT). It catalyzes the transfer of an amino group from L-alanine to α-ketoglutarate, the products of this reversible transamination relation being pyruvate and L-glutamate. It needs pyridoxal phosphate as co enzyme. Increased in values is seen in acute hepatitis, either toxic or viral in origin [9].
Both ALT and AST level are increased in liver disease, but ALT>AST. Raise in ALT levels may be noticed several days before clinical signs such as jaundice are manifested. The degree of elevation may reflect the extent of hepatocellular necrosis. In most cases the lowering of the level of transaminases indicates recovery, but a sudden fall from a very high level may indicate poor progress. Elevation of ALT is more in case of hepatic disease compared to AST. But AST may be more then ALT in alcoholic liver disease. In alcoholic liver disease, the actual values show only mild elevation; but a ratio of AST/ALT more than 2 is quite suggestive [9]. • Alkaline phosphatase (ALP): It is a homodimeric protein enzyme in the cells lining the billary ducts of liver. It plays role in lipid transposition in small intestine and calcification of bones.
Macro Minerals: Calcium (Ca) and phosphorus (P) are of extreme interest as to their status relative to their role in milk fever, alert downers cow syndrome and weak cow syndrome. Blood concentration of macro minerals are not reflective of dietary status when the homeostatic system in functioning properly. Phosphorous in blood concentration is somewhat sensitive to dietary intake. The blood macro minerals concentration will need to carefully interpret in light of whether or not the homeostatic system is in proper operation.
Materials and Methods
Place of Sampling
Sampling was done from the Rupandehi district of Nepal. Rupandehi district has latitude of 27°20”N to 27°47” N and the longitude of 83°12”E to 83°38” E. Its altitude is 100m to 1229m above sea level. It lies in Province No.5 covering an area of 1360sqkm. The population of the district was estimated 880196 according to 2011 Nepal census. It is bordered with Parasi district in east, Kapilvastu district in
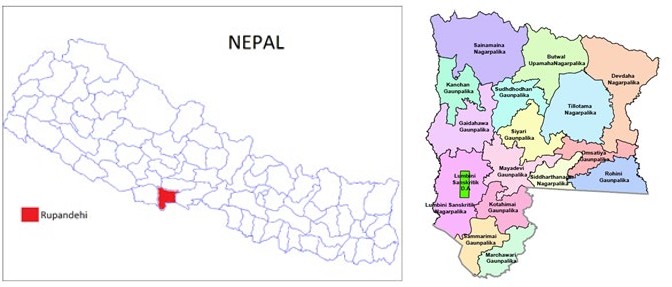
the west, Palpa district in north and Uttar Pradesh of India in South. The temperature may exceed 40℃ in summer and go below 5℃ in winter. This region has the liver system like Danda, Rohini, Danab, Kanchan, Kothi, Turiya, Gaghara, Koilijhang, Tinaau, etc. (Annual report, DLSO Rupandehi, 2072/73).
The sampling was done from the commercial farm of this region with the provision various feeding methods. People inhabiting in these districts are predominantly involved in agriculture (crop and livestock production) as their main economic activity. The principle species of livestock in these districts are Poultry (chicken), cattle, buffalo, goats, pigs and sheep. In all species, there is trend of gradual shifting of indigenous breeds to cross and exotic breeds due to Artificial Insemination and commercialization of livestock entrepreneurs (Figures 1a & 1b).
Figure 1a: Map of Nepal Figure 1b: Map of Rupandehi District.
Experimental Design and Sampling
A total of 53 improved cattle (apparently healthy) were selected from farmers. Those cattle were divided into various predefined groups:
- Dry periods (last 3 weeks of pregnancy)
- Early lactating (calving to 3 weeks)
- Mid lactating (2-4 months) and
- Late lactation (after 4months).
Collection and Transportation of Sample
Samples was collected from the external jugular vein from each predefined group, collected into the serum collecting tube and was transported in to a cool box to the laboratory. The samples were centrifuged at 3500rpm for 15minutes within 24hours. Thus the serum will be collected and stored at -20℃.
Analysis
Serum Analysis: The serum analysis was done by using manually operated refractometer for total protein and Calorimeter with the available reagent in the market for all other parameter.
Statistical Analysis: It was done by using SPSS-20 using one way ANOVA. The data was presented as mean standard error (SE).
Result
| Dry Cattle | 1st Stage of Lactation | 1Ind Stage of Lactation | IIIrd Stage of Lactation | |
|---|---|---|---|---|
| TP (gm/dl)** | 6.333±0.218 | 6.20±0.487 | 6.987±0.186 | 7.133±0.129 |
| Albumin (gm/dl) | 3.027±0.133 | 2.895±0.194 | 2.973±0.069 | 2.719±0.079 |
| Globulin (gm/dl)** | 3.027±0.189 | 3.305±0.479 | 4.013±0.183 | 4.401±0.162 |
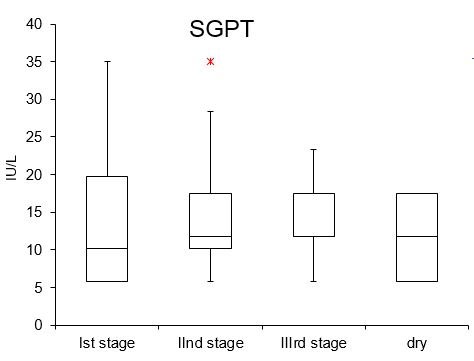
| SGPT (IU/L) | 11.412±1.462 | 14.560±3.862 | 13.420±1.884 | 13.263±1.214 |
| SGOT (IU/L) | 17.548±2.596 | 14.953±1.280 | 13.234±1.019 | 19.452±2.065 |
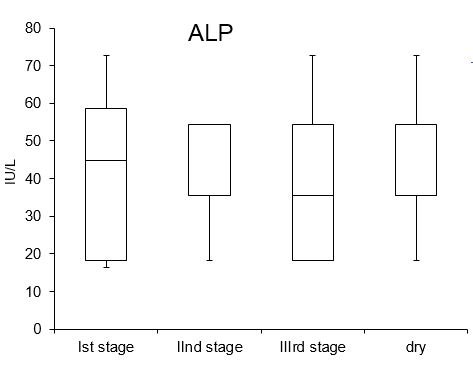
| APL (IU/L) | 42.704±4.397 | 42.534±8.347 | 38.279±3.495 | 36.10±4.077 |
| Creatinine % | 0.835±0.086 | 0.836±0.166 | 0.89±0.083 | 0.963±0.096 |
| BUN (mg/dL)** | 17.124±2.496 | 33.706±4.074 | 23.985±3.229 | 33.976±4.518 |
| Ca mg % | 10.922±0.971 | 11.207±0.694 | 11.118±0.618 | 11.786±0.679 |
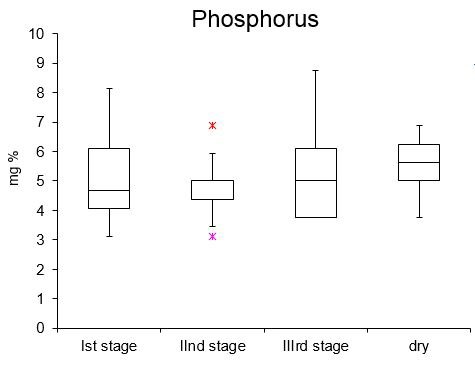
| P mg % | 5.523±0.275 | 5.16±0.654 | 4.544±0.215 | 5.104±0.344 |
Table 1: Concentration (Mean±SE) of metabolic profiles in different states of Lactation of improved cattle.
** Significant between the group SE = Standard Error Table 1: Concentration (Mean±SE) of metabolic profiles in different states of Lactation of improved cattle.
Discussion
The result shows significant difference (P<0.05) in total protein, globulin and blood urea nitrogen among various stage of lactation (Table 1). The difference in parameters like albumin, SGPT, SGOT, ALP, Creatinine, Calcium and Phosphorous among various stage of lactation however were non-significant (P>0.05).
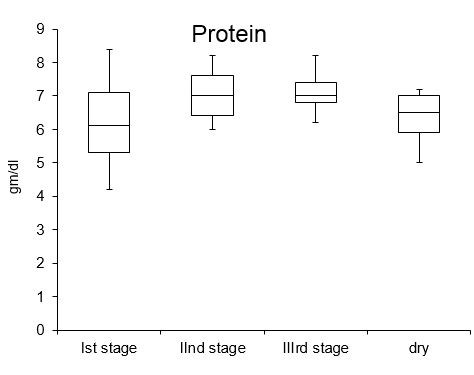
Total Protein
It was significantly high (P<0.05) at III stage of lactation. The significant difference in Total protein among various stage of lactation was also supported by Yousuf, et al. [10] who found Total Protein significantly higher (P<0.01) in mid- lactating than early-lactating cows. It was also supported by Surya prakash M, et al. [11] who found the significant (P<0.05) difference in total protein at various stage of lactation.
But the result contradict with the result of Dhungana S, et al. who found non-significant (p>0.5) difference in value of total protein at various stage of lactation. Onita, et al. [12] reported that the Plasma TP represent one of the nitrogen metabolism indicators and depend on protein content of the fodder, lactation phase, cows age and season. Increase in protein concentrations may also be ascribed to a disproportionate increase of high protein fed to the yielders or an increased mobilization of protein in lactating animals [13].
The high protein level in III stage of lactation may be due to grain overload, salt toxicity, dehydration, inflammation, and infection and low protein in dry stage may be mal nutrition, intestinal absorption problem, blood loss etc (Figure 2).
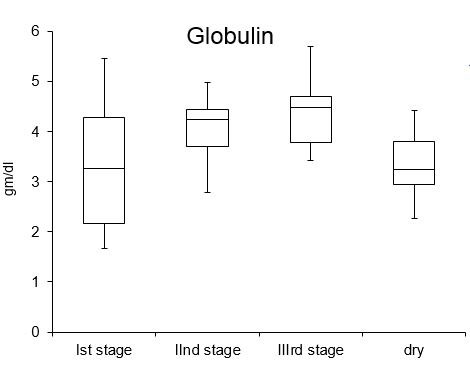
Globulin
The serum globulin concentration was significantly different (P<0.05) with highest at II stage of lactation. The significant difference in globulin among various stage of lactation was also supported by Yousuf, et al. (2016) [10] with level of significance (P<0.01). But the result contradict with the result of Dhungana S, et al. (2016) who found non- significant (p>0.5) difference in value of total protein at various stage of lactation. This result also contradict with the result of Rossato W, et al. [14] who found non-significant difference in the globulin level in serum (P>0.05) (Figure 3).
The level of serum globulin is related to the immunity and immune response of the body and its response against disease and infection. It may be due to infestation of ecto or endo parasite. It may be the consequence of displacement blood gamma globulins in mammary gland. It may be due to failure of passive transfer, decreased production, mal- absorption, hepatic disease, and immunodeficiency.
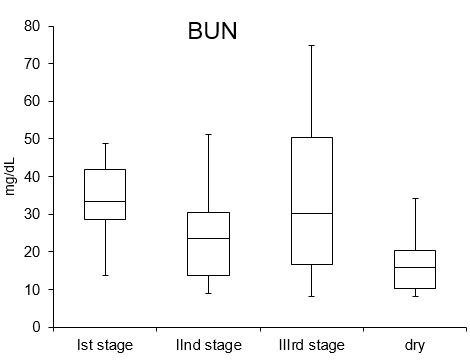
Blood Urea Nitrogen
It was found Significant different (P<0.05) at various stage of lactation with highest BUN value at III stage of lactation.
Similar result was observed by ABD EL Naser EM, et al. [15] who also found significant (P<0.01) difference in BUN at various stage of lactation. Castro de, et al. (2017) [16] also found significant (P<0.05) difference in BUN in various stage of lactation and also found that BUN is high at late stage of lactation.
But it contradicted with Rossata W, et al. [14] who found non-significant (P>0.05) difference among various stage of lactation (Figure 4).
Urea and creatinine are waste products that the kidneys normally filter from the blood and these are interrelated, if the kidneys are not working properly. The increased total blood volume especially in the late pregnancy induces an increase glomerular filtrations, which is also responsible on the increased volume of albumin and urea during the late gestation.
Albumin
It was found non-significantly (P>0.05) different among various stage of lactation with highest in dry stage.
This finding was supported by ABD EL Naser EM, et al. [15] who found non-significant difference in various stage of lactation. Rossato W, et al. [14] also found non-significant difference (P>0.05) in various stage of lactation with highest value of albumin in late stage of lactation. This result differ from the research of Mahammad AQ, et al. [17] who found significant difference (P<0.05) in various stage of lactation. Yousuf, et al. also found significant difference (P<0.01) with highest Albumin at stage III (Figure 5).
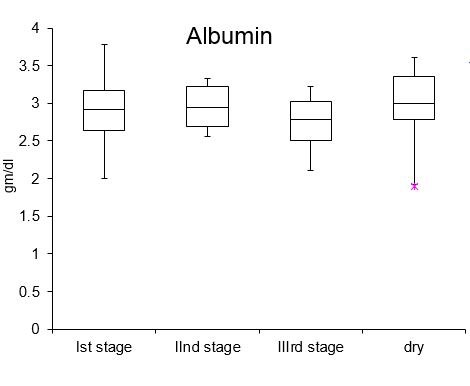
The concentration of albumin in the blood is related to nutrition and feeding habits. It may be increased due to dehydration, shock, lipemia (interference). The value of albumin may be decreased due to glomerulonephritis, hemorrhage, chronic infections, malnutrition, and over- hydration.
SGPT/ALT
It was non-significantly different (P>0.05) with highest SGPT activity at Ist stage of lactation .This findings agrees with the research of Jozwik A, et al. [18] who found non- significant difference (P>0.05) in activity of SGPT at various lactation stage. But it differs from research of Stojevic Z, et al. [19] where activity of SGPT was significantly different (P<0.05) at various stage of lactation with high in IIIrd stage of lactation. The research of Mohammad AQ, et al. [17] show high SGPT at Ist stage of lactation as this research but their research show significantly different (P<0.05) SGPT among various stage of lactation.
The activity of SGPT may increase because of Hepatitis, hypoxia, hepatic necrosis, cholestasis, hepatic neoplasms and diabetes mellitus (slight) (Figure 6). The decrease in activity of SGPT may not be clinically significant. The activities of aminotransferase (AST and ALT) in blood associated with implantation, embryo survival, growth, uterine carbohydrate metabolism amino acid metabolism and glycogen deposition [20].
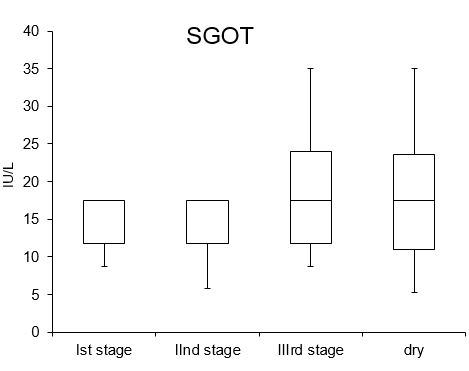
SGOT/AST
It was non-significantly different (P>0.05) with highest activity of SGOT at III stage of lactation.
This finding agrees with the finding of Jozwik A, et al. [18], who also found non-significant difference (P>0.05) in activity of SGOT among various stage of lactation with highest at IIIrd stage of lactation. But it contradicted with the finding of Stojevic Z, et al. [19] who found significant difference (P<0.001) among various stage of lactation with highest at Ist stage of lactation. Mohammad AQ, et al. [17] also found significant difference (P<0.05) among various stage of lactation with highest in stage Ist of lactation.
The increased in activity of SGOT may be due to hepatitis, hypoxia, hepatic necrosis, skeletal muscle damage, myocardial necrosis, acute pancreatitis, and diabetes mellitus (slight), hemolysis (artifact). The decrease in activity of SGOT may not be clinically significant (Figure 7). The activities of aminotranferase (AST and ALT) in blood associated with implantation, embryo survival, growth, uterine carbohydrate metabolism amino acid metabolism and glycogen deposition [20].
ALP
It was found non-significantly different (P>0.05) at various stage of lactation with highest at dry stage.
This is similar to the finding of Djokovi E, et al. [21], who also found non-significant difference in activity of ALP among various stage of lactation and is also supported by Mohamed GAE, et al. [22] who found non-significant difference (P>0.05) among various stage of lactation.
The research of Mohamad AQ, et al. [17] found significant (P<0.05) difference among various stage of lactation but had highest activity at dry season. The activity of ALP may increase due to Steroids- endogenous, exogenous, young growing animals, acute pancreatitis, metastatic neoplasms of bone, osteosarcoma, diabetes mellitus, drugs (anticonvulsants). The decrease in activity of ALP may be clinically not significant. The higher serum levels in young animals are indicative of rapid skeletal growth [23]. After parturition (ALP) levels dropped during lactation and increased again toward weaning [23]. The (ALP) activity values decreased successively during the milking period.
Creatinine
It was found non-significantly different (P>0.05) among various stage of lactation with highest at III stage of lactation. It however differ from the finding of Mohamad AQ, et al. [17] who found significant difference (P<0.05) at various stage of lactation with highest in stage I of lactation.
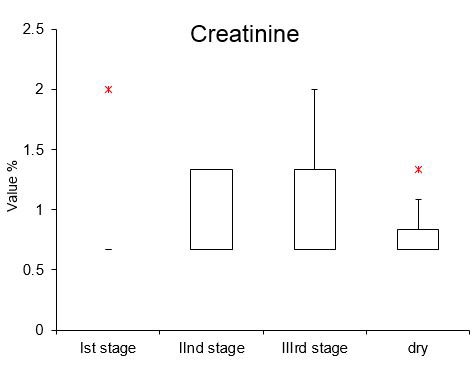
The value of creatinine may increase due to decreased renal perfusion, dehydration, shock, hypoadrenocorticism, heart failure, renal azotemia (as for urea), and post-renal azotemia (as for urea). The decrease in value of creatinine is usually not significant but may be seen in young animals and cachexia. Creatine is phosphorylated in the muscle, forming a reservoir of readily available high energy. Because creatine is contained almost entirely in striated muscle, the amount of creatinine released is related to the muscle mass. High blood levels (more than twice the concentrations reported in the present study) are indicative of nephritis (Figure 8).
Calcium
It was found non-significantly different (P>0.05) at various stage of lactation with highest at IIIrd stage of lactation.
It was supported by Chacha F, et al. [24] who also found non-significant difference in Calcium in various stage of lactation. Same was found by Rossato W, et al. [14] who also found non-significant difference (P>0.05) among various stage of lactation.
But, EL Naser EM, et al. [15] found significant difference (P<0.05) among various stage of lactation with highest at stage III of lactation. The depressed trend in calcium level during the stage of lactation could be a result of the impaired absorption of food metabolites from the gastrointestinal precursor, excessive losses through urine, colostrums as it was much more drained in the colostrums during excessive milking and due to insufficient mobilization from the skeleton. It may also decrease due to, hypoalbuminemia, malabsorption, parturient paresis, eclampsia, pancreatic necrosis, renal secondary hyperparathyroidism, artifact like EDTA anticoagulant and hemolysis and massive myopathy.
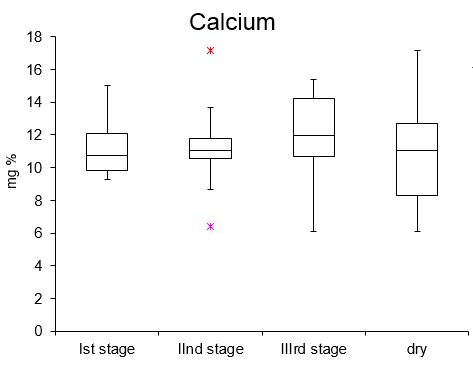
The level of calcium may increase due to hyperalbuminemia (dehydration), hypercalcemia of malignancy e.g., lymphosarcoma, primary hyperparathyroidism, parathyroid adenoma or carcinoma, excessive vitamin D or Ca, lipemia (artifact) and young, growing animals (Figure 9). Phosphorus It was found non-significantly different (P>0.05) at various stage of lactation with highest at dry stage. Similar result was found by EL Nasar EM, et al. [14] who found non- significant difference (P>0.05) at various stage of lactation.
But Chacha F, et al. [24] found significant difference (P<0.05) at various stage of lactation with highest Phosphorus level in early stage of lactation. The moderate depression in the levels of P might be due to the necessity of it for the colostrums synthesis. Meglia, et al. reported that blood levels of Ca & P are expected to decrease at calving due to the large demand of colostrums and milk production [25, 26, 27, 28, 29, 30, 31, 32, 33, 34, 35, 36, 37, 38, 39, 40, 41, 42]. The increase in phosphorus may be due to hypoadrenocorticism (Addison’s disease), acidosis (shift out of cells), decreased excretion (renal failure, diuretics, K+ sparing), rhabdomyolysis, improper sample collection, handling (hemolysis in some species). It may decrease due to respiratory alkalosis, gastrointestinal loss, urinary loss, hyperaldosteronism, excessive steroids, excessive ACTH, renal tubular acidosis [42, 43, 44, 45, 46, 47, 48, 49, 50, 51, 52].
Conclusion
This result demonstrated the reference value of various biochemical parameters of improved cattle at various stage of lactation of Rupandehi district. This reference values can be used by veterinarian as a base for Evidence based Veterinary Medicine. It can be useful in study of metabolic and other disorders as well.
Recommendation
This result can be used by practitioner as the reference values for various biochemical parameter (for detection of various metabolic disease) especially in region around Rupandehi district.
References
-
Singh AS, Pal DT, Mandal BC, Singh P, Pathak NN (2002) Studies on Changes In Some Blood Constituents of Adult Crossbred Cattle Fed Different Levels of Extracted Rice Bran. Pak J Nutr 1(2): 95-98.
-
Kieferndorf U, Keller H (1990) Standard values of the white blood count with regards to breed, sex, age and season. Pferdeilkunde 6(2): 73-78.
-
Kollakowski T, Keller H (1990) Standard values of the red blood count with regards to breed, sex, age and season. Pferdeilkunde 6: 65-71.
-
Pal P, Acharya HR (2013) Subclinical Metabolic Disorders in Post-Partum Cross Bred Hf Cattle In Central Part Of Nepal. International Journal of Pharmacology Medicine Biological Science 2(2): 57-62.
-
Canfield PJ, Best FG, Fairburn AJ, Purdie J, Gilham M (1984) Normal Haematological and Biochemical Values for the Swamp Buffalo and Dairy Cattle in Australia. Australian Veterinary Journal 61(3): 89-93.
-
McDowell LR (1992) Minerals in animal and human nutrition. Academic Press Inc. Harcourt Brace Jovanovich Publishers, San Diego, CA.
-
Hasanpour A, Moghaddam GA, Nematollahi A (2008) Biochemical, Hematological, and Electrocardiographic Changes in Buffaloes Naturally Infected with Theileria annulata. Korean J Parasitol 46(4): 223-227.
-
Ali MA (2008) Studies on calving Related Disorders (Dystocia, Uterine Prolapse and Retention of Fetal Membranes) of the River Buffalo (_Bubalus Bubalis_), in Different Agroecological Zones of Punjab Province, Pakistan. University of Agriculture, Faisalabad, Pakistan.
-
Vasudevan DM, Sreekumari S, Vaidyanathan K (2011) Text book of Biochemistry for Medical Students. In: 6th (Edn.), Jaypee Brothers Medical Publishers (P) Ltd, New Delhi.
-
Yousuf M, Alam MR (2016) Nutritional status of high yielding crossbred cow around parturition. Journal of Advanced Veterinary and Animal Research 3(1): 68-74.
-
Surya Prakash M, Pathan MM, Arya JS, Lunagariya PM (2018) Assessment of Glucose, Total Protein, Albumin and Cholesterol Level and Its Correlation with Milk Production during Different Stages of Lactation in Indigenous and Crossbred Cows. International Journal of Current Microbiology and Applied Sciences 7(4): 1248- 1256.
-
Onita P, Colibar O (2009) Energy, Protein and Mineral profile in peripartal period at dairy cows. Lucrari Stintifice Medicina Vet 2: 398-404.
-
Setia MS, Duggal RS, Singh R (1992) Biochemical constituent of blood in buffaloes and cows during late pregnancy and different stages of lactation-a longitudinal study. Buffalo J 2: 123-129.
-
Rossato W, González FH, Dias MM, Riccó D, Valle SF, et al, (2001) Number of Lactations Affects Metabolic Profile of Dairy Cows. Archives of Veterinary Science 6(2): 83-88.
-
EL-Naser EM, Mohamed GM, Elsayed HK (2014) Effect of Lactation Stages on Some Blood Serum Biochemical Parameters and Milk Composition in Dairy Cows. Assiut Veterinary Medical Journal 60(142): 83-88.
-
Castro de, Leão KM, Carmo RM, Silva MAP, Nicolau ES, et al. (2017) Milk composition and blood metabolic profile from Holstein cows at different calving orders and lactation stages. Maringá 39(3): 315-321.
-
Mohammad AQ (2011) A Study of some Hematological and Biochemical Parameters in Late Pregnancy, Parturition and early Lactation in Crossbred Cows. A Thesis Submitted to the Council of the College of Veterinary Medicine University of Basrah in Partial Fulfillment of Requirements for the Master Degree of Sciences in Veterinary Medicine.
-
Joźwik A (2012) Relationship between milk yield, stage of lactation, and some blood serum metabolic parameters of dairy cows. Czech J Anim Sci 57(8): 353-360.
-
Stojevic Z (2005) Activities of AST, ALT and GGT in clinically healthy dairy cows during lactation and in the dry period. Veterinarski Arhiv 75(1): 67-73.
-
Milinkovic Tur S, Peric V, Stojeic Z, Zdelar Tuk, Pirsljin J (2005) Concentrations of total proteins and albumins and AST and GGT activities in the blood plasma of mares during pregnancy and early lactation. Vetrinarski Arhiv Volume 75(3): 195-202.
-
Dokovic R (2017) Serum Enzyme Activities in Blood and Milk in the Different Stage of Lactation in Holstein Dairy Cows. Biotechnology in Animal Husbandry 33(2): 193- 200.
-
Mohamed GAE (2014) Investigation of Some Enzymes Level in Blood and Milk Serum in Two Stages of Milk Yield Dairy Cows. Assiut Vet Med J 60(142): 110-120.
-
Doornenbal H, Tong AK, Murray NL (1988) Reference Values of Blood Parameters in Beef Cattle of Different Ages and Stages of Lactation. Can J Vet Res 52(1): 99- 105.
-
Chacha F, Bouzebda Z, Afri FB, Gherissi DE, Lamraoui R, et al. (2018) Body Condition Score and Biochemical Indices Change in Montbeliard Dairy Cattle: Influence of Parity and Lactation Stage. Global Veterinaria 20(1): 36- 47.
-
Aktas MS, Ozkanlar S, Ucar O, Ozkanlar Y, Kaynar O, et al. (2011) Relationships between Body Condition Score and some metabolic blood parameters in early lactating dairy cows. Revue Méd Vét 162(12): 586-592.
-
(2015) Annual report, Department of Health Services 2072/73, Kathmandu, Nepal.
-
Ate IU, Rekwot PI, Nok AJ, Tekdek LB (2009) Serum electrolyte values of cows during third trimester of pregnancy and early lactation in settled cattle herds in Zaria, Northern Nigeria, African Journal Biomedical Research 12(2): 125-130.
-
Barbara S, Nowak W, Oszmałek EP, Mikuła R, Stanisławski D, et al. (2016) The effect of body condition score on the biochemical blood indices and reproductive performance of dairy cows. Annual Animal Science 16(1): 129-143.
-
Bjerre-Harpøth V, Friggens NC, Thorup VM, Larsen T, Damgaard BM, et al. (2012) Metabolic and production profiles of dairy cows in response to decreased nutrient density to increase physiological imbalance at different stages of lactation. Journal of Dairy Science 95(5): 2362- 2380.
-
Bohora TPBD (2009) Assessment of Some of the Serum Biochemical Profile and Ovarian Status of Cyclic and Non-Cyclic Anestrous Buffaloes of Shivnagar Vdc and Iaas Livestock Farm of Chitwan. Nepal J Inst Agric Anim Sci 30: 199-205.
-
Botezatu A, Vlagioiu C, Codreanu M, Orașanu A (2014) Biochemical and Hematological Profile in Cattle Effective. Bulletin UASVM Veterinary Medicine 71(1): 27-30.
-
Brscic M, Cozzi G, Lora L, Stefani AL, Contiero B, et al. (2015) Short communication: Reference limits for blood analytes in Holstein late-pregnant heifers and dry cows: Effects of parity, days relative to calving, and season. Journal of Dairy Science 98(11): 7886-7892.
-
Cozzi G, Ravarotto L, Gottardo F, Stefani AL, Contieroet B, et al. (2011) Short communication: Reference values for blood parameters in Holstein dairy cows: Effects of parity, stage of lactation, and season of production. Journal of Dairy Science 94(8): 3895-3901.
-
Das H, Lateef AHH, Panchasara M, Ayub Ali, Chandra P, et al. (2017) Effect of Lactation Stages on Blood Metabolic Profile of Mehshani Buffalo (Bubalus Bubalis). International Journal of Livestock Research 7(40): 265- 263.
-
Edmonson AJ, Lean IJ, Weaver LD, Farver T, Webster G (1989) A Body Condition Scoring Chart for Holstein Dairy Cows. Journal of Dairy Science 72(1): 69-79.
-
Szucs GZE (2009) The Relationship between Body Condition Scoring and Metabolic Profile in the High Yielding Dairy Cows. Kocatepe Veterinary Journal 2(2): 1-7.
-
Graff M, Suli A, Szilagyi S, Miko E (2017) Relationship between Body Condition and some Reproductive Parameters of Holstein Cattle. Advanced Research in Life Sciences 1(1): 59-63.
-
Gonzalez FD, Muiño R, Pereira V, Campos R, Benedito JL (2010) Relationship among blood indicators of lipomobilization and hepatic function during early lactation in high-yielding dairy cows. J Vet Sci 12(3): 251-255.
-
Herath HMGP, Ranaweeer KKTN, Weerasinghe WMPB, Mahipala MBPK (2018) Serum Metabolic Profile Based Assessment of Nutritional Status of Temperate Crossbred, Stall fed, Lactating Dairy Cows: A Case Study of a Medium Scale Mid-country Cattle Farm. Tropical Agricultural Research 29(2): 157-166.
-
(2003) Tribhuvan University. Institute of Agriculture and Animal Science. Nepal.
-
Kida K (2003) Relationship of Metabolic profiles to milk ction and feed in dairy cows. J Vet Med Sci 65(6): 671- 677.
-
Koubkova M, Knizkova I, Kunc P, Hartlova H, Flusser J (2002) Influence of high environmental temperatures and evaporative cooling on some physiological, haematological and biochemical parameters in high yielding dairy cows. Czech J Anim Sci 47(8): 309-318.
-
(2013) Department of Livestock Service, Livestock Statistics book. Nepal.
-
Lumsden JH (1978) On Establishing Reference Valuesfs. Can J comp Med 42: 293-301.
-
Mahima, Singh VK, Verma AK, Kumar V, Singh SK, et al. (2013) Hematological and Serum Biochemical Profile of Apparently healthy Hariana cattle Heifer in Northern India. Pakistan Journal of Biological Science 16(21): 1423-1425.
-
Murray RK, Kennely PK, Bender DA, Rodwell VW (2012) Herpe’s Illustrated Biochemistry. 29th (Edn.), The McGraw-Hill Companies, Inc, USA.
-
Opara MN, Udevi N, Okoli IC (2010) Haematological Parameters and Blood Chemistry of Apparently Healthy West African Dwarf (Wad) Goats.
-
Pal P, Bhatta R (2013) Determination of blood metabolites in cross HF cattle at pre parturent stage: Reference value. International Journal of pharma medicine and biological science 2(1): 57-57.
-
Piccione G, Messina V, Marafioti S, Casella S (2012) Changes of Some Haematochemical Parameters In Dairy Cows During Late Gestation, Post-Partum, Lactation And Dry Periods. Veterinary Medicine Zoonotic 58(80): 59- 64.
-
Poncheki JK, Canha MLS, Viechnieski SL, Almedia RD (2015) Analysis of daily body weight of dairy cows in early lactation and associations with productive and reproductive performance. Revista Brasileira de Zootecnia 44(5): 187-192.
-
Samanc H, Gvozdic D, Fratric N, Kirovski D, Djokovic R (2015) Body condition score loss, hepatic lipidosis and selected blood metabolites in Holstein cows during transition period. Animal Science Papers and Reports 33(1) 35-47.
-
Sripad KS, Kowalli R (2016) Serum Biochemical Profile of Male, Female and Different Age Groups of Malnad Gidda Breed of Cattle. Veterinary Clinical Science 4(1): 06-08.
- Natural Decline to Extinction of A New Zealand Rabbit Population
- Mitochondrial Bio-Logistics: Steering Co-Enzyme Q10 and Lycopene Synergies within the Science 4.0 Bio-OS Framework
- Hymenoptera Specimens from the Caño Negro Wetland, of the National Museum Collection, Costa Rica
- Science 4.0: Comprehensive Architecture of the Biological Operating System (Bio-OS) A Framework for Systemic Resilience and Industrialized Bio-Governance
- Rabbit on, or Hare Back? Understanding Climate Change
- Clinical Validation of Science 4.0: Flow Steering and Epigenetic Drift Inversion on a 76-Year-Old Hybrid System