Reproduction and Condition Indices-Body Structures Adjusted Means Comparison of Silver Perch (Bairdiella chrysoura) from Tampamachoco Lagoon, Northeastern Mexico
Background: The study of reproduction and condition are fundamental topics in fisheries science. To this aim, there are several methods including Gonadosomatic index, Condition factors (Fulton, Ricker, relative) and hepatosomatic index. These traditional methods present several drawbacks (ratio indices with variability and distribution problems; assumption of linear relationships and of independence from length, focus on the intercept of linear models, etc.). In this study, we present an application of the multivariate analysis of covariance (MANCOVA) to analyze reproduction and condition of Bairdiella chrysoura from Tampamachoco Lagoon compared with some traditional indexes. Methods: This comparison takes into account the biological data (lengths and weights) collection of 9,505 individuals of B. chrysoura registered during an annual period (May 1990- June 1991) at five localities in the Western side of the Tampamachoco Lagoon, Mexico. We compared Gonadosomatic index, Relative Condition Factor and Hepatosomatic index values to lengthadjusted means of gonad, eviscerated and liver weights from the multivariate analysis of covariance (MANCOVA) of females, males and indeterminate sex individuals. Results: High gonad, low hepatic and condition mean values (adjusted by MANCOVA) indicated the spawning period (February to March). The opposite trend among gonad weight with both, liver and somatic weights appears to indicate the metabolism focusing on gonad development for the onset of the spawning season. The patterns described by the adjusted means from MANCOVA were highly correlated and synchronic to the traditional index values. Conclusions: Therefore, the length-adjusted mean values of gonad, eviscerated body, and liver weights represent a useful alternative to the common ratio based estimators.
Introduction
The study of the reproduction is a fundamental topic in fisheries science. Several methods have been established to accomplish this aim going from detailed histological procedures to morphometric indices. The morphometric indices are based generally on body measures such as total weight, eviscerated weight, gonadal weight, liver weight, and body length. In general these measures are positively correlated with size and are used to estimate other related processes. In this way the weight of gonads is related to the maturity and spawning which in turn depends on sex, maturity stage, individual size, season, etc. Usually, total or eviscerated weight is used to estimate the condition (fatness or well-being of animals) assuming that heavier individuals of a given length are in better condition. The body weight is supposed to be related to physiological processes involved in reproduction and survival [1]. To study the reproductive cycle the gonadosomatic index has been employed:
$$GSI = 100GW^{-1}$$ (1)
Where W is total weight, and G is the weight of gonads. In addition to this numerical index, several others are used in conjunction to describe the general state of the fish as the Fulton’s condition factor (K1):
$$K_1 = 100WL^{-3}$$ (2)
Ricker’s (1975) condition factor (K2):
$$K_2 = 100WL^{-b}$$ (3)
and the relative condition factor (K3):
$$K_3 = 100Wa^{-1}L^{-b}$$ (4)
Where L is the length, and a and b are the parameters of the length-weight relationship:
$$W = aL^b$$ (5)
Other index to describe condition is the hepatosomatic index (HSI):
$$HSI = 100HW^{-1}$$ (6)
where H is the weight of the liver.
In Past years, several papers on the evaluation of the existent morphometric indices and the proposal of new ones have been published [1, 2, 3, 4, 5, 6]. The drawbacks of the traditional methods can be summarized as follows:
Some of them are ratio indices (Fulton’s condition factor, Gonadosomatic index, and Hepatosomatic index) and:
- Present increased variability in comparison with the raw variables used for calculation.
- Provide a biased estimation of the true mean of the ratio.
- Have unusual, non-Gaussian, possible intractable distributions of ratios.
- Tend to make difficult the understanding of the intervariable relationships.
- Especially for the Fulton’s index, GSI, and HSI, they assume incorrectly a linear relationship (isometric growth).
- They often assume incorrectly an independence from length.
- Most indices suppose that variation of condition is indicated only by the variation of the Parameter $a$. This implicates that the slopes $b$ of the length-weight relationship are the same among groups.
Some authors have presented alternative approaches that intend to overcome some of the difficulties presented above. For example, Erickson DL, et al. [3] proposed the “relative gonadal index” (RGI): [7]:
$$RGI = a_i = \frac{W}{S^b}$$
Where $a_i$ indicates the coefficient of the potential gonad weight (W) - length relationship for gonadal stage $i$, and $S$ is a measure of the fish “size”, as body length or body weight - gonadal weight. This procedure assumes multiplicative lognormal errors, and for estimation by means of traditional regression methods a logarithmic transform is employed to estimate the parameters. Only if the slopes do not differ significantly among the gonadal development stages it is correct to use the pooled slope $b$ to calculate RGI.
As proposed by Patterson KR, et al. [6] the condition could be studied better by using a single model to analyze the response of fish weight to a number of factors simultaneously. According to this author, this approach affords benefit from the simplicity of using an integrated analysis and avoids problems with skewed distributions of ratios. In his method, all the independent variables affecting weight are included in the analysis at the same time as the fish length, to obtain an unbiased least-squares solution. The assessment of variable significance is established by using analysis of covariance. The coefficient of each parameter is then used as a measure of its effect on fish condition. Their calculation can be carried out by means of statistical software with General Linear Model capabilities.
An additional step in complexity is included in the method proposed by Garcia-Berthou E, et al. [1]. Instead of having only one response variable in the linear model, all the morphometric measurements related with reproductive activity are included simultaneously in conjunction with factors such as sex, sampling date, and adjusted by using covariates (like body length). Their approach employs multivariate analysis of covariance (MANCOVA). The predicted adjusted means of the model describes the seasonal and other factor variations, rendering the use of indices unnecessary.
Other measures commonly used in fisheries biology studies are the residuals from length-weight relationships [7, 8] and relative weight [8, 9, 10]. The use and comparison with these indexes will be presented in another contribution.
Silver perch (Bairdiella chrysoura) is a eurihalyne species from the ichtyofauna marine component capable of tolerate wide salinity variations [11]. It has commercial and nutritional importance exploited mainly as a local resource; being a dominant component it has a relevant role in the lagoon trophic dynamics [12]. It was reported as a dominant species in marginal areas with submerged vegetation from May to June of 1990 [13]. B. chrysoura has been the subject of several studies in the Gulf of Mexico: trophic transference in marine submerged grasses at Chesapeake Bay [14]; tolerance and response to hypoxic conditions [15]; seasonal abundance at Veracruz, Mexico [16]; juvenile swimming abilities [17]; with respect to reproduction: gonad histology [18]; egg census [19]; gonadosomatic index [20, 21, 22]; acoustic monitoring of fish courtship callings [23].
The purpose of this paper is to compare the performance of the common reproduction and condition indexes with the body structures adjusted weighted means from MANCOVA (as suggested by Garcia-Berthou E, et al. [1] and following the advice from [24, 25]) on the study of fish reproductive cycle. This comparison is made by using a large data set (N = 9,505) of B. chrysoura from Tampamachoco Lagoon, Northeastern Mexico.
Methods
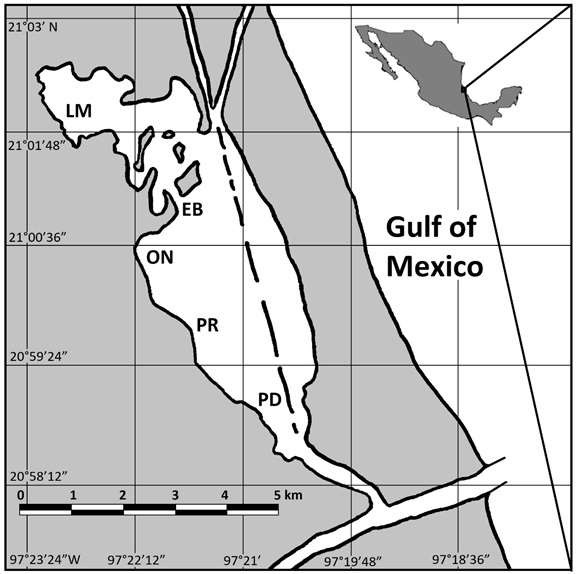
A total sample size of 9,505 individuals was collected from 13 daylight samplings carried out at the submerged grasses located in the Western side of the Tampamachoco Lagoon from May 1990 to June 1991 (Supplementary data. csv file). The sampling sites were established considering general physiographic and environmental features as location, degree of exposition to water currents, depth, salinity, temperature, pH, substrate type, tide and fluvial influence, submerged vegetation. Five sampling sites were chosen at the Western side of the lagoon with submerged vegetation (Figure 1).
The biologic material was aimed to complete an ichthyofaunal list and was obtained with a collecting and scientific research permit issued by the Mexican Ministry of Fisheries (1990-1991). Therefore a sweep net (beach seine) with 60 m of length by 2 m of height and mesh size of 0.01 m was employed. With the purpose to refer the organism number and weight of the captured species to a constant area, the net was dragged over a known perpendicular distance from the coast line taking care of keeping the net as follows:
The net was dragged over 75 m with a width between the two dragging points of 20 m (covering an approximate area of 1,500 m2). From the collects, Bairdiella chrysoura resulted to be the dominant species both in number and frequency, so this species was chosen as the focus of the present research.
The captured organisms were fixed with a solution of formaldehyde 10% neutralized with sodium carbonate and placed in properly labeled bins.
From May 1990 in each sampling site aquatic properties (temperature, depth, transparency, salinity, pH and dissolved oxygen) were registered at the mid part of the water column by means of a thermometer, lead, Secchi disk, and a field combined instrument including refractometer and pH-meter. Dissolved oxygen was measured by the Azida technique modified by Strickland JDH, et al. [26]. Weather information (pluvial precipitation) was compiled from the archives of the National Meteorological Service Office.
Fixed specimens were washed with water and preserved in 70% ethylic or 40% isopropylic alcohol solution for their posterior taxonomic determination. The determination of captured species was carried out by using the proper literature and counting the number of individuals of each species by sampling site and month.
From the individuals the following morphometric values were measured: total length, standard body length and height. Such measures were registered in cm by means of a conventional ichtyometer of 50 cm with 1 mm of precision. Total weight, eviscerated weight and liver, stomach, intestine and gonad weights were registered with analytical and semianalytical balances with precision of 0.001 g and 0.01 g, respectively. Because B. chrysoura does not present sexual dimorphism, the individuals were dissected and the gonads were removed to recognize the typical characteristics of testicles and ovaries in order to determine sex. The general gonad description of B. ronchus was used as a guide pattern to recognize sexual differences [13]. Scales, otoliths and internal organs (stomach, intestines and gonads) of a 12% of the full sample, considering all the sizes were stored to carry out posterior studies.
Taking into account the recommendation of several authors Stearns SCA [27], Garcia-Berthou E, et al. [1] to calculate the morphometric indexes, the eviscerated weight was used.
For the MANCOVA analysis the following variables were considered: Responses: eviscerated, gonad and liver weights; Factors: sex and sampling date; Covariate: standard body length. The weight and length values were multiplied by a constant (106) and (natural) log transformed to avoid working with negative values. As a full factorial model cannot be applied because there are no individuals at some combinations of factors several designs were performed [1, 24]. The data were divided in three data sets as follows:
- Males;
- Females;
- Indeterminate sex.
For all these data sets the date was considered as a factor and the body length as the covariate. As the first step the significance of the pooled covariate by factor interactions was obtained, in order to verify the parallel slopes assumption. After checking the interaction significance, the second step in the analysis was to calculate the standard MANCOVA design. As the third step, the a posteriori contrasts were obtained and interpreted. The significance level for all the analyses was 0.05.
The calculations were carried out using the general linear models (GLM) module of the MINITAB statistical package MINITAB Inc [28] and the MANOVA procedure of SPSS-X [29]. To calculate joint a posteriori univariate contrasts for comparison of adjusted estimates for adjacent dates the subcommand CONTRAST = REPEATED of the SPSS MANOVA command was employed [30]. Additional analyses were performed with the “manova” and “regress” commands of Stata followed with “margins” and “contrasts” estimation and post- estimations commands [31].
Results
Traditional indexes mean monthly values for Kr and for 106 multiplied and natural logarithm transformed HSI and GSI figures (to improve symmetry and homoscedasticity), besides a t test for Kr = 1 (“ideal” relative condition) are presented in (Table 1) (males), (Table 2) (females) and (Table 3) (individuals of indeterminate sex); level (mean or median) monthly parametric (Student t) or nonparametric (Kruskal-Wallis) comparisons are shown in Table 4.
- Tampamachoco Lagoon. “Ideal” condition (Kr = 1) test for each date is included.
- Date
- N
- Kr t-Student test Ho: µ = 1
- HSI
- GSI
- T
- P
- May-90
- 53
- 1.09
- 5.18
- 0
- 14
- 13.3
- Jun-90
- 153
- 1
- 0.85
- 0.4
- 13.5
- 12.4
- Jul-90
- 110
- 1.01
- 1.03
- 0.31
- 13.5
- 12.3
- Oct-90
- 218
- 0.99
- -1.44
- 0.15
- 13.7
- 12.7
- Nov-90
- 239
- 0.98
- -2.59
- 0.005
- 13.5
- 12.7
- Jan-91
- 12
- 1.02
- 0.95
- 0.36
- 13.9
- 13.3
- Feb-91
- 13
- 1.03
- 1.15
- 0.27
- 13.8
- 13.4
- Mar-91
- 20
- 1.03
- 1.72
- 0.05
- 13.7
- 13.2
- Apr-91
- 442
- 1.02
- 4.59
- 0
- 13.6
- 13.1
- May-91
- 138
- 0.98
- -2.37
- 0.009
- 13.7
- 12.6
- Jun-91
- 27
- 1.01
- 0.8
- 0.43
- 13.8
- 12.8
- Total
- 1425
- 1
- 2.33
- 0.009
- 13.6
- 12.8
Table 1: Monthly means of Kr and 106 multiplied and e-log transformed HSI and GSI values for females of B. chrysoura at
- Tampamachoco Lagoon. “Ideal” condition test (Kr = 1) for each date is included.
- Date
- N
- Kr t-Student test Ho: µ = 1
- HSI
- GSI t
- P
- May-90
- 47
- 1.02
- 1.83
- 0.04
- 13.97
- 14.08
- Jun-90
- 65
- 1.03
- 1.28
- 0.2
- 13.56
- 12.51
- Jul-90
- 48
- 1.04
- 2.25
- 0.01
- 13.66
- 12.4
- Oct-90
- 80
- 1.01
- 0.7
- 0.49
- 13.6
- 12.68
- Nov-90
- 116
- 0.98
- -1.66
- 0.04
- 13.52
- 12.72
- Jan-91
- 20
- 1.02
- 1.02
- 0.32
- 13.71
- 13.51
- Feb-91
- 8
- 1.05
- 1.52
- 0.17
- 13.83
- 13.75
- Mar-91
- 14
- 0.99
- -0.34
- 0.74
- 13.78
- 13.52
- Apr-91
- 405
- 1.01
- 2.53
- 0.005
- 13.59
- 13.53
- May-91
- 67
- 0.96
- -3.56
- 0.003
- 13.69
- 12.71
- Jun-91
- 8
- 0.94
- -2.19
- 0.03
- 13.79
- 13.45
- Total
- 877
- 1.01
- 1.74
- 0.04
- 13.62
- 13.18
Table 2: Monthly means of Kr and 106 multiplied and e-log transformed HSI and GSI values for individuals with indeterminate
Date N Kr t-Student test Ho: µ = 1 N IHS t P May, 90 423 0.96 -3.91 0.001 409 13.52 June, 90 660 1.01 1.46 0.15 655 13.48 July, 90 181 1.07 6.09 0 180 13.61 October, 90 1257 1.02 3.73 0.001 1255 13.38 November, 90 1475 0.99 -1.98 0.02 1448 13.48
| January, 91 | 197 | 0.99 | -1.63 | 0.53 | 193 | 13.76 |
|---|---|---|---|---|---|---|
| February, 91 | 110 | 1 | -0.24 | 0.81 | 109 | 13.69 |
| March, 91 | 233 | 1.03 | 3.47 | 0.003 | 231 | 13.76 |
| April, 91 | 942 | 1.03 | 6.82 | 0 | 935 | 13.56 |
| May, 91 | 955 | 1.01 | 1.3 | 0.19 | 945 | 13.66 |
| June, 91 | 759 | 1.06 | 7.47 | 0 | 752 | 13.53 |
| Total | 7,192 | 1.01 | 6.89 | 0 | 7,112 | 13.53 |
Table 3: Comparison tests for Kr, GSI and HSI, males of B. chrysoura at Tampamachoco Lagoon.
The indexes (Kr, HSI and GSI) value variations by sex along the study period are represented by boxplots (Figures 2-4). To more clearly appreciate the variations, the outlier values were not included.
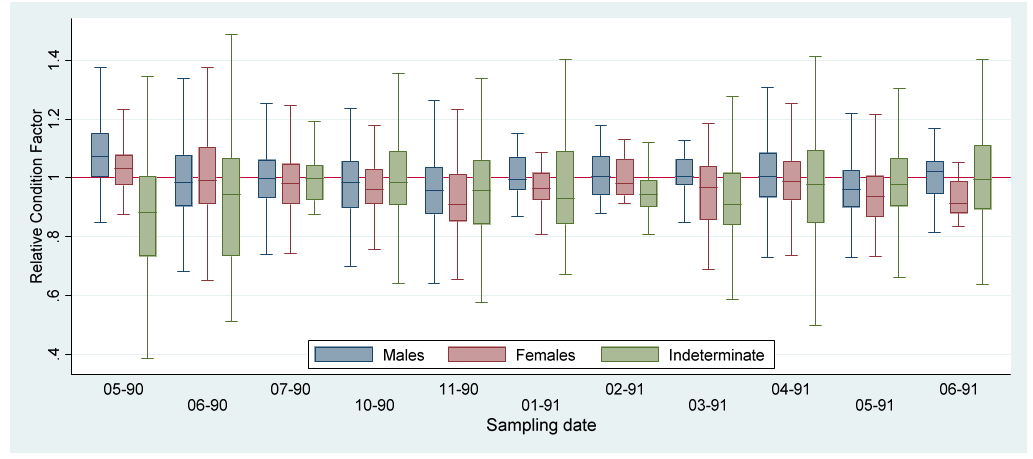
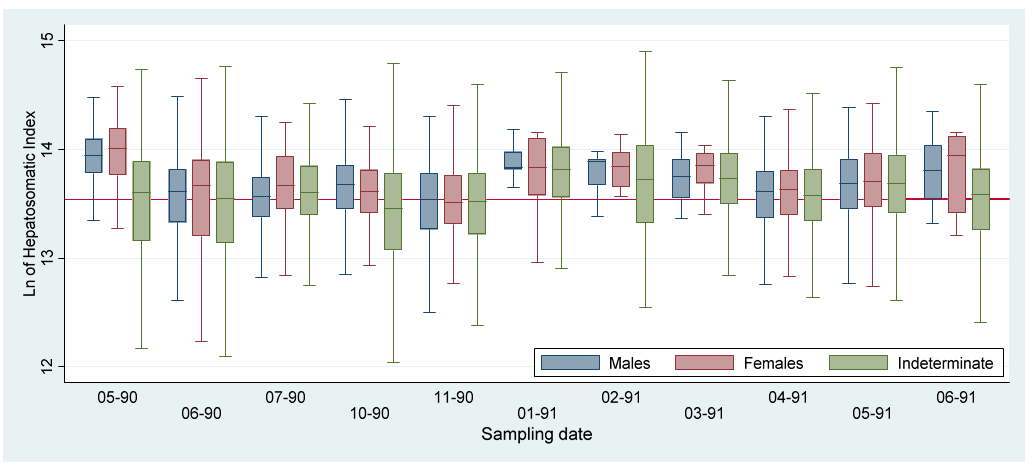
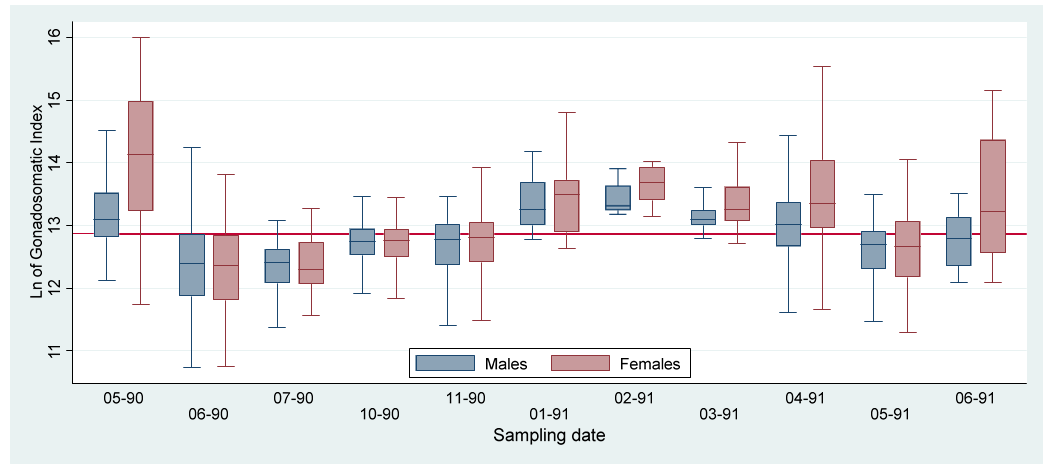
Table 4: Comparison tests for Kr, GSI and HSI, males of B. chrysoura at Tampamachoco Lagoon.
| Date interval | Males | Females | Indeterminate sex | |||||
|---|---|---|---|---|---|---|---|---|
| Kr (B) | HSI (KW) | GSI (KW) | Kr (KW) | HSI (KW) | GSI (KW) | Kr (KW) | HIS (KW) | |
| MAY – JUN, 90 | 0.005* | 6.95* | 7.47* | 0.19 | 4.64* | 8.10* | 5.27* | 0.98 |
| JUN - JUL 90 | 1 | 0.63 | 2.30* | 0.94 | 0.5 | 1.58 | 4.57* | 2.10* |
| JUL – OCT 90 | 1 | 2.94* | 6.13* | 1.61 | 0.68 | 2.21* | 5.27* | 4.52* |
| OCT - NOV 90 | 1 | 4.23* | 0.15 | 1.46 | 1.81 | 0.57 | 4.43* | 3.09* |
| NOV, 90 – JAN, 91 | 1 | 3.96* | 3.27* | 1.37 | 2.98* | 3.96* | 0.16 | 8.17* |
| JAN – FEB, 91 | 1 | 0.69 | 1.03 | 0.67 | 0.47 | 0.89 | 0.38 | 1.79 |
| FEB – MAR, 91 | 1 | 0.84 | 1.16 | 1.42 | 0.27 | 0.91 | 2.63* | 1.37 |
| MAR – APR, 91 | 1 | 1.72 | 1.73 | 0.95 | 2.11* | 0.07 | 0.69 | 5.74* |
| APR – MAY, 91 | 0.002* | 2.15* | 7.38* | 3.95* | 2.11* | 7.46* | 4.90* | 5.15* |
| MAY – JUN, 91 | 1 | 2.10* | 1.38 | 0.51 | 0.72 | 2.06* | 6.74* | 5.52* |
| KW = Kruskal-Wallis Z test; * = Z > 1.9600, P < 0.05; B = Bonferroni; * = P < 0.05 |
Table 5: Joint a posteriori univariate tests for adjacent date means of eviscerated (EW), gonad (GW) and liver (LW) weights adjus
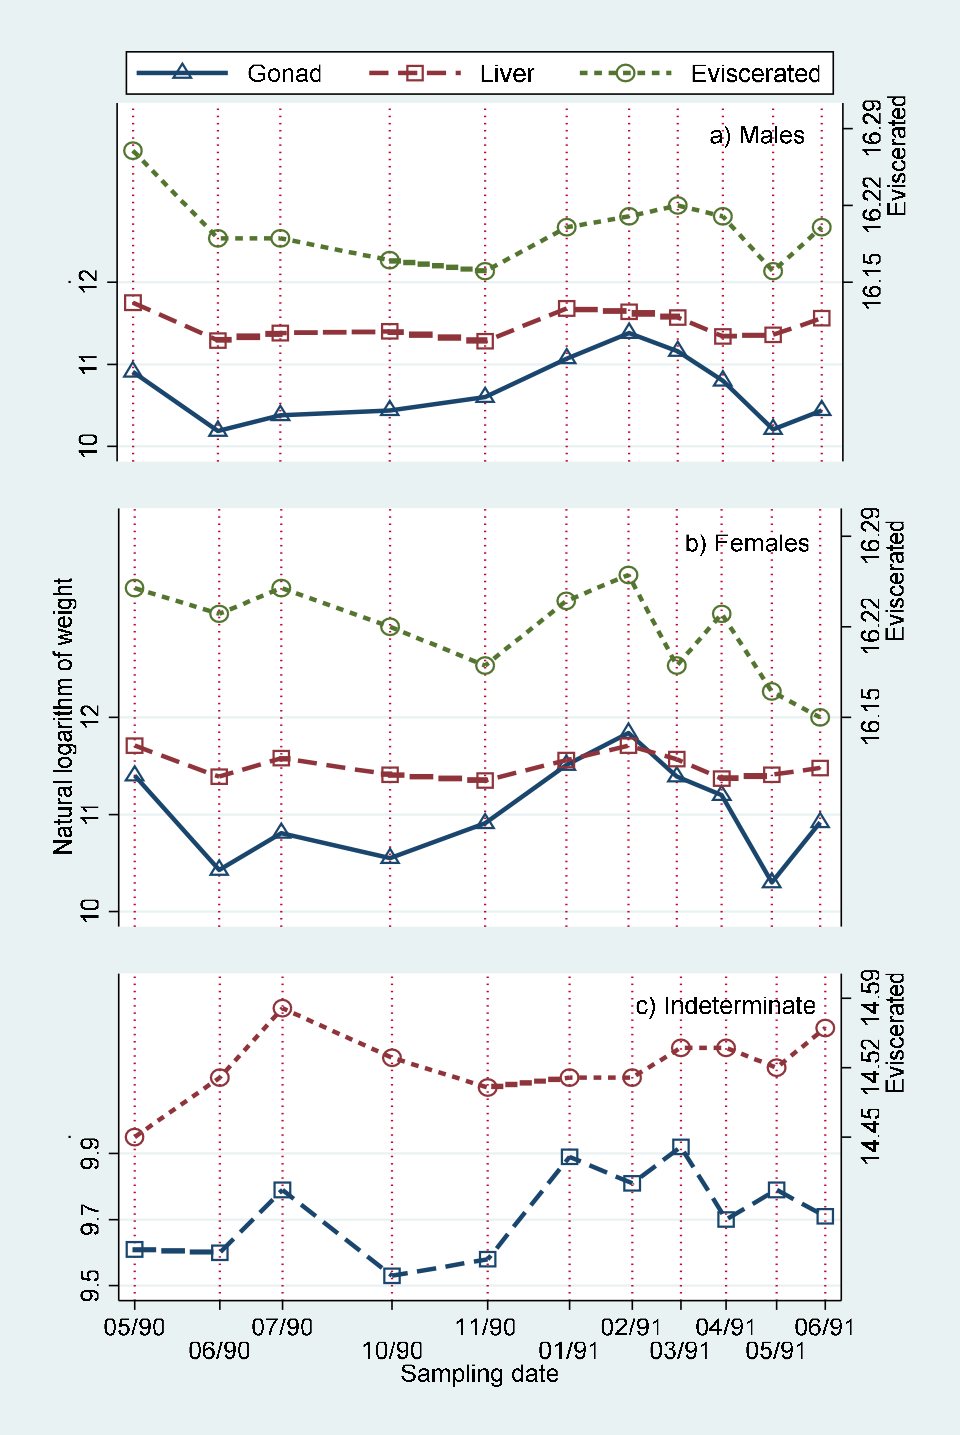
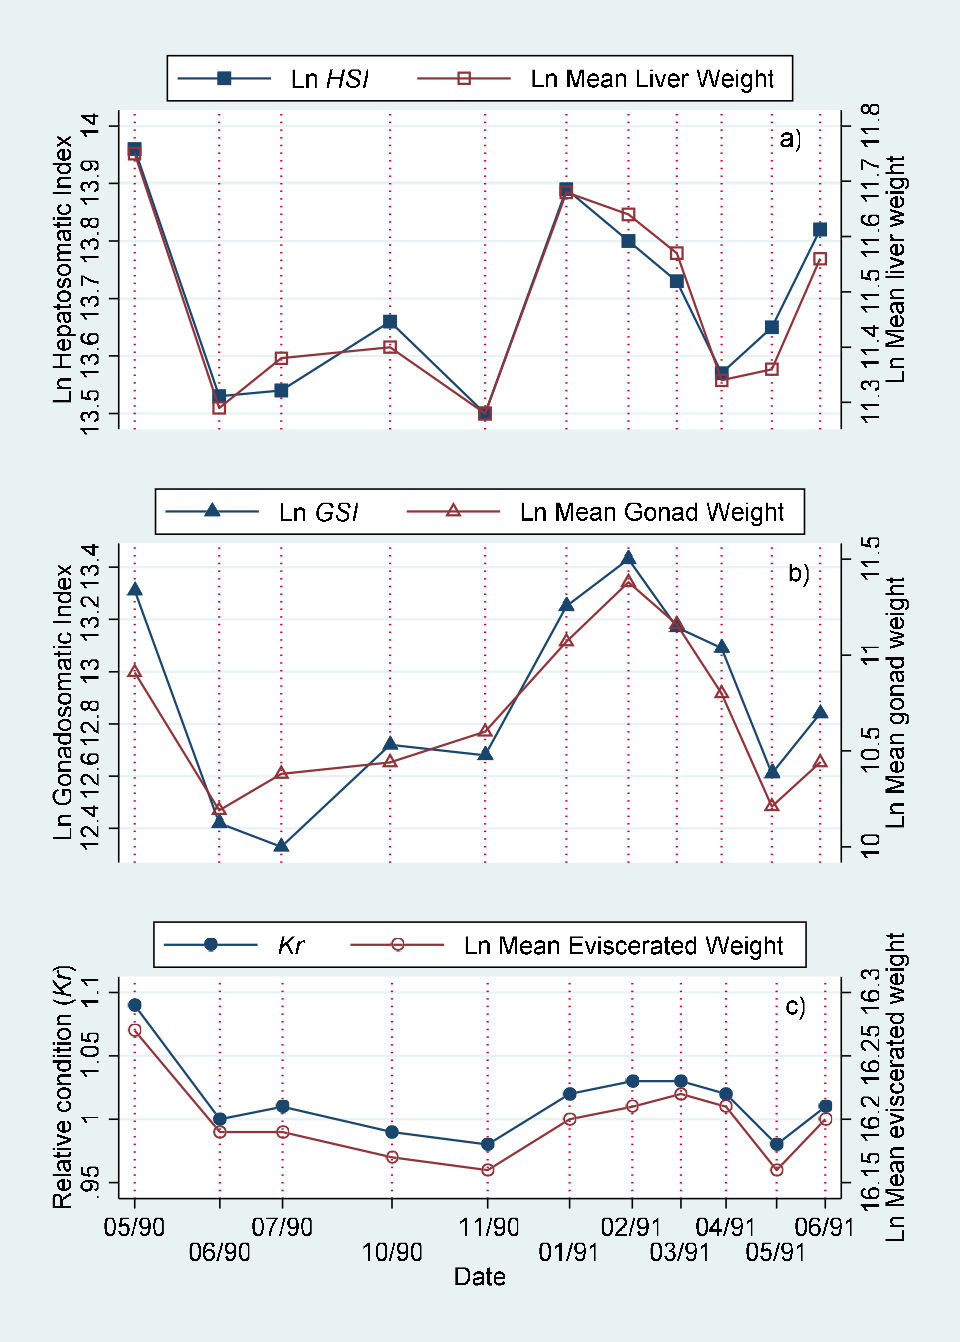
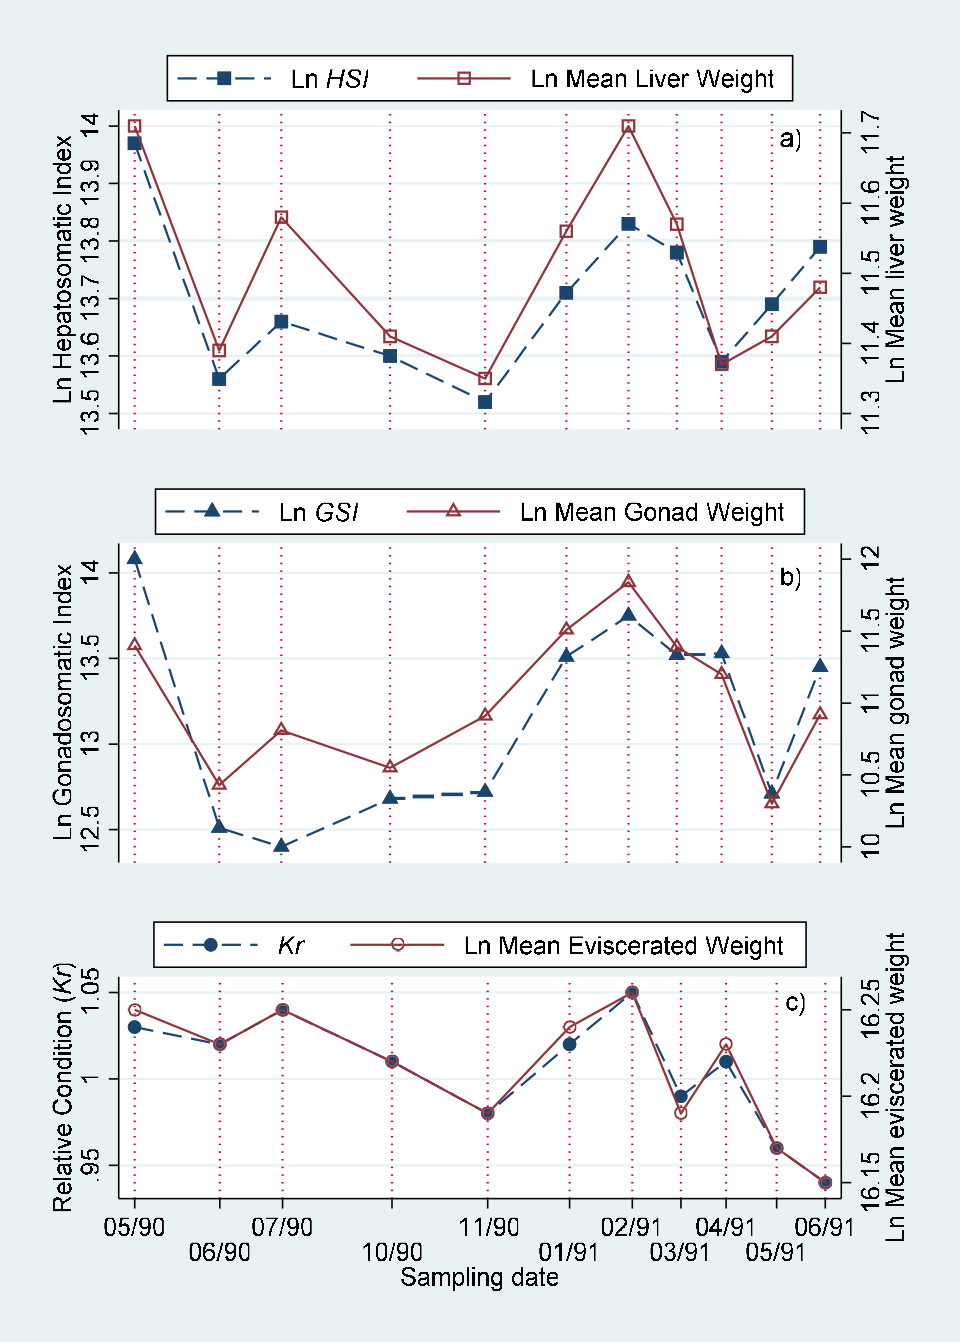
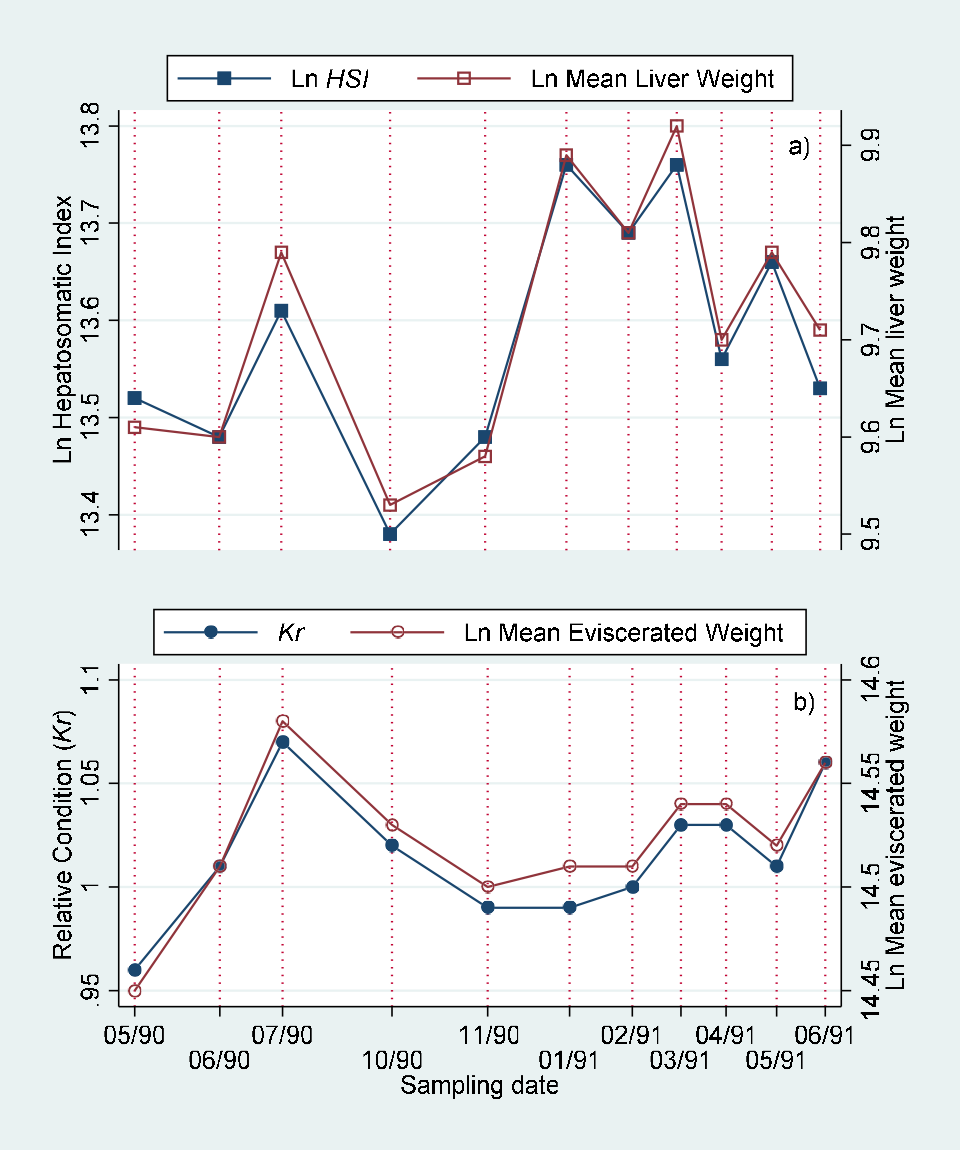
Monthly values of body length adjusted means of eviscerated, gonad and liver weight for males, females and indeterminate sex individuals are included in (Table 5). These values are represented in (Figure 5). The comparison of monthly values by joint “a posteriori” univariate tests for adjacent date means of eviscerated, gonad and liver weights adjusted by standard body length by sex are presented in Table 6. The comparison of monthly values of hepatosomatic index (HSI) with adjusted liver mean weight, gonadosomatic index with adjusted gonad mean weight and relative condition with adjusted mean weight are showed in (Figure 6) (males), (Figure 7) (females) and (Figure 8) (indeterminate sex individuals). The quantitative version of the relationship from these graphs is presented as correlation figures for males, females and indeterminate sex individuals in Table 7.
| Date | Males | Females | Indeterminate sex | |||||
|---|---|---|---|---|---|---|---|---|
| EW | GW | LW | EW | GW | LW | EW | LW | |
| May, 90 | 16.27 | 10.91 | 11.75 | 16.25 | 11.4 | 11.71 | 14.45 | 9.61 |
| June, 90 | 16.19 | 10.19 | 11.29 | 16.23 | 10.43 | 11.39 | 14.51 | 9.6 |
| July, 90 | 16.19 | 10.38 | 11.38 | 16.25 | 10.81 | 11.58 | 14.58 | 9.79 |
| October, 90 | 16.17 | 10.44 | 11.4 | 16.22 | 10.55 | 11.41 | 14.53 | 9.53 |
| November, 90 | 16.16 | 10.6 | 11.28 | 16.19 | 10.91 | 11.35 | 14.5 | 9.58 |
| January, 91 | 16.2 | 11.07 | 11.68 | 16.24 | 11.51 | 11.56 | 14.51 | 9.89 |
| February, 91 | 16.21 | 11.38 | 11.64 | 16.26 | 11.84 | 11.71 | 14.51 | 9.81 |
| March, 91 | 16.22 | 11.16 | 11.57 | 16.19 | 11.39 | 11.57 | 14.54 | 9.92 |
| April, 91 | 16.21 | 10.8 | 11.34 | 16.23 | 11.2 | 11.37 | 14.54 | 9.7 |
| May, 91 | 16.16 | 10.21 | 11.36 | 16.17 | 10.3 | 11.41 | 14.52 | 9.79 |
| June, 91 | 16.2 | 10.44 | 11.56 | 16.15 | 10.92 | 11.48 | 14.56 | 9.71 |
Table 6: Joint a posteriori univariate tests for adjacent date means of eviscerated (EW), gonad (GW) and liver (LW) weights adjus
| Date | EW | GW | LW | EW | GW | LW | EW | LW |
|---|---|---|---|---|---|---|---|---|
| MAY – JUN, 90 | 0.000* | 0.000* | 0.000* | 0.558 | 0.000* | 0.000* | 0.000* | 0.798 |
| JUN – JUL, 90 | 0.88 | 0.014* | 0.086 | 0.421 | 0.006* | 0.017* | 0.000* | 0.000* |
| JUL – OCT, 90 | 0.259 | 0.377 | 0.719 | 0.198 | 0.048* | 0.027* | 0.000* | 0.000* |
| OCT – NOV, 90 | 0.276 | 0.005* | 0.001* | 0.058 | 0.001* | 0.353 | 0.001* | 0.011* |
| NOV, 90 – JAN, 91 | 0.159 | 0.007* | 0.000* | 0.101 | 0.001* | 0.033* | 0.866 | 0.000* |
| JAN – FEB, 91 | 0.929 | 0.201 | 0.763 | 0.567 | 0.284 | 0.385 | 0.964 | 0.24 |
| FEB – MAR, 91 | 0.985 | 0.307 | 0.608 | 0.182 | 0.158 | 0.441 | 0.058 | 0.088 |
| MAR – APR, 91 | 0.921 | 0.008* | 0.013* | 0.289 | 0.339 | 0.075 | 0.999 | 0.000* |
| APR – MAY, 91 | 0.000* | 0.000* | 0.657 | 0.001* | 0.000* | 0.482 | 0.001* | 0.000* |
| MAY – JUN, 91 | 0.135 | 0.056 | 0.014* | 0.704 | 0.020* | 0.652 | 0.000* | 0.002* |
Table 7: Correlation among traditional morphometric indexes (Kr, HSI, GSI) and eviscerated (EW), gonad (GW) and liver (LW) weight
| Males | Females | Indeterminate | |
|---|---|---|---|
| Kr-EW | 0.9869 | 0.9872 | 0.974 |
| Kr-GW | 0.9123 | 0.8275 | - |
| Kr-LW | 0.9648 | 0.8645 | 0.9747 |
Discussion and Conclusion
Relative condition factor mean values for each subpopulation in the sample (males, females and indeterminate) were slightly over the unity reference value (Tables 1-3), indicating that fish relative condition was a little more than the average (Kr = 1).
The GSI increments in May 1990 and February 1991 (Fig. 4) indicates two reproductive pulses during the study period. These values occurred in conjunction with low mean values for Kr and HSI (Figures 2&3; Tables 1&2), indicating the main assignation of metabolism energy to the gametogenesis. According to the morphometric indexes the reproductive period seems to last from April to May, once a year, during the dry season. The recovering of reproductive individuals, maturation and growth of the juveniles occurred during the rest of the year. The increments of HSI during the last part of the rainy and the beginning of the dry seasons may be due to the increase of food availability by the nutrient enrichment of the waters caused by the previous rains [32].
The reproductive period of B. chrysoura here registered is in accordance with those found by different research workers: Chavance P, et al. [18] reported reproduction activity from February to July at Términos Lagoon, Mexico. In the submerged grasses of this lagoon, Sanchez-Iturbide A, et al. [19] registered spawning of this species from January to October (1980), with maximum intensity from May to July; Johnson GD, et al. [33] based on reports for several coastal localities in the U.S. observed an increase of the spawning season in function of the latitude, being shorter during summer in the northern temperate localities (New Jersey) and longer (practically all over the year) towards the more tropical Southern places (Florida). According to Grammer LG, et al. [20] B. chrysoura reproduces intensely from March to June at the central estuaries of northern Gulf of Mexico, Chesapeake Bay Hildebrand SF, et al. [34], and Florida Mok H, et al. [35].
The mean values of eviscerated, gonad and liver weights adjusted by standard body length during the study period (Table 5), showed the existence of the last part of the reproductive period of 1990 besides the one occurred from February to May of 1991, corroborating the finding that B. chrysoura reproduces once a year before the arriving of the rainy season.
Moreover, it is interesting to note that the mean values for males showed clearer evidence of the energy demand from the gonads on the liver and somatic structures during the reproductive period from February to May of 1991, than those from the females which presented somatic variation similar to that of the gonads (Figure 5; Tables 5&6).
The traditional morphometric indexes showed significant high correlations with the adjusted means resulting from the MANCOVA both for males and females, but nonsignificant for the individuals with indeterminate sex (Figures 6&7; Table 7). The Kr decreased while the HSI increased during the rainy and “Nortes” (during winter) seasons. The adjusted means both for eviscerated and liver weight showed a similar variation, that is, were higher during the rainy season. The adjusted means may be a more adequate method to estimate the condition in the individuals with indeterminate sex as these values are not affected for length variation in the sample [1, 24, 25] (Figure 8, Table 7).
In general the MANCOVA adjusted means showed a monthly variation similar to that from the traditional rate indexes, but with the advantage of not being affected by the individual size of the specimens. Therefore we consider that these mean values are important tools in examining the reproductive stages of the species.
Author Contribution
All authors have read and agreed to the published version of the manuscript.
Funding
Salgado-Ugarte I.H. received support from the Departamento de Biología, UAMI during his stay as a visiting professor (Dr. Ramón Riba y Nava Esparza professorship), from DGAPA-FES Zaragoza-ICMyL, PAPIME PE206213, RL200316, PE207417; PE209120; PE204822; PAPIIT IG201215, and from División de Investigación y Estudios de Posgrado, FES Zaragoza.
Acknowledgment
This report is part of the PhD studies of Pérez Hernández M.A. who is grateful to the Posgrado en Ciencias Biológicas, Universidad Nacional Autónoma de México (UNAM) and to the Universidad Autónoma Metropolitana Iztapalapa (UAMI).
Conflicts of Interest
The authors declare no conflict of interest.
References
-
García Berthou E, Moreno Amich R (1993) Multivariate analysis of covariance in morphometric studies of the reproductive cycle. Can J Fish Aquat Sci 50: 1394-1399.
-
DeVlaming, V, Grossman G, Chapman R (1982) On the use of the gonosomatic index. Comp Biochem Phys A 73(1): 31-39.
-
Erickson DL, Hightower JE, Grossman GR (1985) The relative gonadal index: an alternative index for quantification of reproductive condition. Comp Biochem Phys 81(1): 117-120.
-
Bolger T, Conolly PL (1989) The selection of suitable indices for the measurement and analysis of fish condition. J Fish Biol 34(2): 171-182.
-
Cone RS (1989) The need to reconsider the use of condition indices in Fishery Science. T Am Fish Soc 118(5): 510-514.
-
Patterson KR (1992) An improved method for studying the condition of fish, with an example using Pacific sardine _Sardinops sagax_ (Jenyns). J Fish Biol 40(6): 821- 831.
-
Sutton SG, Bult TP, Haedrich RL (2000) Relationships among fat weight, body weight, water weight, and condition factors in wild Atlantic Salmon Parr. T Am Fish Soc 129(2): 527-538.
-
Pope KL, Kruse CG (2007) Condition. In Analysis and Interpretation of Freshwater Fisheries Data. Chapter 10, pp: 423-471.
-
Blackwell BG, Brown ML, Willis DW (2000) Relative weight (Wr) status and current use in fisheries assessment and management. Rev Fish Sci 8(1): 1-44.
-
Ogle DH (2016) Introductory Fisheries Analyses with R. CRC Press. Boca Raton, FL USA, pp: 317.
-
Castro Aguirre JL (1978) Systematic catalog of the marine fish that penetrate the continental waters of Mexico with zoogeographical and ecological aspects. AGRIS 19: 1-298.
-
Rosado Solórzano R (1995) Modelo de la Dinámica trófica en la laguna Tampamachoco Veracruz México. Bachellor Thesis. IPN, Mexico, pp: 44.
-
Pérez Hernández MA, Castillo Rivera MA, Kobelkowsky A (1988) Study of the biology of _bairdiella ronchus_ (_pisces:_ _sciaenidae_) from tampamachoco lagoon, veracruz, mexico. Universidady Ciencia 5(10): 69-84.
-
Sobocinski LK, Latouri RJ (2015) Trophic transfer in seagrass systems: estimating seasonal production of an abundant seagrass fish, _Bairdiella chrysoura_, in lower Chesapeake Bay. Mar Ecol Prog Ser 523: 157-174.
-
Hanke MH, Smith KJ (2011) Tolerance and response of silver perch _Bairdiella chrysoura_ to hypoxia. Aquat Biol 14: 77-84.
-
Franco López J, Escobedo Báez L, Abarca Arenas BG, Bedia Sánchez C, Silva López G, et al. (2018) Seasonal behavior of the ichthiofauna in the mouth of communication of the rivers associated with laguna de alvarado, veracruz, Mexico. The Biologist (Lima) 16(1): 139-158.
-
Kimball ME, Boswell KM, Lawrence PR, Berwaldt EK, Richards AR (2018) Swimming abilities of juvenile estuarine fishes: implications for passage at water control structures, Wetl Ecol Manag 26(3): 383-390.
-
Chavance P, Flores Hernández D, Yañez Arancibia A, Amezcua Linares F (1984) Ecología, biología y dinámicas de las poblaciones de _Bairdiella chrysoura_, en la laguna de Términos, sur del Golfo de México, (_Pises: Sciaenidae_). An Inst Cienc Mar Limnol UNAM 11: 123-162.
-
Sánchez Iturbide A, Flores Coto C (1985) Estimación de la biomasa de _Bairdiella chrysoura_ por medio del censo de huevos y algunos aspectos de sus primeros estadios, laguna de Términos, Campeche (Pisces: Sciaenidae). An Inst Cienc Mar Limnol UNAM Contribución 477: 21.
-
Grammer LG, Brown Peterson NJ, Peterson MS, Comyns BH (2009) Life History of Silver Perch _Bairdiella_ _chrysoura_ (Lacepède, 1803) in North-Central Gulf of Mexico Estuaries. Gulf of Mexico Science 27(1): 62-73.
-
Waggy GL (2004) Life history of silver perch, _Bairdiella_ _chrysoura_, from the north-central Gulf of Mexico. Master’s Thesis. The University of Southern Mississippi, Hattiesburg, Mississippi USA, pp: 75.
-
Waggy GL, Brown Peterson NJ, Peterson MS (2006) Evaluation of the reproductive Life History of the Sciaenidae in the Gulf of Mexico and Caribbean Sea: “Greater” versus “Lesser” Strategies? 57th Gulf and Caribbean Fisheries Institute, pp: 263-281.
-
Monczak A, Berry A, Kehrer C, Montie EW (2017) Long- term acoustic monitoring of fish calling provides baseline estimates of reproductive timelines in the May River estuary, southeastern USA. Mar Ecol Prog Ser 581: 1-19.
-
Salgado Ugarte IH (1995) Nonparametric Methods For Fisheries Data Analysis And Their Application In Conjunction With Other Statistical Techniques To Study Biological Data of The Japanese Sea Bass _Lateolabrax_ _japonicus_ In Tokyo Bay. PhD Thesis, University of Tokyo Japan, pp: 239-268,
-
Salgado Ugarte IH, Gómez Márquez JL, Peña Mendoza B (2005) Métodos actualizados para análisis de datos biológico-pesqueros. Facultad de Estudios Superiores Zaragoza, UNAM México, pp: 240.
-
Strickland JDH, Parsons TR (1972) A Practical Handbook of Seawater Analysis. 2nd ed. Fisheries Research Board of Canada, Bulletin 167: 310.
-
Stearns SC (1983) A natural experiment in life-history evolution: field data on the introduction of mosquitofish (_Gambusia affinis_) to Hawaii. Evolution 37(3): 601-617.
-
(2013) MINITAB Inc.. MINITAB Statistical Software, Release 17 for Windows, State College, Pennsylvania., USA.
-
(1986) SPSS Inc. SPSS -X user’s guide. SPSS Inc., Chicago Ill, USA, pp: 476-551.
-
Norusis MJ (2005) SPSS 13.0 Guide to Data Analysis. Prentice Hall, Englewood USA, pp: 649.
-
(2013) StataCorp. Stata: Release 13. Statistical Software. StataCorp LP, College Station, USA.
-
Contreras F (1985) Las lagunas Costeras Mexicanas. Ed. Centro de Ecodesarrollo Secretaria de Pesca. México, pp: 253.
-
Johnson GD (1978) Development of fishes of the Mid- Atlantic Bight. An atlas of egg, larval and juvenile stages. Carangidae through Ephippidae. U.S. Fish and Wildlife Service, FWS/OBS, 78/12 4: 314.
-
Hildebrand SF, Cable LE (1930) Development and life history of fourteen teleostean fishes of Beaufort, North Carolina. Bull US Bur Fish 46(1): 383-499.
-
Mok H, Gilmore RG (1983) Analysis of sound production in estuarine aggregations of _Pogonias cromis_, _Bairdiella_ _chrysoura_, and _Cynoscion nebulosus_ (_Sciaenidae_). Bull Inst Zool Acad Sin 22(2): 157-186.
- California Red-Legged Frog and Non-Listed Amphibians Response to Non-Native Fish Removal
- Industrial Standardization of the Bio-OS: Algorithmic Codification of Resilience Engineering Guidelines and Version V8 Architecture
- Climate Variability and the Sustainability of Snail Farming in Nigeria: Past Trends, Present Challenges and Potential Outlook
- The Evaluation of the Surveillance System of Anthrax in Gilgit-Baltistan, Pakistan, 2018
- Natural Decline to Extinction of A New Zealand Rabbit Population
- Mitochondrial Bio-Logistics: Steering Co-Enzyme Q10 and Lycopene Synergies within the Science 4.0 Bio-OS Framework