Assessment of Physicochemical Parameters of Water in Puliyanthangal Lake of Ranipet, Tamilnadu, India
The present investigation is centered on the Physicochemical characteristic features in water samples collected from the Puliyanthangal lake of Ranipet region which is suspected to be influenced by the intrusion of tannery effluents and domestic waste by direct and indirect means. Monthly water samples were collected at station 1 and station 2 from the Puliyanthangal lake of Ranipet area for the period of one year from May 2016 to April 2017. The range of physio-chemical parameters such as appearance (turbid/clear), colour (colourless/green), odour (none), total dissolved solids (265-1553), turbidity (0.9 - 13.17 ), electrical conductivity (76-782 Mhc), PH (6.85-7.93), dissolved oxygen (4.73-22.50 ), calcium (46.33-152), magnesium (12.10- 36.33), sodium (211-296), potassium (0.30-24.26), iron (0.02-0.49), manganese (0.01-0.29), free ammonia (0.04-1.14), nitrite (0.01-1.37) nitrate (6-41), sulphate (19.5-234) and phosphate (0.03-3.88) were recorded and discussed. Unit of the chemical parameters is represented as mg/l and physico-chemical parameters were estimated using the standard method of APHA (2005). The data was analyzed using two way ANOVA. However, escalation of physicochemical variables was noticed only in sampling station 1 and this may be due to the entry points to receive the high amount organic load from the discharge of tannery effluents and domestic wastes by direct or indirect means. It is suggested from this study that these biotopes are to be conserved from the intrusion of pollutants so that the biodiversity of the ecosystem would be sustained.
Introduction
Water nutrients in the form of organic and inorganic compounds are very much essential to the organisms depends upon the water since it is a universal solvent. Well growth of the plants and animals are very well ascertained mainly on the basis of the quality of the water and thus, physicochemical parameters of water favours for the productivity in all the aspect is concerned, over organic load due to pollution affect the health of the organisms as reported by many investigators [1, 2, 3].
Water contamination is known to be progressed by industrialization, human population fertilizers use in agriculture and manmade attitudes, etc. Contaminants like viruses, bacteria, nitrates, heavy metals, and salt have polluted water supplies as a result of disposal of waste from humans and inadequate treatment and livestock, domestic discharge, industrial discharges and extensive use of limited water resources [4]. There are a number of reported cases of diarrhea, typhoid and also with other water related diseases originating from the consumption of contaminated water. Now a days, contaminated water kills more people than AIDS, cancer, wars, accidents or terrorism [3]. Water quality parameters is found to be varied season wise with the factors of domestic sewage, human activities of agriculture urbanization, etc in the catchment area result in poor water quality. Dissolved oxygen, turbidity, temperature, nutrients, hardness, alkalinity are some of the essential factors for the growth of living organisms in the biotopes. Biotic and abiotic factors in ecosystem are mainly characterized by biological and microbial diversity with the imparts of physicochemical parameters as to determine the water quality [5, 6].
Lakes is an important ecosystem to determine the survival of the living organism in the Earth. Limited material mobility occurs in lakes unlike oceans and rivers. The bottom of lake gets progressively received the sediments from the catchment area. As reported by many investigators, sustainable ecosystem characterized by biological, chemical and physical variables provides the optimum growth of the living organisms [7, 8]. Aquatic ecosystems are highly beneficial resources to the human being for recreational use, municipal and industrial purposes [9]. Ranipet area of Tamilnadu is the place for the hub of many tannery industries and it has many small and big water body reservoirs around the place for the daily usage of human being, irrigation, etc. Puliyanthangal lake is the biggest water bodies in that area. Since the tannery industrial works is prevalent one, the lake water has become advantageous to subject for contamination and there by biodiversity of the ecosystem is likely to be affected. To realize the importance of work, the present work has been attempted on this biotope to assess the water quality parameters.
Material and Methods
Study Areas
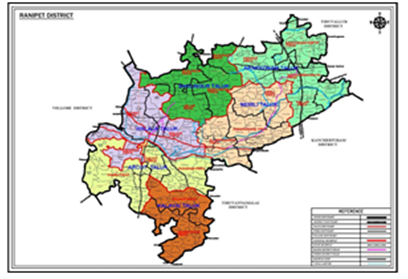
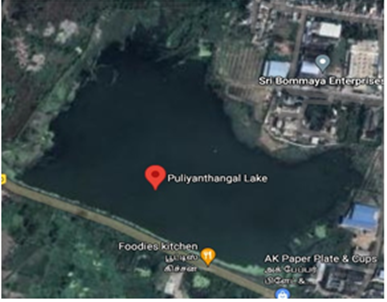
Collection place of Puliyanthangal lake is located at Ranipet of Ranipet district (Figures 1-4) and the core activities of the district is leather processing and other industrial oriented works like BHEL (Bharat Heavy Electricals Limited). It is located 115 kilometers away from west of Chennai (Lat. 12.20’N; Long. 78.83’E). Total area of this lake is 29.92 hectares and mainly imparts for fishery activities. Since it is at leather industrial area of Ranipet, the water body receives tannery as well as domestic wastes.
Sampling Sites
For convenient monitoring, systematic field study and regular sampling of water and soil samples, two permanent sampling stations were fixed in the lake one at mouth region and another at middle regions. The present study was covered for one year from May, 2016 to April 2017 in Puliyanthangal lake and two sampling stations of S1and S2, were selected. Puliyanthangal lake is seemed to receive domestic waste and industrials waste from tannery industries around the lake and the intrusion of tannery effluents is suspected to be more in the lake water. Entry point of the lake is station 1 and middle part of the lake is station 2. It was separated by 1 kilometer each of them.
Sample Collection
The monthly water samples were collected from the lake for one year from May 2016 to April 2017. The physicochemical variables of water sample were analyzed as per standard methods of APHA [10]. The physicochemical parameters of water analyzed were appearance, colour, odour, total dissolved solids, turbidity, pH, electrical conductivity, dissolved oxygen, magnesium, sodium, iron, potassium, manganese, calcium, free ammonia, nitrite, nitrate, sulphate and phosphate. Statistical analysis was done using two way ANOVA. Following figures are the sampling station of Puliyanthangal lake at stations 1 and 2 (Figures 1-4).
Results and Discussion
Diversity of the organism and physicochemical parameters of the water are the main basis for the aquatic ecosystem [11, 12, 13]. Water samples collected during one-year period (2016-2017) from the Puliyanthangal lake of Ranipet area were analyzed and discussed. The physical appearance of the water samples at station 1 was clear in August, September and November, 2016 and February, March and April, 2017 and during other months it was turbid. In water sample 2, the physical appearance of the water samples in August, November and December, 2016 and January, 2017 was clear and other months it was turbid. It is well known that appearance and transparency of water is negatively proportional to primary productivity. The appearance of water varied from clear to turbid or muddy during the study period. This similar trend of colour variation was noticed by Devaraju, et al. [14], Garg, et al. [15] and are also given by BIS [16] specification. The colour of the water samples at Puliyanthangal Lake was colourless from May, 2016 to April, 2017 except in the month of January the colour of the water samples was colourless in both the water samples 1and 2. In January, colour of the water samples both at 1 and 2 was seen as greenish.
The amount of dissolved organic chemicals determines the colour of the lake and the dissolved organic chemicals containing the contaminated water with the high load of phosphorus and nitrogen leads to the algal and weed growth and it also might be due to the organic substances of manganese, iron, industrial waste and humic [17, 18]. Evidently, Puliyanthangal lake is likely to be polluted by industrial effluents and sewage from the surrounding area. Water samples collected from station I and II showed odourless. The odour of the lake water was one throughout the study period. These results show that most of the sources of odour and taste was agreeable [16] (Tables 1-4).
| Physical Examination | May | June | July | August | Septe mber | October | Nove mber | December | January | February | March | April |
|---|---|---|---|---|---|---|---|---|---|---|---|---|
| Appearance | Turbid | Turbid | Turbid | Clear | Clear | Turbid | Clear | Turbid | Turbid | Clear | Clear | Clear |
| Colour (pt.co-scale) | Colour lesss | Colour less | Colour less | Colour less | Colour less | Colour less | Colour less | Colour less | Greenish | Colour less | Colour less | Colour less |
| Odour | ||||||||||||
| Turbidity (NT Units) | 3.17± 0.06 | 3.57 ± 0.06 | 4.07± 0.06 | 4.6± 0.1 | 6.1± 0.1 | 3.67± 0.06 | 3.43± 0.06 | 5.43± 0.06 | 11.33± 0.29 | 2.07± 0.06 | 0.9± 0.00 | 4.27± 0.0 |
| Total Dissolved Solids (mg/l) | 667.33± 19.4 | 276.67± 1.52 | 283.0± 2.65 | 477.67± 2.5 | 1553± 2.65 | 1283± 2.65 | 1287.6± 2.3 | 646± 1.00 | 275.67± 1.15 | 284± 4.00 | 353± 2.65 | 293.67± 1.52 |
| Electrical Conductivity (Micro Mhc) | 122.3± 2.08 | 76.77± 0.75 | 135.67± 5.50 | 230± 5.00 | 223.0± 3.60 | 125.33± 2.51 | 141.67± 2.08 | 782± 2.65 | 408.3± 7.64 | 220± 5.00 | 120± 5.0 | 260± 5.00 |
| Physical Examination | May | June | July | August | Septe mber | October | Nove mber | Dece mber | January | February | March | April |
| Appearance | Turbid | Turbid | Turbid | clear | Turbid | Turbid | clear | Clear | clear | Turbid | Turbid | Turbid |
| Colour (pt.co- scale) | Colour less | Colour less | Colour less | Colour less | Colour less | Colour less | Colour less | Colour less | Greenish | Colour less | Colour less | Colour less |
| Odour | ||||||||||||
| Turbidity (NT Units) | 3.43± 0.06 | 5.43± 0.06 | 11.3± 0.26 | 2.13± 0.06 | 1.2± 0.00 | 4.27± 0.06 | 3.37± 0.06 | 3.57± 0.06 | 3.57± 0.06 | 3.1± 0.1 | 13.17± 0.15 | 3.57± 0.06 |
| Total Dissolved Solids (mg/l) | 645.65± 5.13 | 277.33± 2.51 | 265± 5.00 | 354± 4.00 | 645.67± 5.13 | 775.67± 5.13 | 884± 4.00 | 354± 4.00 | 645.67± 5.13 | 277.33± 2.51 | 284± 4.00 | 354± 4.00 |
| Electrical Conductivity (Micro Mhc) | 77.97± 1.00 | 135.33± 5.03 | 343.00± 3.00 | 492± 2.00 | 370.00± 5.00 | 492± 2.00 | 369.3± 4.04 | 77.1± 0.36 | 137± 2.65 | 342.67± 2.52 | 492± 2.00 | 370± 5.00 |
Table 1: Physical Examination of water samples at station I of Puliyanthangal lake from May, 2016 to April, 2017.
Turbidity of lake in two stations showed the values ranged between 0.9 and 13.17± 0.15. Station I showed the maximum value of 11.33± 0.29 in January, 2017 and the minimum value of 0.9 in March 2017. Station II showed the maximum value of 13.17± 0.15 in March, 2017 and minimum of 1.2 in September, 2016. High value of turbidity content noticed in the present study might be with the presence of over organic load, less light penetration, less transparency, inert particulate matter, sand and silts, etc. Low turbidity may be with high light penetration, water evaporation and clear atmosphere as reported by many investigators [19, 20, 21].
Total Dissolved Solids (TDS) indicate the dissolved and suspended matter of the water. In the present study, the values of TDS in the lakes of two water samples were ranged between 265±5.00 and 1553±2.65. The lowest value of the (275.67± 1.15) of TDS was observed in sample I in January, 2017 and highest vale (1553±2.65) in September, 2016. In the water sample 2, the lowest value (265±5.00) was recorded in July, 2016 and highest value (884±4.00) in November, 2016. High values of total suspended solids noticed in rainy season might be due to the presence of rain water runoff, heavy precipitation, siltation and deterioration, etc [22]. Intrusions of industrial, agricultural and animal wastes and less rain fall and evaporation. might be also the main reasons. As reported by Verma, et al. [23], high osmatic pressure of organism is resulted with high level of dissolved solids. TDS content (1553) in the present study was within the permissible limit and higher than the desirable limit. Permissible limit of TDS is 2000 mg/l. In the present study, the TDS is maximum during rainy season and minimum during summer.
In the present study, electrical conductivity was ranged between 76.77± 0.75 and 782± 2.65. Water sample 1 had highest value of electrical conductivity (782± 2.65 µS/cm) in December, 2016 and the lowest value (76.77±0.75 µS/cm) in June, 2016. Water sample 2 showed the highest value (492± 2.00 µS/cm) in August, 2016 and March, 2017 and the lowest value (77.1± 0.36 µS/cm) in December, 2016. The speedy method of measuring total dissolved solids is electrical conductivity. High level of its content might due to the drainage of domestic sewage during monsoon season and low level with high temperature in summer season [24, 25].
Concentration of pH in water samples ranged between 6.85±0.01 and 7.93±0.15. In water sample 1, the maximum pH value (7.93±0.15) in September, 2016 and minimum value (6.87±0.06) in June 2016. In water sample 2, the maximum value (7.83±0.06) during the month of August, 2016 and minimum value (6.85±0.01) in September 2016 and March, 2017 were noticed. The high pH value in the lake was 7.93 and low pH value was 6.85±0.01. The acceptable limits of pH is from 6.5 to 8.5 On.IS:10500 [26]. Increase of pH is related with the prominent use of alkaline detergents in domestic areas and industrial areas containing alkaline substances as a waste products [27]. Normal water has the pH values between 5.0 and 10.0 [28]. In the present study, the pH value was within the desirable limit (7.93).
The levels of COD in water samples 1 and 2 were ranged between 155.00±3.60 and 286.00±3.60. During the study period, water sample 1 had the highest value of COD (286.00±3.60) in February, 2017 and the minimum value (155.00±3.60) in June, 2016. Water sample 2 showed the highest value (283.00±3.00) in March, 2017 and lowest value (155.00±3.60) in July, 2016. The levels of BOD in water samples 1 and 2 were ranged between 21.43±0.50 and 38.00±1.00 mg/l. During the study period, water sample 1 had the highest value (38.00±1.00 mg/l) in February, 2017 and the lowest value (21.96±0.85 mg/l) in August, 2016.
Water sample 2 showed the highest value (28.56±0.51 mg/l) in July and December, 2016 and lowest value (21.43±0.50 mg/l) in September, 2016. Maximum value of Bio-chemical Oxygen Demand (BOD) was recorded in summer and lowest value in winter during the present investigation. As reported by Bhatt, et al. [24], Devaraju, et al. [14] and Garg, et al. [15], organic decomposition in higher grade is the result of high value of BOD and decrease of temperature with the retards of microbial activity is resulted with low of BOD.
Dissolved oxygen was ranged between 4.33±0.11 and 22.50±0.50. Dissolved oxygen was minimum (4.80±0.10) in July, 2016 and maximum (21.76±0.68) in January, 2017 at water sample 1. Sample 2 showed the maximum value (22.50±0.50) in April, 2017 and minimum value (4.33±0.11) in October, 2016. There should be a good growth of fauna and flora if the value of dissolved oxygen is higher than 5.00 [29]. Calcium level was varied in two water samples between 46.33±2.51 and 152.00±2.00. In water sample 1, the calcium value was maximum (152.00±2.00 mg/l) in February, 2017 and minimum (46.33±2.51 mg/l) in September, 2016. Similarly, at water sample 2, maximum value of calcium (144.33±4.04 mg/l) in August, 2016 and the minimum value (66.00±1.00 mg/l) in October, 2016 and April, 2017.
During the study period, content calcium value was noticed to be high in summer season (152) and low in winter season (66). The desirable limit for calcium in water is 75 mg/l.
Magnesium content was ranged between 12.10±0.17 and 36.33±1.53mg/l in water samples 1and 2. Magnesium and calcium and are reported to be the principal cations that involve hardness [30]. Venkatasubramani, et al. [31] reported that the distribution of calcium is generally higher than the value of magnesium although both the elements are associated each other in the water. Magnesium is the determining factor for the growth of chlorophyll and phytoplankton [32]. In the present study, the magnesium value was minimum (12.10±0.17mg/l) in December, 2016 and maximum (36.33±1.53mg/l) in March, 2017. At water sample 2, the minimum value (12.83±1.04 mg/l) was in April, 2017 and maximum value (26.33±0.58 mg/l) was in January, 2017 as in agreement with the result of the other study as indicated above.
Sodium content in the water samples 1 and 2 was ranged between 127.00±1.00 and 367.00±2.00 mg/l. Maximum level of sodium was recorded in summer season and the minimum level was recorded in winter season at S1. In contrast to this, high content of sodium was noticed during winter (314.33±1.53) in the month of December, 2016 at S2. Solanki HA [33] from his study reported the maximum sodium value in summer. In agreement with the above study, the minimum value of sodium (127.00±1.00 mg/l) in August, 2016 and maximum value (367.00±2.00 mg/l) in March, 2017 was noticed. In water sample 2, the minimum value (211.00±1.73 mg/l) in 2017 and maximum value (314.33±1.53 mg/l) in December, 2016 was noticed. These fluctuations of sodium content may be with the presence of amount of organic load during summer and winter seasons depends upon the climatic change.
Presence of potassium (K) content in water sample 1 and 2 was varied between 0.30±0.00 and 24.26±0.25 mg/l and its content at water sample 1 was minimum (0.36±0.00 mg/l) in May and July, 2016 and maximum (24.26±0.25 mg/l) in March, 2017. In water sample 2, the minimum value (0.30±0.00 mg/l) in December, 2016 and March, 2017 and maximum value (19.16±0.15 mg/l) in July, 2016 was recorded. It has been agreed with the view of increase of potassium concentration during the monsoon season as the run off consisted decomposed plant material and organic waste [34].
The levels of Iron content in water samples 1 and 2 varied between 0.02±0.00 and 0.49±0.01. Water sample 1 had the highest value of Iron (0.49±0.01 mg/l) in October, 2016 and the lowest value (0.02±0.00 mg/l) in May, 2016. Water sample 2 showed the highest value (0.49±0.01 mg/l) in June, 2016 and January, 2017 and lowest value (0.30±0.00 mg/l) in September, October and November, 2016 and April, 2017. The levels of manganese in water samples 1 and 2 were ranged between 0.01±0.00 and 0.29±0.00 mg/l. Water sample 1 had the highest value of manganese (0.29±0.00) in March, 2017 and the lowest value (0.01±0.00) in June and October, 2016 and January, 2017. Water sample 2 showed the highest value (0.20±0.00 mg/l) in December, 2016 and lowest value (0.01±0.00) in July and October, 2016.
The values of Ammonia in water samples 1 and 2 were varied between 0.04±0.00 and 1.22±0.00 mg/l. Water sample 1 had the highest value of free ammonia (1.22±0.00 mg/l) in January, 2017 and the lowest value (0.04±0.00 mg/l) in November, 2016. Water sample 2 showed the highest value (0.50±0.01 mg/l) in July and November, 2016 and lowest value (0.23±0.00 mg/l) in September, 2016 and March, 2017. Fluctuation of the ammonia values in the study may be due to the death and subsequent decomposition of phytoplankton, excretion of ammonia by aquatic organisms and open faecal contamination. Higher content of ammonia in summer season might be due to the excessive excretory product of aquatic animals and the higher microbial activities, etc [35].
The nitrite levels in water samples 1 and 2 were ranged between 0.01±0.00 and 1.37±0.01 mg/l. Water sample 1 had the highest value of nitrite (1.37±0.01) in March, 2017 and the lowest value (0.01±0.00) in December, 2016 and April, 2017. Water sample 2 showed the highest value (0.19±0.00 mg/l) in November, 2016 and lowest value (0.03±0.00 mg/l) in August, 2016 and January and April, 2017.
The nitrate value in water samples 1 and 2 were ranged between 6.00±0.00 and 41.00±1.00 mg/l. Water sample
1 had the highest value of nitrate (41.00±1.00 mg/l) in February, 2017 and the lowest value (6.00±0.00 mg/l) in June, 2016. Water sample 2 showed the highest value (40.00±1.00 mg/l) in November, 2016 and lowest value (7.00±0.00 mg/l) in July, 2016. The permissible level for nitrate is 10 mg/l [36]. Presence of nitrate more than 5 mg/l is the indicative of pollution which is mainly made by fertilizer runoff and animal and human waste [29, 37, 38] (Tables 3 & 4).
| Chemical Examination | May | June | July | August | Septe mber | October | Novem ber | Dece mber | January | February | March | April |
|---|---|---|---|---|---|---|---|---|---|---|---|---|
| pH | 7.73± 0.21 | 6.87± 0.06 | 7.12± 0.10 | 7.77± 0.11 | 7.93± 0.15 | 7.53± 0.29 | 7.31± 0.57 | 7.65± 0.01 | 7.78± 0.00 | 7.18± 0.00 | 7.80± 0.10 | 7.18± 0.00 |
| Dissolved oxygen (mg/l) | 6.18± 0.16 | 5.67± 0.01 | 4.80± 0.10 | 11.30± 0.10 | 20.00± 1.00 | 21.16± 0.28 | 11.30± 0.10 | 14.00± 0.50 | 21.76± 0.68 | 15.13± 0.70 | 18.66± 0.57 | 12.16± 0.78 |
| Calcium (as Ca mg/l) | 122.33± 2.55 | 81.00± 2.00 | 83.33± 1.52 | 67.33± 1.52 | 46.33± 2.51 | 81.00± 2.00 | 84.00± 1.00 | 67.33± 1.52 | 124.00± 4.00 | 152.00± 2.00 | 132.00± 2.00 | 136.00± 1.00 |
| Magnesium (as Mg mg /l) | 20.50± 0.50 | 12.36± 0.32 | 22.36± 0.25 | 14.30± 0.26 | 13.06± 0.11 | 18.03± 0.15 | 20.10± 0.17 | 12.10± 0.17 | 21.83± 0.76 | 34.33± 1.53 | 36.33± 1.53 | 31.33± 1.53 |
| Sodium (as Na mg /l) | 240.00± 5.00 | 257.00± 2.00 | 296.00± 2.00 | 127.00± 1.00 | 298.33± 2.52 | 211.00± 1.00 | 259.00± 4.00 | 291.00± 1.33 | 262.66± 6.52 | 213.00± 2.00 | 288.00± 1.73 | 367.00± |
| Potassium (as K mg /l) | 0.36± 0.00 | 0.41± 0.01 | 0.36± 0.00 | 17.16± 0.15 | 17.13± 0.20 | 19.03± 0.25 | 18.23± 0.20 | 12.23± 0.20 | 17.23± 0.21 | 16.36± 0.15 | 24.26± 0.25 | 0.36± 0.10 |
| Iron (as Fe mg/l) | 0.02± 0.00 | 0.08± 0.00 | 0.22± 0.06 | 0.32± 0.01 | 0.44± 0.01 | 0.49± 0.01 | 0.36± 0.00 | 0.41± 0.01 | 0.30± 0.00 | 0.30± 0.00 | 0.30± 0.00 | 0.34± 0.01 |
| Manganese (as Mn mg/l) | 0.08± 0.00 | 0.01± 0.00 | 0.04± 0.00 | 0.02± 0.00 | 0.10± 0.00 | 0.01± 0.00 | 0.10± 0.00 | 0.10± 0.00 | 0.01± 0.00 | 0.02± 0.00 | 0.29± 0.00 | 0.03± 0.00 |
| Free Ammonia (as NH3 mg /l) | 0.21± 0.01 | 0.08± 0.00 | 1.14± 0.01 | 0.21± 0.00 | 0.43± 0.01 | 0.55± 0.01 | 0.04± 0.00 | 0.58± 0.01 | 1.22± 0.00 | 0.55± 0.01 | 0.17± 0.01 | 0.29± 0.01 |
| Nitrite (as NO2 mg/l) | 0.02± 0.00 | 0.22± 0.00 | 0.12± 0.00 | 0.05± 0.00 | 0.02± 0.00 | 0.22± 0.00 | 0.12± 0.00 | 0.01± 0.00 | 0.05± 0.00 | 0.21± 0.01 | 1.37± 0.01 | 0.01± 0.00 |
| Nitrate (as NO3 mg /l) | 28.0± 1.00 | 8.33± 0.57 | 21.00± 1.00 | 15.33± 0.57 | 25.50± 0.50 | 6.00± 0.00 | 37.66± 1.52 | 11.50± 0.50 | 11.50± 0.50 | 41.00± 1.00 | 10.50± 0.50 | 28.33± 1.52 |
| Chloride ( as Cl mg/l) | 277.67± 2.52 | 234.00± 4.00 | 257.33± 3.06 | 327.67± 2.52 | 540.00± 5.00 | 432.67± 2.52 | 422.33± 2.52 | 416.00± 1.00 | 423.33± 2.89 | 430.00± 5.00 | 510.00± 5.00 | 601.67± 2.89 |
| Fluoride ( as F Mg/l) | 0.21± 0.01 | 0.42± 0.01 | 0.69± 0.01 | 0.52± 0.01 | 0.60± 0.00 | 0.52± 0.01 | 0.64± 0.01 | 0.52± 0.01 | 0.66± 0.01 | 0.05± 0.00 | 0.59± 0.01 | 042± 0.01 |
| Sulphate (as SO4 mg /l) | 75.76± 3.56 | 95.6± 3.44 | 74.6± 4.55 | 31.65± 5.62 | 56.6± 2.54 | 22.76± 13.17 | 221± 5.45 | 147.5± 3.22 | 114.5± 3.5 | 234.6± 2.56 | 171± 4.54 | 118.6± 0.00 |
| Phosphate (as PO4 mg /l) | 3.88± 0.00 | 0.2± 0.00 | 0.1± 0.00 | 2.3± 0.01 | 0.15± 0.00 | 0.07± 0.00 | 0.03± 0.00 | 0.22± 0.00 | 0.12± 0.00 | 0.28± 0.00 | 0.35± 0.00 | 0.34± 0.00 |
| Chemical Examination | May | June | July | August | Septe mber | Octo ber | Nove mber | Dece mber | January | February | March | April |
| pH | 7.13± 0.10 | 7.3± 0.10 | 7.76± 0.01 | 7.83± 0.06 | 6.85± 0.01 | 7.19± 0.01 | 6.98± 0.00 | 7.78± 0.00 | 7.03± 0.01 | 7.8± 0.10 | 6.85± 0.01 | 7.13± 0.01 |
| Dissolved oxygen (mg/l) | 7.76± 0.05 | 4.73± 0.05 | 5.68± 0.01 | 6.30± 0.26 | 8.03± 0.15 | 4.33± 0.11 | 6.24± 0.01 | 5.69± 0.01 | 6.46± 0.05 | 7.86± 0.05 | 4.36± 0.35 | 22.50± 0.05 |
| Calcium (as Ca mg/l) | 142.00± 2.00 | 132.00± 2.00 | 107.33± 2.08 | 144.33± 4.04 | 132.33± 2.51 | 66.00± 1.00 | 71.66± 1.52 | 74.00± 1.00 | 66.10± 1.25 | 72.00± 2.00 | 75.00± 1.00 | 66.00± 1.00 |
| Magnesium (as Mg mg /l) | 21.86± 0.61 | 23.30± 0.26 | 15.30± 0.26 | 25.66± 0.58 | 17.26± 0.25 | 22.33± 1.04 | 23.26± 0.25 | 15.16± 0.15 | 26.33± 0.58 | 17.16± 0.15 | 22.23± 0.25 | 12.83± 1.04 |
| Sodium (as Na mg /l) | 247.67± 2.51 | 241.33± 1.53 | 257.33± 1.53 | 295.00± 1.00 | 258.00± 1.00 | 257.66± 1.15 | 271.66± 2.08 | 314.33± 1.53 | 242.00± 2.00 | 258.00± 1.00 | 211.00± 1.73 | 215.33 ±/.58 |
| Potassium (as K mg /l) | 16.36± 0.32 | 17.46± 0.45 | 19.16± 0.15 | 18.16± 0.15 | 12.16± 0.15 | 0.36± 0.00 | 0.41± 0.01 | 0.30± 0.00 | 0.36± 0.05 | 0.41± 0.00 | 0.30± 0.00 | 0.53± 0.00 |
| Iron (as Fe mg/l) | 0.44± 0.01 | 0.49± 0.01 | 0.36± 0.01 | 0.41± 0.01 | 0.30± 0.00 | 0.30± 0.00 | 0.30± 0.00 | 0.44± 0.01 | 0.49± 0.01 | 0.36± 0.00 | 0.41± 0.01 | 0.30± 0.00 |
| Manganese (as Mn mg/l) | 0.09± 0.06 | 0.08± 0.00 | 0.01± 0.00 | 0.04± 0.00 | 0.08± 0.06 | 0.01± 0.00 | 0.04± 0.00 | 0.20± 0.00 | 0.09± 0.00 | 0.07± 0.00 | 0.09± 0.00 | 0.09± 0.00 |
| Free Ammonia (as NH3 mg /l) | 0.50± 0.01 | 0.48± 0.01 | 0.50± 0.00 | 0.47± 0.01 | 0.23± 0.00 | 0.48± 0.01 | 0.50± 0.01 | 0.48± 0.01 | 0.50± 0.00 | 0.47± 0.01 | 0.23± 0.00 | 0.48± 0.00 |
| Nitrite (as NO2 mg/l) | 0.04± 0.0 | 0.18± 0.00 | 0.07± 0.00 | 0.03± 0.00 | 0.04± 0.00 | 0.17± 0.00 | 0.19± 0.00 | 0.07± 0.00 | 0.03± 0.00 | 0.04± 0.00 | 0.17± 0.00 | 0.03± 0.00 |
| Nitrate (as NO3 mg /l) | 30.33± 1.52 | 9.50± 0.50 | 7.00± 0.00 | 21.33± 1.52 | 7.50± 0.50 | 23.00± 1.00 | 40.00± 1.00 | 10.50± 0.50 | 26.00± 1.00 | 10.33± 0.57 | 7.16± 0.28 | 8.83± 0.28 |
| Chloride ( as Cl mg/l) | 219.00± 3.60 | 403.67± 3.21 | 430.00± 5.00 | 486.00± 55.43 | 616.00± 1.00 | 403.67± 3.21 | 433.00± 3.00 | 551.67± 2.89 | 278.00± 3.00 | 233.33± 3.05 | 258.00± 3.00 | 251.00± 1.73 |
| Fluoride ( as F Mg/l) | 0.72± 0.01 | 0.53± 0.01 | 0.42± 0.01 | 0.69± 0.01 | 0.64± 0.01 | 0.72± 0.01 | 0.53± 0.01 | 0.43± 0.01 | 0.69± 0.01 | 0.64± 0.00 | 0.73± 0.01 | 0.53± 0.01 |
| Sulphate (as SO4 mg /l) | 39.50± 0.50 | 162.33± 2.08 | 113.67± 1.53 | 112.00± 2.08 | 57.33± 0.58 | 171.67± 1.53 | 111.67± 1.53 | 104.33± 2.08 | 19.5.± 0.05 | 25.33± 0.58 | 57.00± 1.00 | 169.67± 1.53 |
| Phosphate (as PO4 mg /l) | 0.27± 0.00 | 0.34± 0.00 | 0.33± 0.00 | 0.00± 0.00 | 2.73± 0.06 | 2.77± 0.06 | 0.27± 0.00 | 0.34± 0.00 | 2.53± 0.06 | 2.73± 0.06 | 1.92± 1.43 | 0.34± 0.00 |
Table 2: Chemical Examination of water Samples collected from Station I of Puliyanthangal Lake during the year May 2016 - April 2
The chloride levels in water samples 1 and 2 were ranged between 219.00±3.60 and 616.00±1.00 mg/l. Water sample 1 had the highest value of chloride (601.67±2.89 mg/l) in April, 2017 and the lowest value (234.00±4.00 mg/l) in June, 2016. Water sample 2 showed the highest value (616.00±1.00 mg/l) in September, 2016 and lowest value (219.00±3.60 mg/l) in May, 2016. It is predicted that the chloride value is higher than that of the permissible value as prescribed by WHO. The levels of fluoride in water samples 1 and 2 were ranged between 0.042±0.01 and 0.73±0.01 mg/l. Water sample 1 had the highest value of fluoride (0.69±0.01 mg/l) in July, 2016 and the lowest value (0.42±0.01 mg/l) in April, 2017. Water sample 2 showed the highest value (0.73±0.01) in March, 2017 and lowest value (0.42±0.01) in July, 2016. However, these values were below the permissible of 1.
The sulphate levels in water samples 1 and 2 were ranged between 19.5±0.05 and 234.6±2.56 mg/l. Water sample 1 had the highest value of sulphate (234.6±2.56 mg/l) in April, 2017 and the lowest value (18.17±0.29 mg/l) in February, 2017. Water sample 2 showed the highest value (169.67±1.53 mg/l) in April, 2017 and lowest value (22.76±13.17 mg/l) in October, 2016. However, these values were within the acceptable limit. High values of sulphate were commonly noticed during the monsoon seasons [21, 39, 40]. The present study showed the high values of sulphate in the summer season.
Phosphate levels in water samples 1 and 2 were ranged between 0.03±0.00 and 3.88±0.00 mg/l. Water sample 1 had the highest value of phosphate (3.23±0.0) in May, 2016 and the lowest value (0.03±0.00) in November, 2016. Water sample 2 showed the highest value in September (2.73±0.06 mg/l) in October (2.77±0.06 mg/l), 2016 and February, (2.73±0.06 mg/l), 2017 and lowest value (0.27±0.00 mg/l) in May and November, 2016. Maximum level of phosphate during monsoon as reported in the present study might be due to the entry of land drainage waste as well as tannery effluents in the water body. Another explanation of the low level of phosphate may be due to tttttheabundance of phytoplankton [41, 42, 43, 44, 45, 46].
Conclusion
The result of the present study indicated that the physico- chemical parameters such as TDS, calcium, magnesium, Iron, manganese and chloride were found to be higher than the acceptable limit and other remaining parameters were within the acceptable limit. The chemical parameters such as fluoride and sulphate were below the permissible limit. It is predicted that the mouth region of the water body at S1 to receive the organic load by anthropogenic activity had higher load of physicochemical variables compared to the middle region of water body at S2. It is concluded that the value of the physicochemical parameters is seemed to be higher at the entry point of the water body may be due to dilution of domestic and industrial wastes and thus, it may have a chance of affecting the biodiversity of the organisms. Although this water is moderately acceptable with reference to some of the physico-chemical variables in the water body, it may be protected from the intrusion of wastes by direct or indirect means.
Acknowledgement
Authors of the research paper are thankful to the authority of the Thiruvalluvar University for providing necessary facilities to carry out this research work.
References
-
Agbaire PO, Obi CG (2009) Seasonal Variation of some physico-chemical properties of River Ethiope water in Abraka, Nigeria. Journal of Applied Sciences and Environmental Management 13: 55-57.
-
Verma P, Chandawat D, Gupta U, Solanki HA (2012) Water quality analysis of an organically polluted lake by investigating different physical and chemical parameters. International Journal of Research in Chemistry and Environment 2: 105-112.
-
Uduma AU (2014) Physicochemical analysis of the quality of sachet water consumed in kano metropolis. American Journal of Environment, Energy and Power Research 2(1): 1-10.
-
Onwughara NI, Ajiwe VIE, Nnabuenyi HO (2013) Physico- chemical studies of water from selected boreholes in Umuahia North Local Government Area, in Abia State, Nigeria. International Journal of Pure & Applied Bioscience 1(3): 34-44.
-
Verma PU, Purohit AR, Patel NJ (2012) Pollution status of Chandlodia Lake located in Ahmedabad Gujarat. International Journal of Engineering Research and Applications 2(4): 1600-1610.
-
Smitha (2013) Physico-chemical analysis of the freshwater at River Kapila, Nanjangudu Industrial Area, Mysore, India. International Research Journal of Environment Sciences 2(8): 59-65.
-
Chakrapani GJ (2002) Water and sediment geochemistry of major Kumaun Himalayan lakes, India. Environ Geol 43: 99-107.
-
Yu F, Fang G, Ru X (2010) Eutrophication, health risk assessment and spatial analysis of water quality in Gucheng Lake, China. Environ Earth Sci 59(8): 1741- 1748.
-
Govindasamy C, Viji J (2012) Present Status of Maniyampattu and Puliyanthangal Lakes Ranipettai, Tamilnadu, India. World Applied Sciences Journal 16(10): 1409-1415.
-
APHA (American Public Health Association) (2005) Standard Methods for the Examination of Water and Wastewater 21st (Edn.), Inc. Washington DC, USA.
-
Ghavzan NJ, Gunale VR, Trivedy RK (2006) Limnological evaluation of an urban freshwater river with special reference to phytoplankton. Pollu Res 25: 259-268.
-
Tewari DD, Mishra SM (2005) Limnological studies during rainy season of Seetadwar lake at Shrawasti Dist. J Ecophysiol Occupat Health 5: 71-72.
-
Tas B, Gonulol A (2007) An ecological and taxonomic study on phytoplankton of a shallow lake, Turkey. J Environ Biol 28(2): 439-445.
-
Devaraju TM, Venkatesha MG, Singh S (2005) Studies on Physico-Chemical parameters of Maddur Lake with reference to suitability for aquaculture. Nat Env Poll Tech 4(2): 287-290.
-
Garg RK, Rao RJ, Uchchariya D, Shukla G, Saxena IN (2010) Seasonal variation in water quality and major threats to Ramsagar reservoir, India. African J of Environ Sci and Tech 4(2): 061-076.
-
BIS (Bureau of Indian Standards) (2005) Compressed Oxygen gas, IS 309**.**
-
Sciortino JA, Ravikumar R (1999) Fishery Harbour Manual on the Prevention of Pollution - Bay of Bengal Programme, BOBP/MAG/22, Madras, India.
-
Shaw GR, Moore DP, Garnett C (2001) Eutrophication and Algal Blooms, Environmental and Ecological Chemistry, Vol. II. Encyclopedia of Life Support Systems (EOLSS).
-
Muhammad-Bazani Ismail BS, Sahibin Abd, Sujaul-Islam Mir, Tan CC (2007) Hydrobiology and water quality assessment of the Tasik Chini’s Feeder Rivers, Pahang, Malaysia. Am-Euras. J Agric and Environ Sci 2(1): 39-47.
-
Narayana J, Puttaiah ET, Basavaraja D (2008) Water quality characteristics of Anjanapura reservoir near Shikaripur, District Shimoga, Karnataka J Aqua Biol 23(1): 59-63.
-
Reddy Vasumathi K, Laxmi Prasad K, Swamy M, Ravinder R (2009) Physico-chemical parameters of Pakhal Lake of Warangal district andhra Pradesh, India. J Aqua Bio 24(1): 77-80.
-
Jawale AK, Patil SA (2009) Physico-chemical characteristics and Phytoplanktons abundance of Mangrul dam, Dist-Jalgaon, Maharashtra. J Aqua Biol 24(1): 7-12.
-
Verma SR, Tyagi AK, Dalella RC (1978) Pollution studies of a few Rivers of Western Uttar Pradesh with reference to biological indices. Proc Ind Acad Sci B 87(6): 123-131.
-
Bhatt LR, Lacoul P, Lekhak HD, and Jha PK (1999) Physico-chemical characteristics and phytoplanktons of Taudaha lake, Kathmandu. Pollution Research 18: 353- 358.
-
Senthilkumar R, Sivakumar K (2008) Studies on phytoplankton diversity in response to abiotic factors in Veeranam lake in the Cuddalore district of Tamil Nadu. Journal of environmental biology India 29(5): 747-752.
-
BIS (1991) Indian standard Drinking Water Specification, Bureau of Indian Standard, Indian Standard (10500).
-
Chang CY, Chang JS, Vigneswaran S, Kandasamy J (2008) Pharmaceutical wastewater treatment by membrane bioreactor process a case study in southern Taiwan. Desalination pp: 1-9.
-
Tepe Y, Türkmen Mand M, Turkmen A (2008) Assessment of heavy metals in two commercial fish species of four Turkish seas. Environmental Monitoring and Assessment 146: 277-284.
-
Das AK (2000) Limno-chemistry of some Andhra Pradesh reservoirs. J Inland Fish Soc India 32: 37-44.
-
Sirsath DB, Ambore NE, Pulle JS, Thorat DH (2006) Studies on the concentration of ion in fresh water pond at Dharampuri, Dist, Beed, India Poll Res 25(3): 507-509.
-
Venkatasubramani R, Meenambal T (2007) Study of subsurface water quality in Mettupalayam Taluk of Coimbatore district Tamil Nadu. Nat Environ Poll Tech 6(2): 307-310.
-
Dagaonkar A, Saksena DN (1992) Physicochemical and biological characterization of a temple tank, Kaila Sagar, Gwalior, Madhya Pradesh. J Hydrobiol 8(1): 11-19.
-
Solanki HA (2001) Study on pollution of soils and water reservoirs near industrial areas of Baroda. Ph.D Thesis submitted to Bhavnagar University, Bhavnagar.
-
Trivedy RK, Goel PK (1987) Practical methods in ecology and environmental science. Environmental publications, Karad, India. 1.
-
Janakiraman A, Naveed MS, Altaff K (2012) Impact of domestic sewage pollution on rotifer abundance in Adyar estuary. International Journal of Environmental Sciences 3(1): 689-696.
-
WHO (1984) World Health Organization, Water Quality Standards for Drinking Water, World Health Organization, Geneva, USA.
-
Kumar SM, Ravindranath S (1998) Water Studies- Methods for monitoring water quality. Published by Center for Environment Education (CEE), Banglore, Karnataka, India, pp: 191.
-
Rajashekhar AV, Lingaiah A, Satyanarayana Rao, Ravi Shankar Piska (2007) The studies on water quality parameters of a minor reservoir, Nadergul, Rangareddy district Andhra Pradesh. J Aqua Biol 22(1): 118-122.
-
Telkhade PM, Dahegaonkar NR, Zade SB, Lonkar AN (2008) Quantitative analysis of phytoplanktons and zooplanktons of Masala Lake, Masala; Dist. Chandrapur, Maharashtra. Envirn Cosr J 9(1&2): 37-40.
-
Shanthi VS, Muthumeena S, Jeyaseeli A, Florence Borgia VJ (2006) Physico-chemical status of Varaga River at Theni district, Tamil Nadu. J Aqua Biol 21(2): 123-127.
-
Devaraj KV, Mahadeva HS, Pazal AA (1988) Hydrobiology of the hemavathy reservoir. In: Mohan M Joseph (Ed.), The first Indian Fisheries Forum. Proceedings. Asian Fisheries Society. Indian Branch, Mangalore, India, pp: 323-327.
-
Chary KD (2003) Present status, Management and Economics of Fisheries of a minor Reservoir, Durgamcheruvu of Rangareddy District Andhra Pradesh, Ph.D. Thesis, Osmania University.
-
Rao AM (2004) Studies on limnology and fisheries in a Tilapia-Dominated Perenial Tank, Julur, Nalgonda District Andhra Pradesh, Ph.D. Thesis, Osmania University.
-
Pazhanisamy S (2005) Reservoir ecology of lower anaicut Thanjavur District, Tamil Nadu, Ph.D. Thesis, Bharathidasan University, India, pp: 136.
-
Kotadiya NG, Acharya CA, Radadia BB, Solanki HA (2013) Determination of Water Quality Index and suitability of a rural freshwater body in Ghuma village, District Ahmedabad, Gujarat. Life Sciences Leaflets 2: 68-67.
-
Sehgal HS (2003) Status paper on fisheries management on Chohal reservoir. Workshop on fisheries management in the lentic water system: stocking of the reservoir with fish seed. pp: 7- 18.
- California Red-Legged Frog and Non-Listed Amphibians Response to Non-Native Fish Removal
- Industrial Standardization of the Bio-OS: Algorithmic Codification of Resilience Engineering Guidelines and Version V8 Architecture
- Climate Variability and the Sustainability of Snail Farming in Nigeria: Past Trends, Present Challenges and Potential Outlook
- The Evaluation of the Surveillance System of Anthrax in Gilgit-Baltistan, Pakistan, 2018
- Natural Decline to Extinction of A New Zealand Rabbit Population
- Mitochondrial Bio-Logistics: Steering Co-Enzyme Q10 and Lycopene Synergies within the Science 4.0 Bio-OS Framework