Methylation Profile of 18S rDNA Gene in Brain and Muscle of Tambaqui Exposed to Parasiticide Trichlorfon
Until recently, there were no reports on the methylation profile of Amazonian fish specimens employing restriction enzymes. The 18S rDNA methylation status of samples of captive tambaqui (Colossoma macropomum) exposed to the antiparasitic Trichlorfon was examined in the current study. The method performed makes use of the CCGG site's sensitivity to the presence of methylation in palindrome cytosines for the restriction enzymes HpaII and MspI. The cleavage occurs by the detection or non-detection of the methyl radical in the inner (C5mCGG) or outer (5mCCGG) cytosine, which makes it possible to compare the DNA methylation profile. When compared to the specimens examined as the control group, the results obtained revealed an increase in methylated fragments of the 18S rDNA gene at LC concentrations of 30% and 50%.
Introduction
Pesticides are chemical substances currently utilized to minimize the action of parasites and reduce losses in pisciculture. These substances end up contaminating the fish tissues, leading to biochemical, histopathological, genotoxic, and molecular alterations. The direct exposure of animals to toxic chemicals may induce harmful effects by affecting their epigenome and physiology. Extensively used in Amazonian piscicultures, the organophosphate Trichlorfon (dimethyl 2,2,2-trichloro-1 hydroxyethyl phosphonate) is a phosphoric acid currently classified as highly toxic (class II). The levels most commonly used by fish farmers are overestimated, ranging from 0.13 mg/L to 25 g/L of Trichlorfon thrown into the water for immersion baths [1]. This organophosphate is one of the main contaminants found in piscicultures. In this study, it was used a technique to identify the methylation pattern in simple locus in an effort to understand how this contamination affects the tambaqui genome. To achieve this, it was used the 18S rDNA ribosomal gene, which is arranged in tandem into several transcriptional units. It is moderately repetitive; it contains several palindromic CCGG sites. Because it is easily amplified, conserved, and has gene regulation mediated by methylation of the hundreds of copies present in the genome, the 18S rDNA gene exhibits promise and is occasionally employed as an epigenetic marker for cancer [2]. In this study, an assay using the restriction enzymes HpaII and MspI was developed in order to examine the methylation profile of the 18S rDNA ribosomal gene in tambaqui (Colossoma macropomum).
Material and Methods
All procedures performed in this work were approved under protocol number 030/2018 - CEUA/UFAM by the Animal Research Ethics Committee of the Federal University of Amazonas. The animals were exposed to two concentrations of Trichlorfon: 30% and 50% of the LC, for 24, 48, 72, and 96 hours as described for the compound [3, 4]. A corresponding control group was performed for each sample group. The experimental design is shown in Figure 1, with each treatment being performed in triplicate with eight fish in each tank. Three samples were randomly selected for enzymatic digestion. Each experimental condition involved anesthetizing the animals before collecting their brains and muscles for analysis.
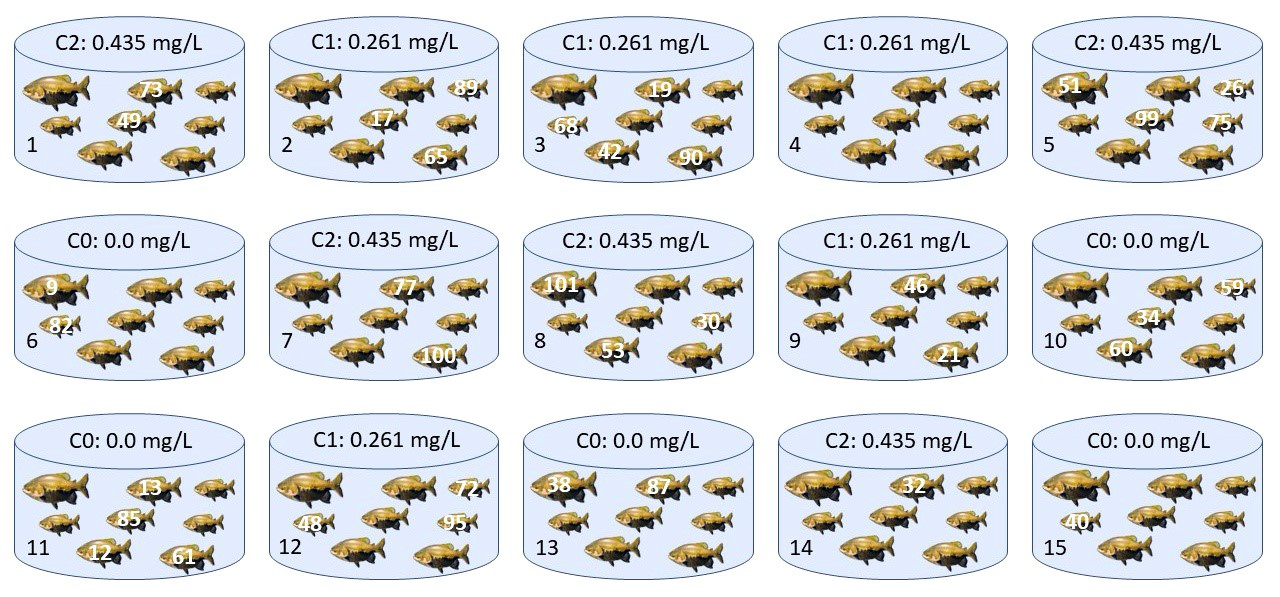
Figure 1: Experimental design performed in the experiment. C0 – control concentration (without the addition of Trichlorfon in the water); C1: concentration 1, 30% of Trichlorfon LC50-96h diluted in water (0.261 mg/L of Trichlorfon); C2: concentration 2, 50% of Trichlorfon LC50-96h diluted in water (0.435 mg/L of Trichlorfon). Numbers of samples are shown for each tank and concentration.
Genomic DNA extraction was performed according to Sambrook, et al. [5]. In accordance with the manufacturer’s instructions (Promega™), the genomic DNA (concentration of 0.1g/L) was digested using the restriction enzymes HpaII and MspI. Using the primers and conditions outlined by Gross, et al. [6], the 18S rDNA region was amplified by PCR after the enzyme digestion. Electrophoresis in a 1.5% (m/v) agarose gel, in 1X TBE buffer, labeled with ethidium bromide, and observed in a UV transilluminator was used to verify the reaction products. A methylated fragment (5mC5mCGG) was identified by the appearance of bands in the gel of fragments digested by both enzymes; this means that neither the HpaII enzyme nor the MspI enzyme digested the fragment, and it appears intact in the gel. Inner cytosine methylation was hypothesized to be the cause of the fragment’s appearance in the gel after HpaII digestion and its absence during MspI digestion (C5mCGG). Previously acquired samples of the brain and muscles were used to confirm the methylation profile. In order to better understand the results, they will first be presented for the control condition, C0 (no exposure to Trichlorfon), and then for each exposure time:
C1 (concentration 1, 30% of Trichlorfon LC50-96h, 0.261 mg/L) and C2 (concentration 2, 50% of Trichlorfon LC50-96h, 0.435 mg/L). Differences (p<0.05) in the frequency of phenotypes (%) were evaluated by the Three-way Analysis of Variance (ANOVA) and the FISHER LSD test (Post - hoc) carried out in the STATISCA demo program (StatSoft®) [7]. The necessary assumptions were evaluated (independence of samples; Homoscedasticity and Normality of data).
Following the manufacturer’s instructions, the sequencing reaction was performed using the ABI PRISM® Big Dye™ Terminator Cycle Sequencing Ready Reaction Kit (Applied Biosystems), and the samples were sequenced using an ABI Sequence Analyzer 3500 in an automated four- capillary sequencer (Applied Biosystems).
Results
The samples in the gel are arranged in a triad, with the undigested DNA in the first pit, the DNA being digested with the HpaII enzyme in the second pit, and the DNA being digested with the MspI enzyme in the third pit.
Figure 2 presents the 18S rDNA sequencing with 1.428pb and eleven sites of CCGG susceptible to methylation. Figure
3 summarizes the methylation profile found in this study. There was no statistically significative difference between methylation profiles in relation to the tissues analyzed (Figure 4).
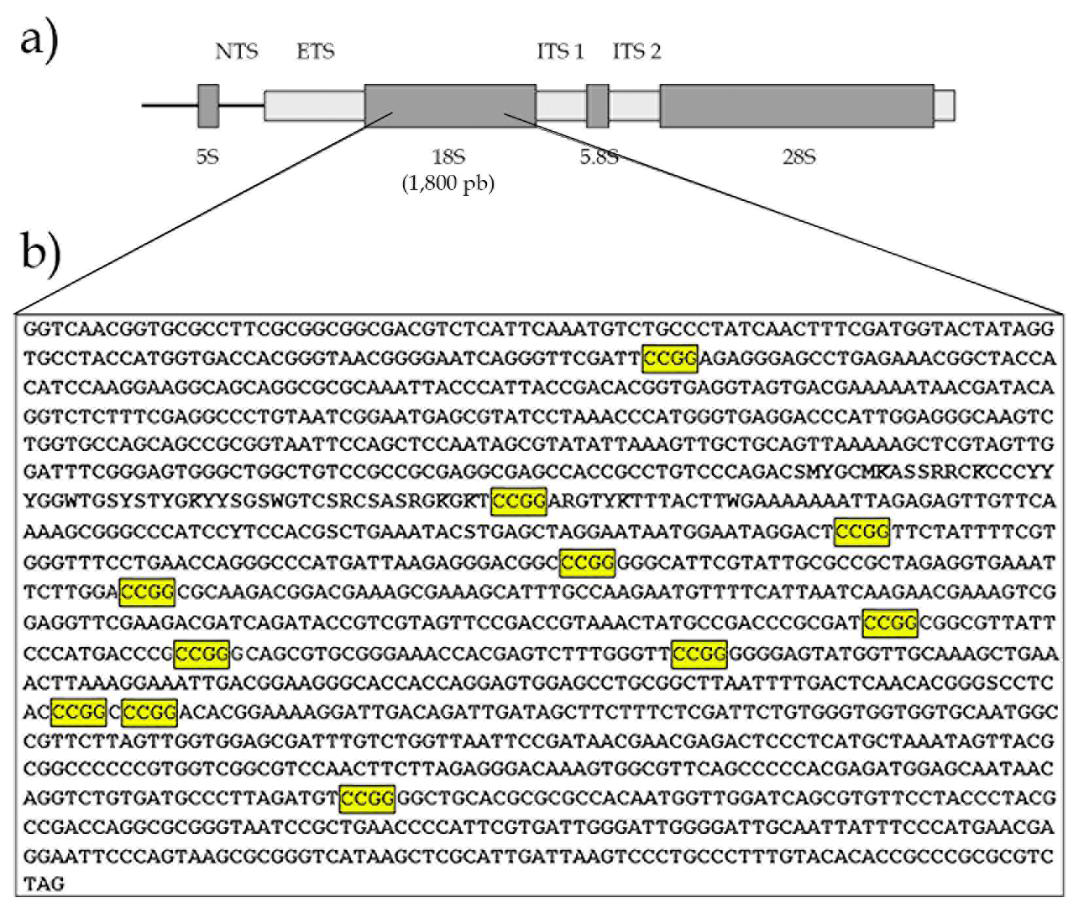

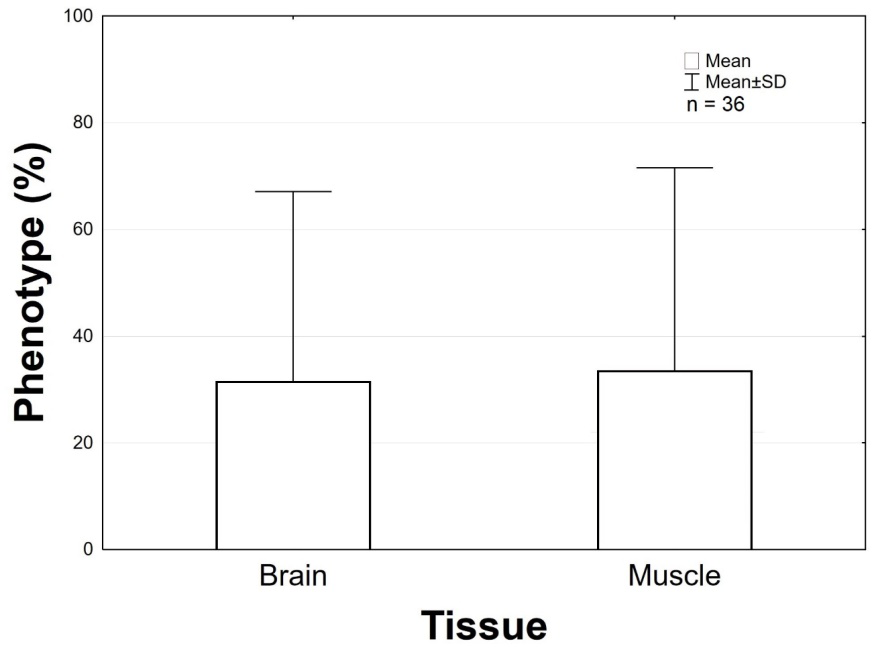
Figure 5 displays the methylation profile of the 18S rDNA gene in the control condition (C0), condition 1 (C1), and condition 2 (C2) in the brain. Of the 12 samples analyzed as a control group, for all the times, eight presented methylation in the inner cytosine and profile C5mCGG, four samples showed methylation in the internal and external cytosine, but the bands appeared faint in the MspI digestion.

Figure 5: Methylation profile of the 18S ribosomal DNA gene (18S rDNA), in the brain. Times used in the experiment 24h, 48h, 72h, and 96h (A, B, C D, respectively). C0: control condition. C1: concentration 1, 30% of Trichlorfon LC50-96h diluted in water (0.261 mg/L). C2: concentration 2, 50% of Trichlorfon LC50-96h diluted in water (0.435 mg/L). First column: ladder.
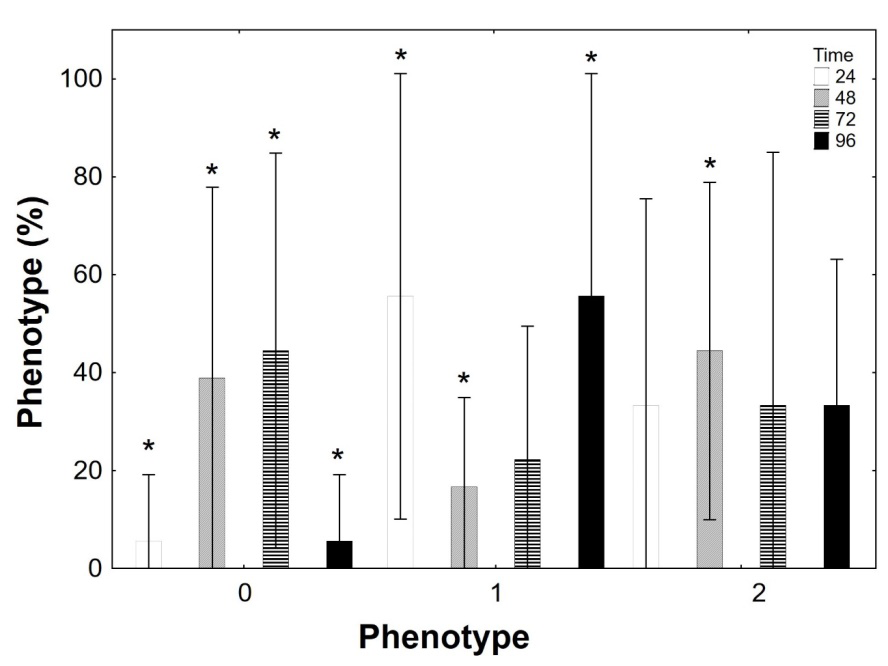
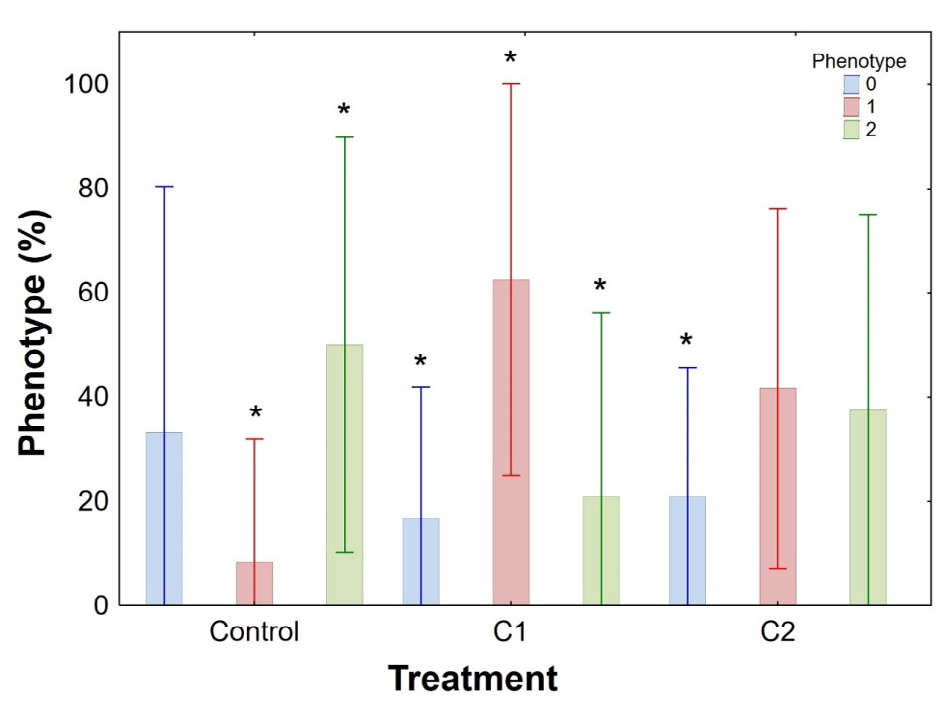
Figure 6 presents the methylation profile of the 18S rDNA gene in the control condition (C0), condition 1 (C1), and condition 2 (C2) in muscle. For most of the samples in the C0 is observed a C5mCGG methylation profile. In this condition, some individuals presented a 5mC5mCGG methylation type, due to the presence of the band in the MspI digestion. However, that bands are weak when compared to bands of HpaII digestion. This occurred by the presence of a few methylated fragments in the outer cytosine. For the other times, was observed an increase in the methylation of C5mCGG for 5mC5mCGG (band presence in the MspI digestion). The analysis of the three-way ANOVA showed that there was a significative increase in methylation mainly in the C1 in the times 24h and 96h (Figures 7 & 8), 5mC5mCGG (band presence in the MspI digestion).
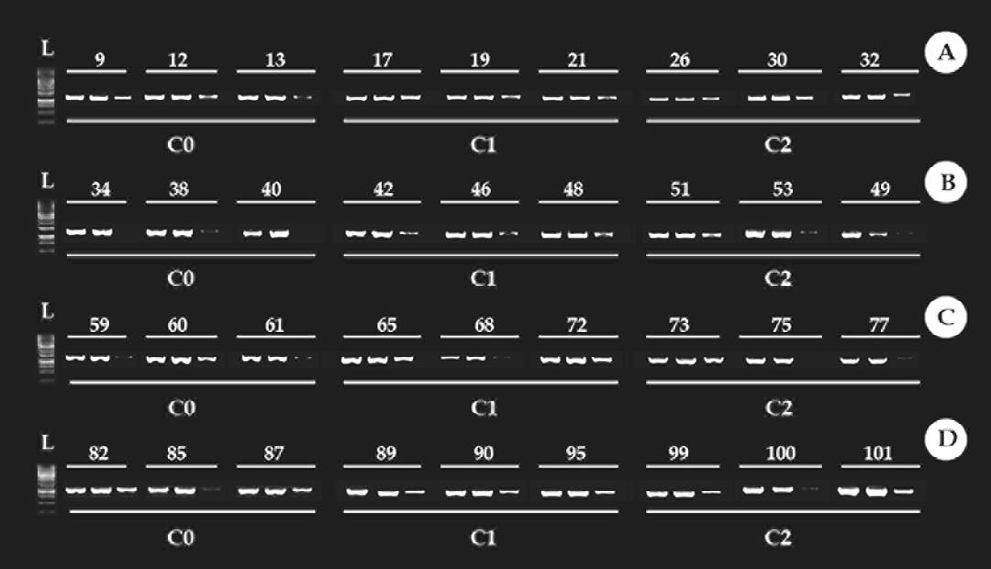
Figure 6: Methylation profile of the 18S ribosomal DNA gene (18S rDNA), in the muscle. Times used in the experiment 24h, 48h, 72h, and 96h (A, B, C, D, respectively). C0: control condition. C1: concentration 1, 30% of Trichlorfon LC50-96h diluted in water (0.261 mg/L). C2: concentration 2, 50% of Trichlorfon LC50-96h diluted in water (0.435 mg/L). First column: ladder.
Discussion
Despite recognizing the identical restriction site, the cutoff sensitivity of the HpaII and MspI enzymes differs [3, 8, 9]. The digestions generated by each enzyme are distinct as a result of their different cutting patterns. Because the frequency of C5mCGG palindromes in the tambaqui genome is higher and as a result, these fragments are more cleaved (resulting in a continuous pattern visible with a trace in the gel), a more effective digestion by the MspI enzyme was expected. Fulneček, et al. [10] claim that the MSAP (Methylation Sensitive Amplified Polymorphism) methodology is a reliable, low-cost, and simple way to find genomic sites where environmental and developmental stressors have altered the cytosine methylation. Additionally, according to these authors, the methylation pattern in plant genomes follows the given order: C5mCGG > 5mC5mCGG > 5mCCGG. In this study it assumed that the tambaqui genome followed a similar pattern.
Several studies have demonstrated that external influences, such as interactions with chemicals, can alter DNA methylation patterns [10, 11, 12]. According to Kamstra, et al. [13], who used the zebrafish (Danio rerio) as an experimental model for epigenetic and ecotoxicological studies, epigenetic processes in fish generate a pattern of DNA methylation that is sensitive to stressors.
The 18S rDNA gene is present in the genome in many copies, with methylation inactivating half of them [14]. This gene presents many CCGG sites, making it an excellent marker for research on DNA methylation. Therefore, even though the control samples showed some methylation, this result was anticipated because they represent the copies that are typically methylated by conventional epigenetic pathways [14, 15].
Even though a methylation profile was observed at the control concentration (C0), it was still possible to detect an increase in methylation in the 18S rDNA gene in samples from concentrations C1 (30% of LC50-96h, 0.261 mg/L), and C2 (50% of LC50-96h, 0.435 mg/L) at the same exposure times. Since the tambaqui 18S rDNA gene may be associated with transposable elements that are methylation targets, this result can be explained by the methylation process in this region. Studies conducted in Hoplosternum litoralle by da Silva, et al. [15] found co-localization of the transposable element Rex3 and 18S rDNA in this species, supporting this hypothesis. Another theory is that the methylation-friendly 18S rDNA regions are typical heterochromatin areas. Additionally, the method might be more effective in heterochromatic regions where cytosine methylation is concentrated. Furthermore, according to Burt, et al. [16], some transposable elements, like LINE R1 from Drosophila melanogaster, have a particular insertion site in the genome of this species and are typically inserted into the 28S rRNA genes. The rDNA gene is turned nonfunctional by any insertion and hosts can only survive because each individual usually possesses hundreds of copies of the rDNA gene, only a small percentage of which are disrupted (in most species, 5-20%, in certain species up to 50%) [17].
Therefore, other studies, such as that of Li, et al. [18], found that increased methylation in CCGG palindromes for the 18S rDNA gene in Arabidopsis samples after nickel exposure can support the idea of a connection between transposable elements and the 18S rDNA gene. Increased methylation in tambaqui exposure to Trichlorfon at concentrations C1 and C2 is consistent with the findings of Costa, et al. [19], who used tambaqui as an experimental model for Trichlorfon exposure and found that the retrotransposable element Rex3 had significantly increased in the species’ genome. In the present study, the 18S rDNA gene’s increased methylation may be directly linked to Rex’s inactivation. This is a hypothesis that must be investigated in further analysis. Other studies of these regions, mainly related to cancerous tissues, support the hypermethylation condition of the 18S rDNA gene transcript regions. According to Shao, et al. [2] and Chan, et al. [20], rDNA methylation is positively correlated with ovarian and breast cancer, respectively. The hypermethylation status of rDNA sequences, according to those authors, may be employed as a potential biomarker in the diagnosis and prognosis of these cancers. Additionally, it is important to underline the crucial function that DNA methylation plays in the epigenetic control of the genome and in gene expression, where variations in the methylation profile can lead to variant phenotypes that can be targeted for selection and responsible for epigenomic diversity [21]. Therefore, it is important to investigate how methylation affects species diversity and evolution, given its involvement in the development of diseases [9, 22].
Conclusion
The analysis made in this study showed that there was sensitivity to Trichlorfon and an increase in 18S rDNA methylated sites when tambaqui specimens were exposed to 30% and 50% of the LC50-96h. The presence of hypermethylated phenotypes was more significant at C1 concentration at 24h and 96h times. This suggests that Trichlorfon has a meaningful effect on the tambaqui genome, by inactivation of genes through methylation.
Acknowledgement
The current study was supported in part by INCT ADAPTA II funded by CNPq – Brazilian National Research Council (465540/2014-7), CAPES - Coordination for the Improvement of Higher Education Personnel (Code 001), and FAPEAM – Amazonas State Research Foundation (062.1187/2017). We are also grateful to MSC. Augusto Luiz Ferreira Junior for support in the statistical analysis.
References
-
Silva HCM, Carvalho APC, Gomes ALS, Artoni RF, Matoso DA (2022) Impact of trichlorfon Organophosphate use in Pisciculture: a review. Studies in Environmental and Animal Sciences 3: 1399-1423.
-
Shao F, Liu X, Zhang X, Wang Q, Wang W (2021) Methylation of 45S Ribosomal DNA (rDNA) Is Associated with Cancer and Aging in Humans. International of Genomics.
-
Silva HCM, da Silva AG, Idalino JJS, de Sousa FB, Gomes ALS, et al. (2019) Trichlorfon acute lethal toxicity to juvenile tambaqui (Colossoma macropomum). Aquaculture Research 51(2): 863-866.
-
Duncan WP, Idalino JJS, Silva AG, Moda RF, Silva HCM, et al. (2019) Acute toxicity of the pesticide trichlorfon and inhibition of acetylcholinesterase in Colossoma macropomum (Characiformes: Serrasalmidae). Aquaculture International 1-17.
-
Sambrook J, Russell DW (2001) Molecular Cloning: A Laboratory Manual, Vol. I. Cold Spring Harbor Press, Cold Spring Harbor, NY, pp: 633-664.
-
Gross MC, Schneider CH, Valente GT, Martins C, Feldberg E (2010) Variability of 18S rDNA locus among Symphysodon fishes: chromosomal rearrangements. Journal of Fish Biology 76(5): 1117-1127.
-
Weib CH (2007) StatSoft Inc, Tulsa, OK: Statistica, Version 8, AStA 91: 339-341.
-
Zilberman D, Henikoff S (2007) Genome-wide analysis of DNA methylation patterns. Development 134: 3959- 3965.
-
Salmon A, Clotault J, Jenczewski E, Chable V, Manzanares- Dauleux MJ ( 2008) Brassica oleracea displays a high level of DNA methylation polymorphism. Plant Science 174(1): 61-70.
-
Fulneček J, Kovařík A (2014) How to interpret Methylation Sensitive Amplified Polymorphism (MSAP) profiles? BMC Genetics pp: 15.
-
Collotta M, Bertazzi PA, Bollati V (2013) Epigenetics and pesticides. Toxicology 307: 7.
-
Florea AM (2013) DNA methylation pyrosequencing assay is applicable for the assessment of epigenetic active environmental or clinical relevant chemicals. BioMed Research International 2013: 486072.
-
Kamstra JH, Aleström P, Kooter JM, Legler J (2015) Zebrafish as a model to study the role of DNA methylation in environmental toxicology. Environmental Science and Pollution Research 22(21): 162162-162172.
-
Bacalini MG, Pacilli A, Giuliani C, Penzo M, Treré D, et al. (2014) The nucleolar size is associated to the methylation status of ribosomal DNA in breast carcinomas. BMC Cancer 14: 1-11.
-
Da Silva FA, Feldberg E, Goll LG, Carvalho-Zilse GA, Gross MC, et al. (2019) An HpaII/MspI-PCR assay to measure methylation of DNA in Hoplosternum littorale (Callichthyidae, Siluriformes) from a polluted environment in the central Amazon basin. Environmental Technology and Innovation 14: 100354.
-
Burt A, Trivers R (2006) Genes in conflict. Harvard University Press, Cambridge, MA.
-
Eickbush TH, Malik HS (2002) Origins and evolution of retrotransposons. In: Craig NL, Craig R, et al. (Eds.), Mobile DNA II. Washington, USA, pp: 1111-1144.
-
Li Z, Chen X, Li S, Wang Z (2015) Effect of nickel chloride on Arabidopsis genomic DNA and methylation of 18S rDNA. Electronic Journal of Biotechnology 18(1): 51-57.
-
Costa MS, Silva HCM, Soares SC, Favarato RM, Feldberg E, et al. (2022) A Perspective of Molecular Cytogenomics, Toxicology, and Retrotransposable Elements in Tambaqui (Colossoma macropomum ) Exposed to the Parasiticide Trichlorfon. Animals 12(15): 1-11.
-
Chan MW, Wei SH, Wen P, Wang Z, Matei DE, et al (2005) Hypermeyhylation of 18S and 28S ribosomal DNA predicts progression-free survival in patients with ovarian cancer. Clinical Cancer Research 11 (20): 7376- 7383.
-
Dar TUH, Akhter N, Dar SA (2022) Editorial: Epigenomic polymorphisms: The drivers of diversity and heterogeneity. Frontiers in Genetics 13: 5-7.
-
Best C, Ikert H, Kostyniuk DJ, Craig PM, Navarro-Martin L, et al. (2018) Epigenetics in teleost fish: From molecular mechanisms to physiological phenotypes. Comparative Biochemistry and Physiology. Part B, Biochemistry & Molecular Biology 224: 210-244.
- California Red-Legged Frog and Non-Listed Amphibians Response to Non-Native Fish Removal
- Industrial Standardization of the Bio-OS: Algorithmic Codification of Resilience Engineering Guidelines and Version V8 Architecture
- Climate Variability and the Sustainability of Snail Farming in Nigeria: Past Trends, Present Challenges and Potential Outlook
- The Evaluation of the Surveillance System of Anthrax in Gilgit-Baltistan, Pakistan, 2018
- Natural Decline to Extinction of A New Zealand Rabbit Population
- Mitochondrial Bio-Logistics: Steering Co-Enzyme Q10 and Lycopene Synergies within the Science 4.0 Bio-OS Framework