Diet Composition and Habitat Use by Red Deer in Two Rewilded Mountain Areas
The abandonment of extensive livestock farming has led to an increase in wild populations taking advantage of the vacuum in the trophic level of the habitats previously occupied by herds. Determining the composition of the diet is crucial to understand the level of adaptation of these new populations, as well as the potential impact on the new occupied habitats. The composition of the diet can also determine the type of the habitat use. This study compared the diet composition between two ecologically differentiated mountain Pyrenean areas, as well as between seasons and sexes. Additionally, a possible relationship between the habitats around the capture point and the diet composition was also sought. The results indicated a significant difference between the two areas, with a higher consumption of graminoids in the Axial Pyrenees and woody plants in the Pre- Pyrenees. On the other hand, the results showed that there was no seasonal pattern in the Axial Pyrenees, while it did exist in the Pre-Pyrenees. Significant differences were also found between the consumption of woody plants and herbaceous plants between sexes. In the case of the Pre-Pyrenees, the consumption of woody plants was higher for females, which has not been found in the literature, where it is concluded that males are more browser. Finally, differences were also found between the two areas in habitat use. In the Axial Pyrenees, the main use of the habitat was for refuge, whereas in the Pre-Pyrenees, it was for feeding, which is related to the harshness of the climate in the northernmost area.
Introduction
European landscapes were shaped by herbivory of wild megafauna in pre-agricultural times and by livestock and farming ever since. Yet during the last century humans have dramatically accelerated alterations and loss of biodiversity, with habitats becoming disturbance-dependent [1]. The decline and abandonment of extensive livestock farming and agricultural land has provided an ecological opportunity for wildlife to spread through these “new” habitats [2]. This
implies that wildlife may be changing their diet composition and habitat use to adapt to these new opportunities [3, 4]. Rewilding is a new methodology to preserve habitats where extensive livestock farming and land agriculture have decreased by returning these managed areas back to the wild, with passive or active actions [1, 5, 6].
The study of diet composition and food preferences is key to know if wildlife is producing significant impacts on habitat and community structure [7]. In most of species, as in the case of deer, diet composition varies depending on a wide range of factors such as habitat, season or sex [8, 9, 10, 11, 12]. For that reason, two nearby populations could present large differences in their diet composition. In highly seasonal environments, both plant quality and available biomass may act as dietary constraints [13]. For example, in a Mediterranean climate, summer is the most unfavorable season, as drought causes a shortage of food and water. Contrarily, in high mountain climates, the most unfavorable seasons are winter and early spring because of the snow cover and low temperatures, which prevents the animals to reach the food and also reduces the food availability [14, 15, 16]. In the unfavorable seasons the large herbivore diet composition changes to adapt to poor conditions and the consumption of woody plants is usually increased [8, 15]. These changes in the diet composition are also observed when the forage availability implies seasonal movements between high and low elevations [17]. Sex dimorphism in red deer (Cervus elaphus L.) also implies differences in feeding. Due to their smaller size, females cut grass at a lower height than males, and that is a disadvantage for males [18]. Compensating for this, in Mediterranean ecosystems, males tend to be browsers more often than females [11]. The reason is, in part, because their larger size provides them with the ability to reach parts of bushes or trees that females cannot reach [19]. In addition to these different morphological or size capacities, in general it has been shown that males and females select the habitat differently to the improve their feeding efficiency [20], which also implies differences in the diet. In Axial Pyrenees males use higher habitats than females, which implies fewer habitats in which to take refuge, since there are fewer trees, but a greater availability of herbaceous plants, since there are more parts of high mountains (Gort-Esteve et al., unpublished results).
Knowing the relation between diet composition and habitat use is fundamental to improve wildlife management and habitat conservation. Without the intervention of farmland activities, landscape change may create the right conditions for higher wildfire risk, due to fuel accumulation associated with increasing forest and shrub cover [1]. This is particularly worrisome in areas with low tree density, such as some Mediterranean areas. In Mediterranean rangelands, the probability of shrub encroachment in the open areas is very high, as shrubs are favored due to seed limitation in tree species by predatory pressure over oak acorns and deficient abiotic conditions, such as poor soils. In contrast, in landscapes with high forest density, as high mountain areas, forests can expand, increasing the forest mass and, in addition, reducing habitat heterogeneity. Heterogeneous landscapes with a diverse mosaic of habitats after farmland abandonment can be maintained by an assisted process, such as prescribed fires or wild herbivore reintroduction [1]. But it can also be a natural process driven by the comeback of large wild herbivores, which, at the same time, will have a direct impact on the distribution and use of habitats [21, 22]. Knowing how wildlife use these habitats is crucial to preserve them. Deer tend to use open areas, like grasslands or forest clearings, to forage, and closed habitats, like scrublands, to rest or take refuge [23, 24, 25, 26]. Forests provide both food and cover, thus representing an attractive and important habitat for deer populations [23]. Although in some cases, in protected areas, where human disturbances were highly reduced, deer mainly selected grassland and meadows [26], or like in areas with an agricultural land, where deer also selected grasslands over other habitats [27]. Consequently, it is thus essential to study the use of habitats by wildlife to apply the correct management at each area.
The goal of this study was to compare diet composition by red deer populations in two nearby mountain areas, the Axial Pyrenees and the Pre-Pyrenees. These areas differ widely in topography, maximum height and altitudinal range, climate and habitat composition. Therefore, we expected them to differ in diet composition. We also expected to find seasonal differences in each area. Specifically, we expected a higher percentage of woody plants in the diet during the hard seasons due to low forage availability: winter (and may be spring) at the Axial Pyrenees and summer (and may be winter) at the Pre-Pyrenees. In addition, we expected differences by sex, with the male diet composition higher in woody species year-round, as males tend to be more browsers than females. Moreover, we assessed if the proportions of immediate habitats around the capture points were could predict or affect the diet composition. An affirmative answer to this question would suggest a habitat selection driven by foraging, whereas a lack of relationship would suggest that other habitat uses may be prominent in driving habitat selection.
Methods
Study Areas
The present study was carried out in two areas in the northeast of the Iberian Peninsula, the National Game Reserve of Alt Pallars, in the Axial Pyrenees, and the National Game Reserve of Boumort, in the Pre-Pyrenees (Figure 1).
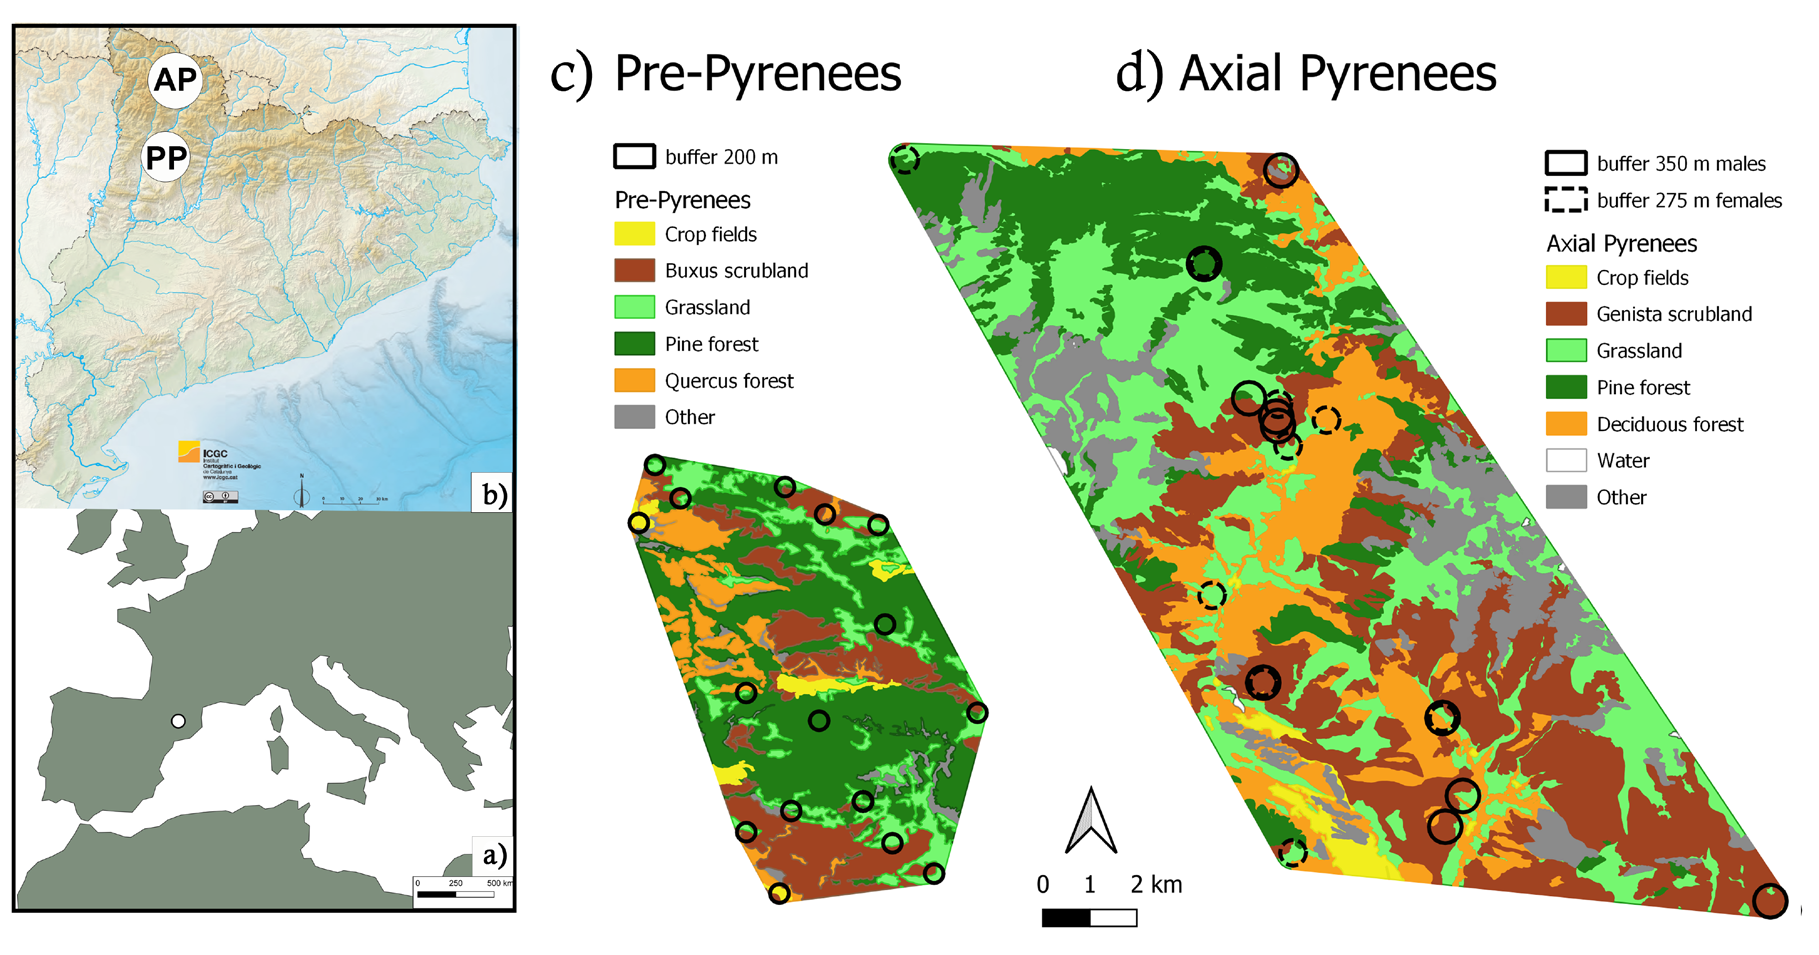
Figure 1: Map of major habitat classes in study areas: a) Study area in relation to Europe (Land map, version 4.1.0. Made in Natural Earth), b) Study areas in relation to Catalunya, AP: Axial Pyrenees and PP: Pre-Pyrenees (Physical and hypsometric map 2019, Cartographic and Geological Institute of Catalonia) c) Pre-Pyrenees d) Axial Pyrenees. Circles indicate locations of sampled individuals, with buffers used to characterize habitats around locations (see Methods) with the individuals’ buffers and the habitats of each area.
The National Game Reserve of Alt Pallars, in the Axial Pyrenees (42° 31′ 18″ N, 1° 11′ 18″ E), covers 81,772 ha and is one of a few high mountain game reserves in Spain, with the highest peak at “Pica d’Estats” with 3,143 m, and a wide altitudinal range (2,243 m, from the minimum altitude, at 900 m). Climate at the area is Atlantic and subalpine, with very cold temperatures and extensive snow cover in winter, which remains into spring, what makes these two seasons the hardest. Rainfall is often over 800-1,000 mm/ m2 per year. Above the treeline, grasslands, rocks and screes dominate the landscape. Fir (Abies alba Mill.) and mountain pine (Pinus uncinate Ramond ex DC) forests are found in the subalpine belt, and Scots pine (P. sylvestris L.) and deciduous forests composed mainly by sessile oak (Quercus petraea (Matt.) Liebl.), hazel (Corylus avellane L.), birch (Betula pendula Roth), aspen (Populus tremula L.) or ash (Fraxinus excelsior L.), dominating the montane belt, and forming extensive forests. The montane landscape is completed by rocky outcrops and extended formations of Pyrenean broom (Genista balansae L.) and grasslands. Grasslands are common and spread within the study area is high. Valley bottoms are the most anthropized, including often managed grasslands and some agricultural fields.
The National Game Reserve of Boumort, in the Pre- Pyrenees (42° 12′ N, 1° 06′ E), is smaller, with 13,097 ha. The maximum altitude is 2,077 m (Cap de Boumort), with an altitudinal range of 1,206 m (minimum altitude: 871 m). The climate is mainly a Mediterranean mountain continental influenced climate, with usually hot and dry summers, cold winters with snow accumulation and with most rainfall concentrated in spring and autumn (between 500-700 mm/ m2 per year. In this area the hardest seasons are winter and summer. In the highest levels, we find some subalpine grasslands, but the landscape is mainly dominated by mountain pine forests with bearberry (Arctostaphylos uva- ursi L.) and juniper (Juniperus communis L.) undergrowth and, below, Scots pine and Pyrenean pine (P. nigra subsp. salzmanii (Dunal) Franco) forest. At lower elevations we find a mosaic of holm oaks (Q. ilex L.) forest and large patches of thermophilic bushes. No managed grasslands or agricultural fields are found inside the Reserve. Pastures are poor, and the global grassland availability within the study area is low.
Both these areas have undergone a process of rewilding due to the drastic decrease of the number of extensive livestock and the increase of ungulate wildlife populations (Supplementary Table 1). The loss of farms in the study areas was 95.8% in the Axial Pyrenees and 81.3% in the Pre-Pyrenees from 1992 to 2021 (Register of livestock farms of the Ministry of Climate Action, Food and Rural Agenda, Generalitat de Catalunya, https://agricultura.gencat.cat/ ca/serveis/registres-oficials/ramaderia-sanitat-animal/ registre-explotacions-ramaderes/).
Sampling Methods
Samples were collected 4 times a year, matching seasons, between 2015 and 2020. Samples from autumn, winter and spring, which together cover the hunting season, were of ruminal content, and were provided by hunters. To have samples for every season, some of spring and all summer samples were obtained from faecal pellets, since hunting permits in spring were scant, and hunting is not allowed in summer. Both methods appear to produce comparable estimates of diet composition in wild ungulates [28]. We collected 3 samples per sex, season and reserve, for a total of 48 samples.
Laboratory Analysis
Diet composition was determined by the microhistological analysis of epidermal fragments as relative frequencies [28]. First, subsamples of wet faeces and rumen contents were lightly ground in a mortar to separate out the epidermal fragments. From each subsample, 10 g were placed in a test-tube with 5 ml of concentrated HNO3 [20]. The test tubes were placed for 1 min in a bath of water at 80℃ and then diluted with 200 ml of water. This suspension was passed through 0.5 mm and 0.1 mm filters. The 0.1 to 0.5 mm fraction was dispersed in a 50% aqueous solution of glycerin. Samples of the suspension were spread on glass microscope slides at a density that precluded any significant overlapping of fragments. Finally, cover slips were fixed to the slides with DPX microhistological varnish and left to dry overnight. Three slides were prepared from each subsample. An epidermal collection of the most significant and abundant plants of the study areas were prepared using the same technique.
All the slides were examined under an optical microscope at 100x to 400x magnification. We identified and counted a maximum of 600 fragments in each sample. The taxa identified from the epidermis fragments were grouped into five categories: graminoids, forbs, Pinus, Quercus and other woody species (Supplementary Table 2). They were grouped in order to increase the potential of the statistical analysis, due some species were hardly represented in the diet.
Statistical Analysis
To model diet data against the factors area, season and sex, we fitted Dirichlet models, which are appropriate for compositional data expressed as proportions, using the R package DirichletReg, version 0.7-0 [29]. Model selection with all combinations of factors and interactions was done using the Akaike Information Criterion (AIC), with likelihood ratio tests against the null model to obtain statistical significance. To determine which diet items contributed significantly to the differences detected in the selected model, we compared the model with all diet items against all models lacking one of the items using likelihood ratio tests (LTR). We also analyzed each area separately, with season and sex as candidate explanatory factors. To test for differences in the percentage of herbaceous and woody plants in the diet we used beta regression using R package betareg [31].
To explore the relationship between diet composition and habitat composition, we first extracted habitat percentages within individual buffers from the CORINE biotopes map of Catalonia using QGIS 3.26.2 [32, 33]. These habitats were grouped into five categories in the case of Axial Pyrenees (Genista balansae scrubland, Deciduous forest, Pine forest, Other woody habitats and Grassland) and in six categories in the case of Pre-Pyrenees (Buxus sempervirens L. scrubland, Crop fields, Quercus ilex forest, Pine forest, Grassland and Other habitats) (Supplementary Table 3). Habitat composition around sample locations was calculated as the percentage of habitats in a buffer defined for each reserve based on the deer home range obtained from Tellus GPS collars. The movement data was obtained from 4 individuals (2 males and 2 females), one of each sex for each area for at least 1 year. We defined the buffer radius as the average distance traveled daily. This gave us a radius of 350 m for males and 275 m for females in the Axial Pyrenees area, and a radius average of 200 m for both sexes in the Pre-Pyrenees area. We analyzed these data with Redundancy Analysis (RDA), an asymmetrical ordination technique, with habitat composition as the explanatory matrix and diet composition as the dependent matrix. Diet data were first transformed using the centered log-ratio, which is appropriate for compositional data and ensures the RDA, which implicitly uses the Euclidean distance, effectively uses the Aitchison distance on these data. Zero counts, which are not allowed by this transformation, were imputed with the multiplicative simple replacement method using function cmultRepl in the Compositions R package [34]. The RDA was performed with function RDA in the vegan R package [35]. All the statistical analyses were performed with R 4.2.1 [36].
Results
There were significant differences in diet composition between areas, but only between seasons in the case of pre- Pyrenees. The main differences were between graminoids, Pinus and other woody species. On the other hand, we found that in Axial Pyrenees were more grazers, and in Pre- Pyrenees more browsers. These differences were also in the habitat use, in the Axial Pyrenees the main function was as a refuge and in Pre-Pyrenees to feed.
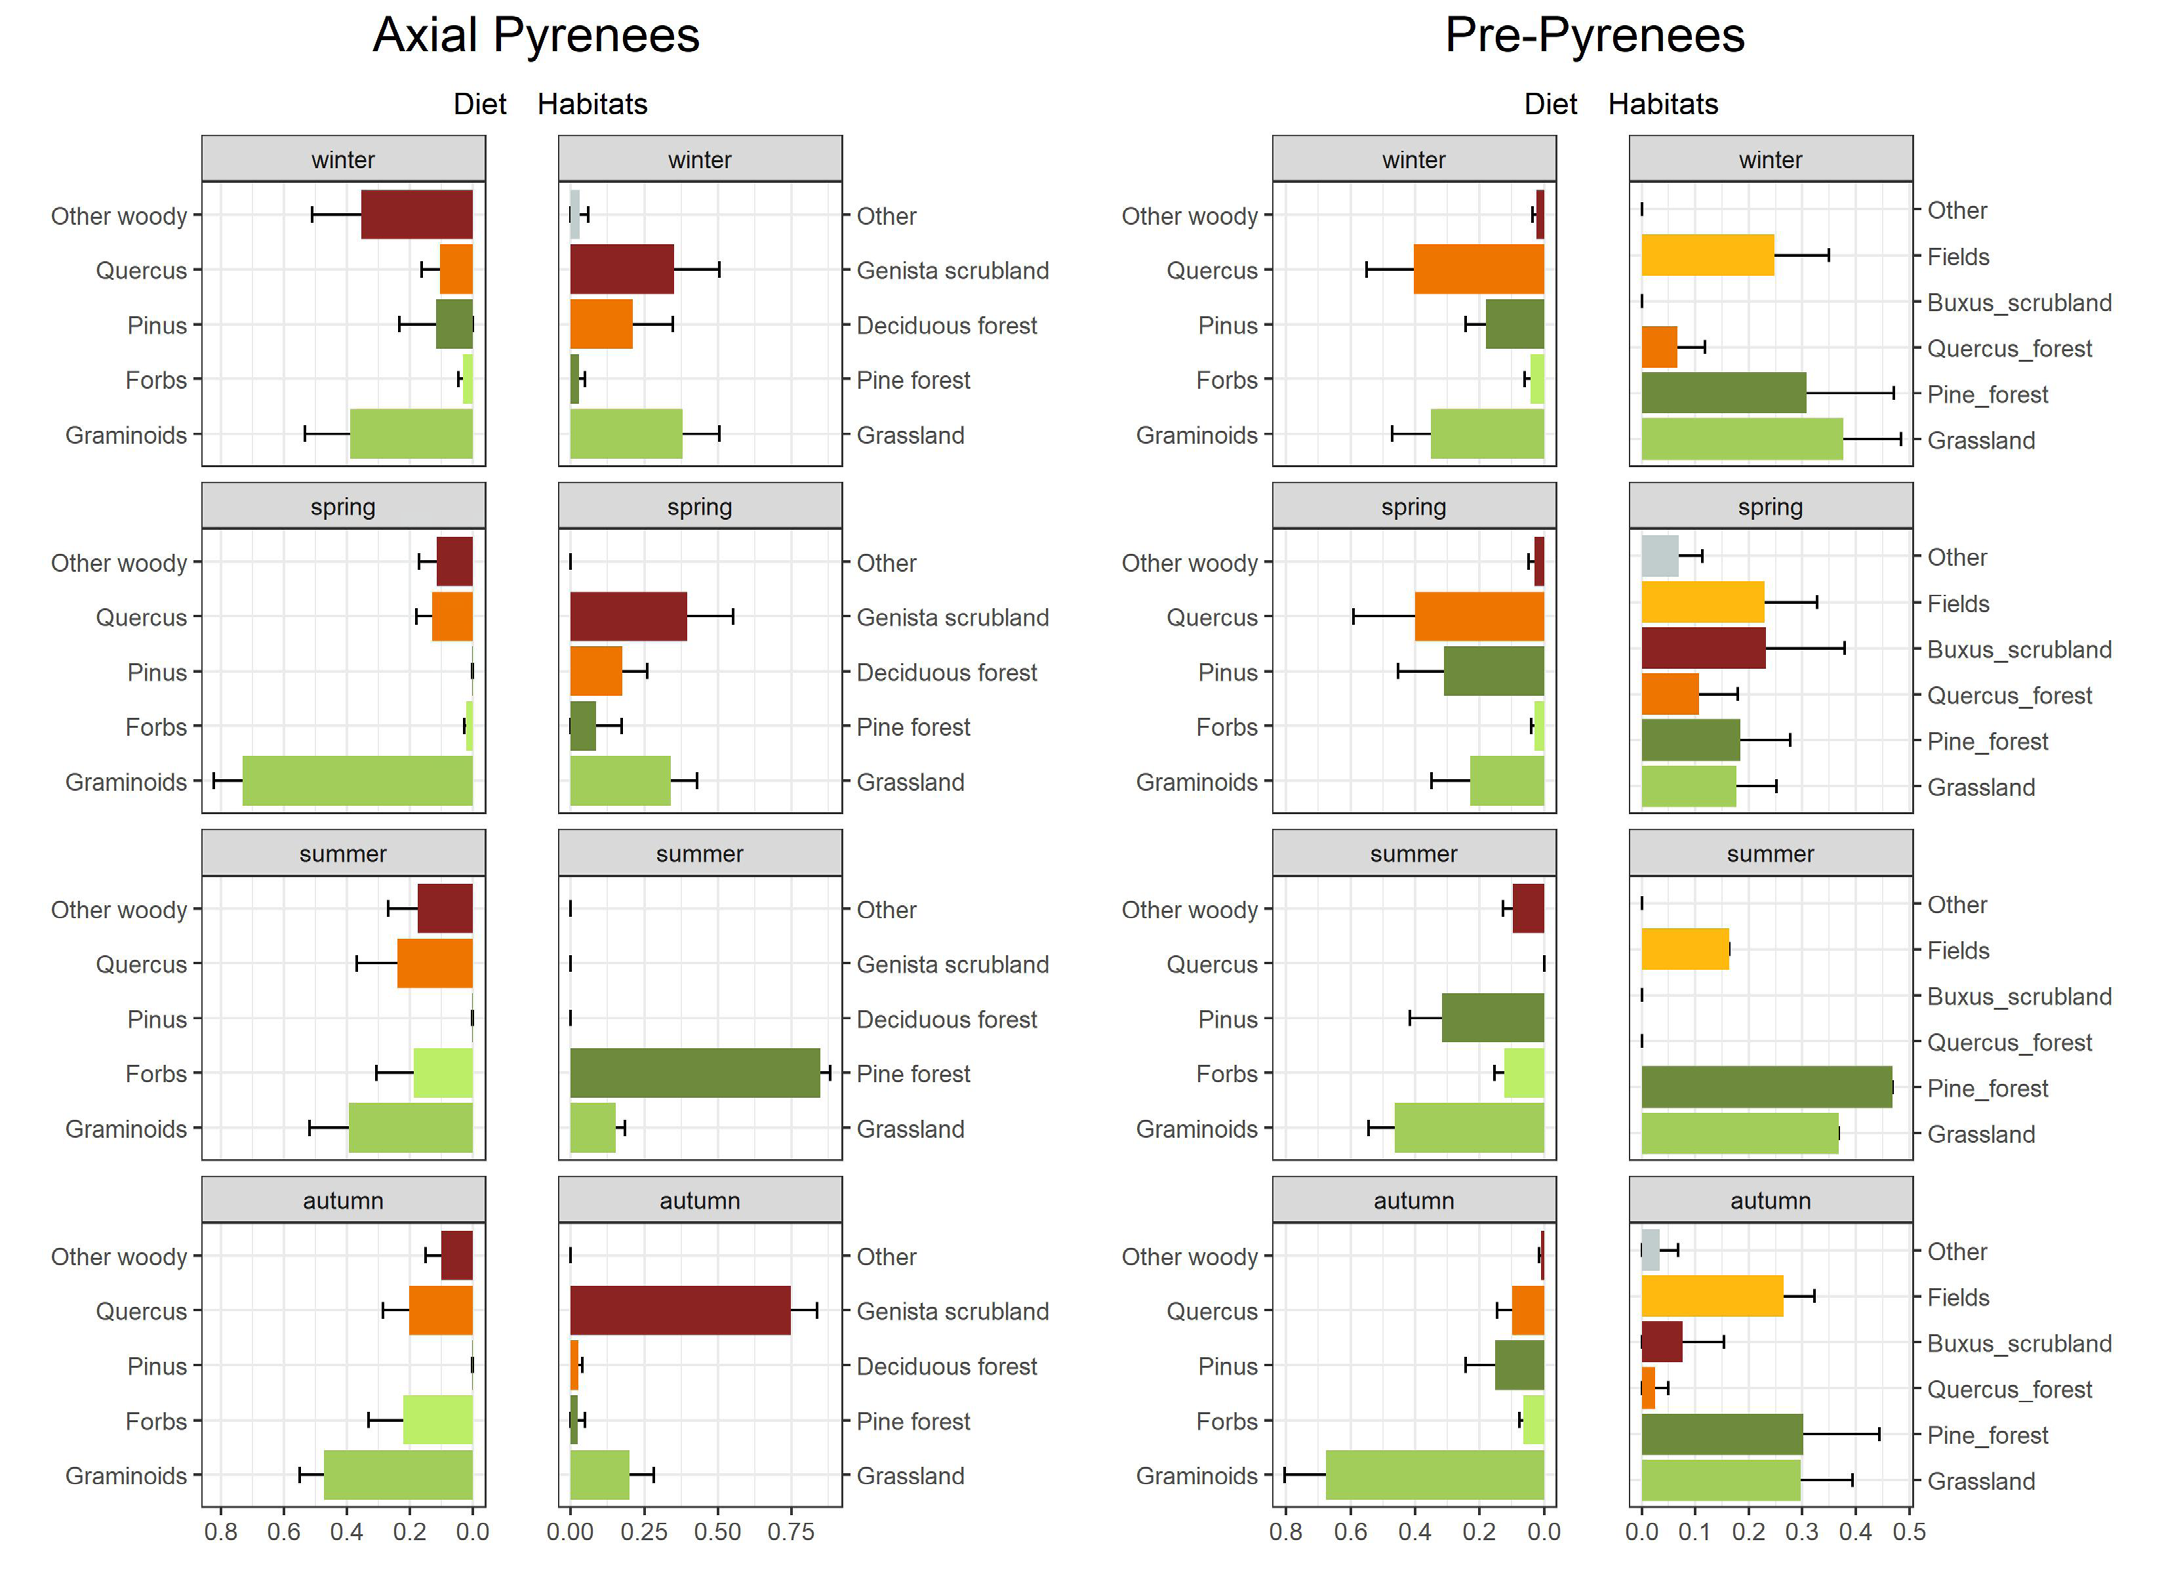
The best model for diet composition comprising both areas included only area as a significant variable (Table 1, p = 0.0011). The model including area and season also produced a significant model, but less parsimonious than with area alone (AIC = -472 for area only vs. AIC = -464.6 for area*season, Table 1). Differences between areas were due mostly to differences in the proportions of Pinus and other woody in the diet, with the former more prevalent in the Pre-Pyrenees site and the latter more prevalent in the Axial Pyrenees site (Figure 2 & Table 2).
| Model | K | AIC | ΔAIC | AIC weight | LL | p-value |
|---|---|---|---|---|---|---|
| area | 10 | -472 | 0 | 0.946 | 246 | 0.00108 |
| area*season | 40 | -465 | 7.52 | 0.022 | 272 | 0.00018 |
| area*sex | 20 | -464 | 8.44 | 0.014 | 252 | 0.00664 |
| area+sex | 15 | -464 | 8.54 | 0.013 | 247 | 0.01615 |
| Null | 5 | -462 | 10.3 | 0.005 | 236 | 1 |
Table 1: Model selection table for the best five models for diet composition with area, season and sex as candidate explanatory v
Table 1: Model selection table for the best five models for diet composition with area, season and sex as candidate explanatory variables. The columns represent the number of free parameters (K), the Akaike Information Criterion (AIC), the difference in AIC score between the best model and the model being compared (ΔAIC), the relative likelihoods of the models (AIC weights), the log-likelihood (LL) and the p-value for the likelihood ratio tests against the null model.
| Model | Deviance | AIC | LRT | p value |
|---|---|---|---|---|
| Full model | -492.14 | -472.14 | ||
| Forbs | -492.05 | -474.05 | 0.0907 | 0.763341 |
| Quercus | -491.57 | -473.57 | 0.5649 | 0.452287 |
| Graminoids | 490.24 | -472.24 | 1.8973 | 0.16838 |
| Other woody | -487.35 | -469.35 | 4.7863 | 0.028687 |
| Pinus | -481.46 | -463.46 | 10.6709 | 0.001088 |
Table 2: Likelihood ratio tests for models excluding a given diet item compared to the model including all items (Full model) for
Diet Composition in Axial Pyrenees
We could not detect significant differences by season or sex for the diet composition in the Axial Pyrenees, where the best Dirichlet model was the null model (Table
3). Graminoids were the dominant diet item in all seasons, and the consumption of more woody species in winter can be highlighted (Figure 2). Autumn and summer were the seasons with a more varied diet.
| Model | K | AIC | ΔAIC | AIC weight | LL | p-value |
|---|---|---|---|---|---|---|
| Null | 4 | -171 | 0 | 0.947 | 89.3 | - |
| season | 8 | -164 | 6.23 | 0.0421 | 90.2 | 0.7777 |
| sex | 16 | -161 | 9.14 | 0.01 | 96.7 | 0.249 |
| season+sex | 20 | -157 | 13.5 | 0.001 | 98.5 | 0.2938 |
| season*sex | 32 | -139 | 31.6 | <0.001 | 102 | 0.6602 |
Table 3: Model selection table for the best models for diet composition of Axial Pyrenees, with season and sex as candidate expla
Table 3: Model selection table for the best models for diet composition of Axial Pyrenees, with season and sex as candidate explanatory variables. The columns represent the number of free parameters (K), the Akaike Information Criterion (AIC), the difference in AIC score between the best model and the model being compared (ΔAIC), the relative likelihoods of the models (AIC weights), the log-likelihood (LL) and the p-value for the likelihood ratio tests against the null model.
Diet Composition in Pre-Pyrenees
In the Pre-Pyrenees, the best Dirichlet model for the diet composition included the variable season (Table 4, p = 0.0025). Adding sex in interaction with season also produced a significant (p = 0.031, LRT test against model with season alone), but less parsimonious model as judged by the Akaike Information Criterion (Table 4). Differences among seasons were due to changes in the proportions of graminoids, Pinus and Forbs in the diet (Figure 2 & Table 5). Graminoids were more prevalent in the diet in summer and autumn as compared to winter and spring (with significant differences for spring vs. summer, p = 0.00033, and for spring vs. autumn, p = 0.0037). The mean contribution of Pinus to the diet was greater in spring and summer, but with low support (statistically significant only for summer vs. each of the other seasons, p < 0.05). Forbs showed a higher proportion in the diet in summer and autumn (p = 0.00478 for spring vs. summer).
| Model | K | AIC | ΔAIC | AIC weight | LL | p-value |
|---|---|---|---|---|---|---|
| season | 20 | -200 | 0 | 0.803 | 120 | 0.0024 |
| season+sex | 25 | -196 | 4.22 | 0.098 | 123 | 0.0039 |
| Null | 5 | -195 | 5 | 0.066 | 102 | - |
| season*sex | 40 | -193 | 6.69 | 0.028 | 137 | 0.0006 |
| sex | 10 | -190 | 10.2 | 0.005 | 105 | 0.4438 |
Table 4: Model selection table for the best models for diet composition of Pre-Pyrenees, with season and sex as candidate explana
Table 4: Model selection table for the best models for diet composition of Pre-Pyrenees, with season and sex as candidate explanatory variables. The columns represent the number of free parameters (K), the Akaike Information Criterion (AIC), the difference in AIC score between the best model and the model being compared (ΔAIC), the relative likelihoods of the models (AIC weights), the log-likelihood (LL) and the p-value for the likelihood ratio tests against the null model.
| Model | Deviance | AIC | LRT | p value |
|---|---|---|---|---|
| Full model | -239.77 | -199.8 | ||
| Quercus | -236 | -202 | 37.673 | 0.287718 |
| Other_woody | -232.92 | -198.9 | 68.487 | 0.07688 |
| Forbs | -231.59 | -197.6 | 81.787 | 0.042459 |
| Pinus | -230.43 | -196.4 | 93.442 | 0.025048 |
| Graminoids | -220.37 | -186.4 | 194.01 | 0.000226 |
Table 5: Likelihood ratio tests for the Pre-Pyrenees model excluding a given diet item compared to the model including all items
Woody vs Herbaceous
The best beta regression model for the consumption of woody vs herbaceous species, as judged by the Akaike Information Criterion, included all factors (area, season and sex), and their pairwise interactions (Table 6). The significant differences between areas were due to a higher consumption of woody species in the Pre-Pyrenees (p-value = 0.0275) (Figure 3). The differences in the consumption of woody species between sexes was the main cause of these differences between areas. Specifically, the differences between areas were caused by the differences between the females’ diets (p-value < 0.0001) (Figure 3). In the Axial Pyrenees there were not differences in the seasonality of woody consumption in females, but males consumed significantly more woody species in winter and summer than in the other seasons (winter – spring: p-value = 0.0011; winter – autumn: p-value = 0.0044; spring – summer: p-value = 0.0094; summer – autumn: p-value = 0.0261) (Figure 3). In the Pre-Pyrenees both sexes differed significantly in their consumption of woody species. Females consumed more woody species in spring than in summer or autumn (spring – summer: p-value < 0.0001; spring – autumn: p-value = 0.0090), whereas males consumed less woody species in autumn than in any of the other seasons (winter – autumn: p-value = 0.0003; spring – autumn: p-value = 0.0005; summer – autumn: p-value = 0.0085) (Figure 3).
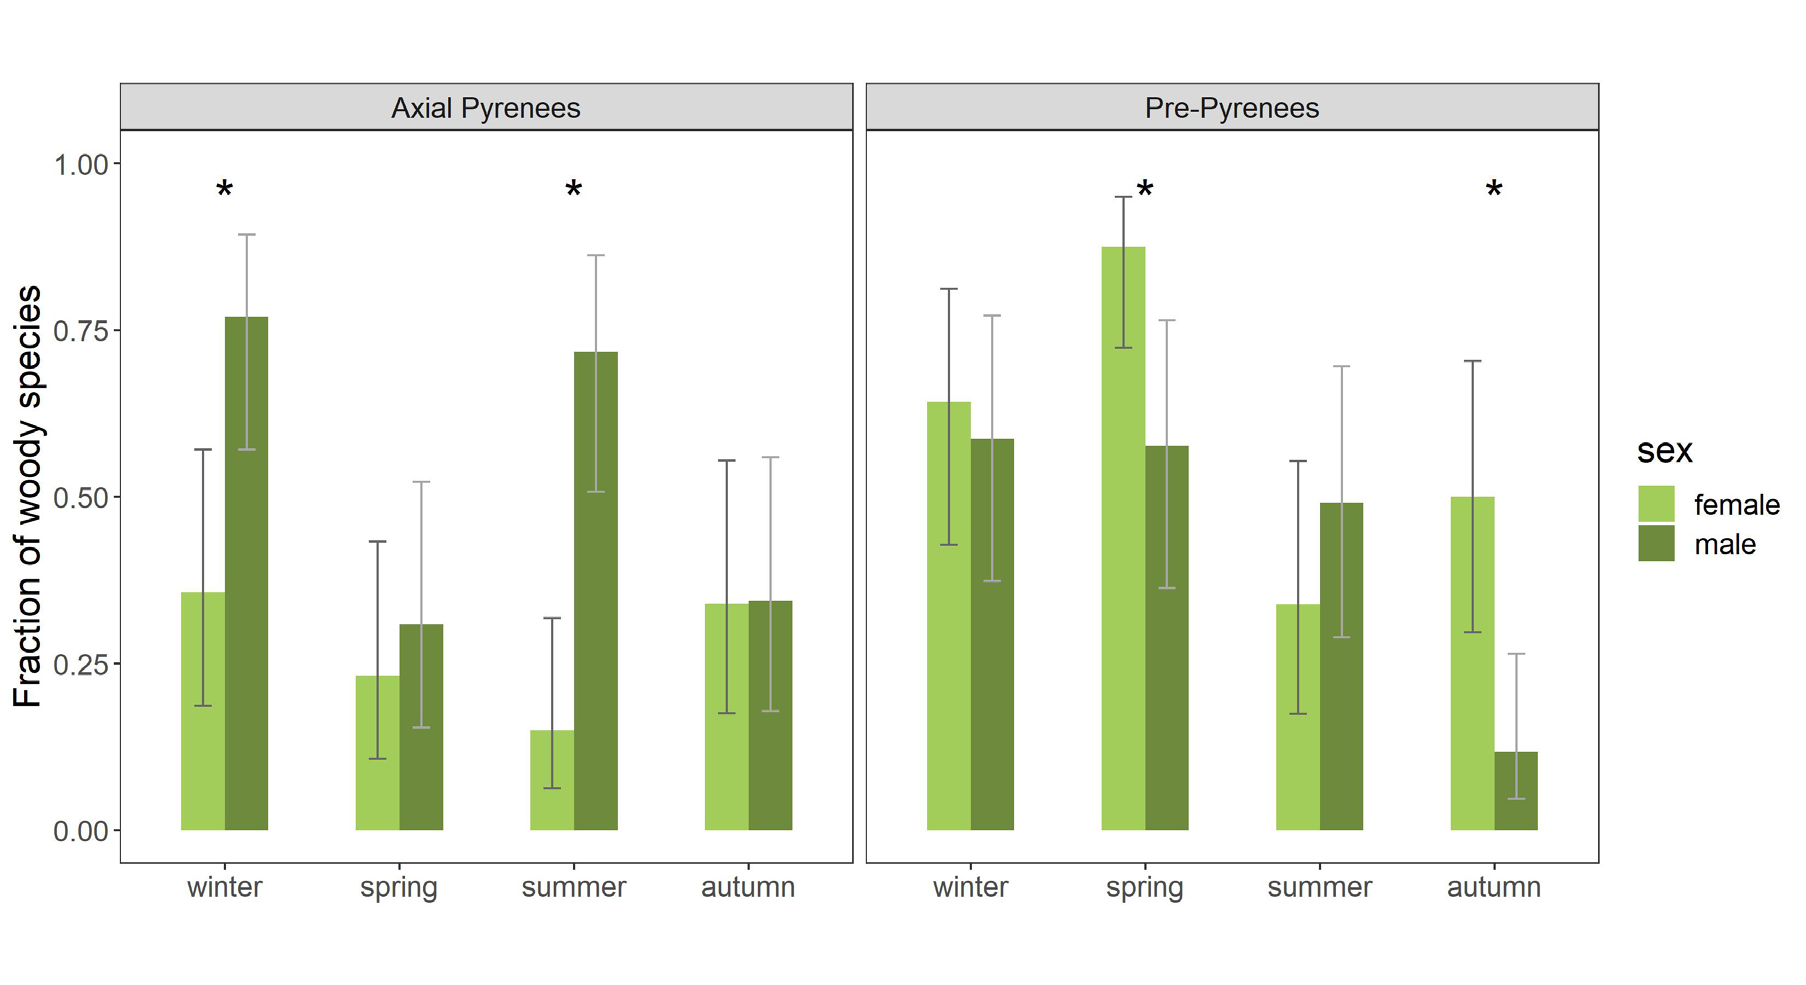
Figure 3: Mean fraction of woody species in the diet composition of the deer populations at the two study areas (Axial Pyrenees and Pre-Pyrenees), by sex and season. Mean expected values and 95% confidence intervals are from predictions obtained from the best beta regression model (Table 6). Asterisks indicate statistically significant differences between sexes within area and season.
| Model | K | AIC | ΔAIC | AIC weight | LL | p-value |
|---|---|---|---|---|---|---|
| Full2 | 13 | -14.5 | 0 | 0.934 | 21.3 | <0.001 |
| Full3 | 16 | -9.1 | 5.43 | 0.062 | 21.5 | <0.001 |
| area*sex+season | 7 | -2.52 | 12 | 0.00231 | 9.26 | 0.0021 |
| area*season | 4 | -0.76 | 13.8 | 0.00096 | 5.38 | 0.0169 |
| area+sex*season | 9 | 1.21 | 15.7 | 0.00036 | 9.4 | 0.0088 |
Table 6: Model selection table for the best models for diet composition of woody and herbaceous species of Pre-Pyrenees, with are
Table 6: Model selection table for the best models for diet composition of woody and herbaceous species of Pre-Pyrenees, with area, season and sex as candidate explanatory variables. The columns represent the number of free parameters (K), the Akaike Information Criterion (AIC), the difference in AIC score between the best model and the model being compared (ΔAIC), the relative likelihoods of the models (AIC weights), the log-likelihood (LL) and the p-value for the likelihood ratio tests against the null model. Model Full2 includes all factors and pairwise interactions; model Full3 is Full2 plus the three-way interaction.
Habitat Use
The relationship between diet composition and habitat composition differed between areas. In the Axial Pyrenees, the species found in the diet and the dominant species in the surrounding habitats, around the capture points, were not related, as the RDA analysis showed (permutation test, p =
0.479; Figure 4). In contrast, we found a strong relationship in the Pre-Pyrenees (permutation test, p = 0.003; Figure 4). In this area, the two more abundant groups in the diet, graminoids and Pinus, were directly related with the two more abundant habitats, grasslands and Pinus forests.
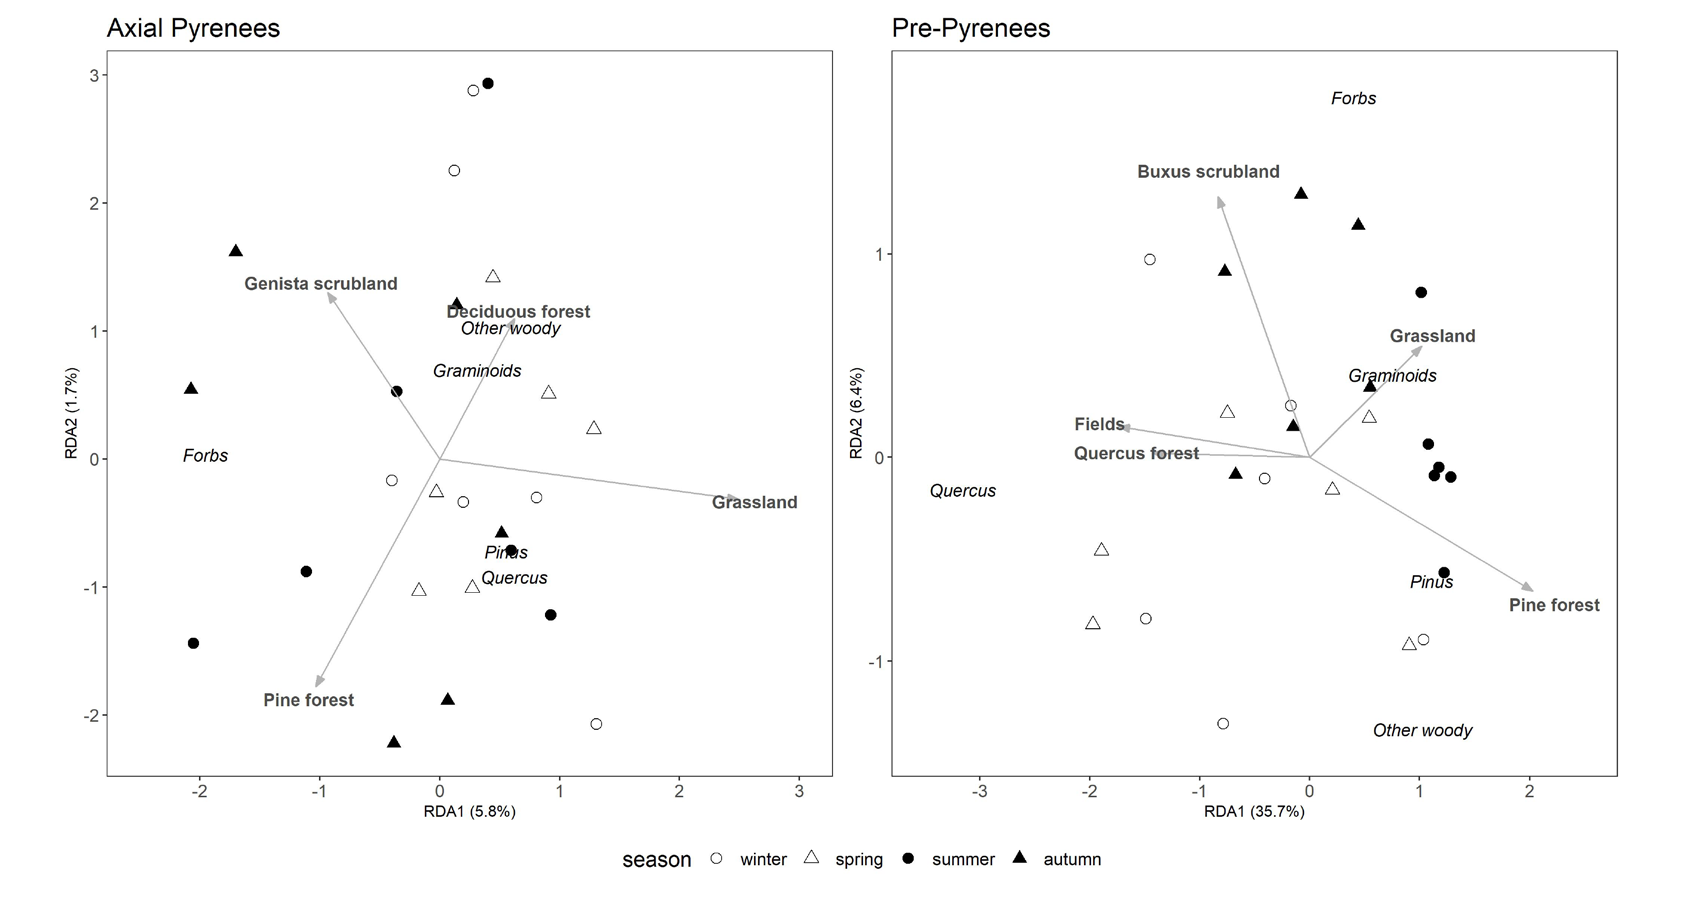
Figure 4: Redundancy analysis of diet composition and use of habitat in the Axial Pyrenees and Pre-Pyrenees study areas. Arrows and bold labels show biplot scores for the explanatory habitat variables, while labels in italics are ordination scores for the response matrix (i.e., diet composition). Dots show individual deer, with symbols indicating the season that the sample comes from. Percentages in the axis labels show the percentage of total variance explained by each (cumulative 42.1%; 48.8% for all four canonical axes).
Discussion
A specific Diet for Each Area
There were differences in the diet composition between both areas, as we hypothesized. The consumption of other woody stood out in the Axial Pyrenees, mainly because of the high consumption of Calluna vulgaris L. In study area of the Pre-Pyrenees, the availability of habitats with this species was null [32], and no species of this family was abundant. C. vulgaris has been found in the diet of red deer in other studies as in the case of Isle of Rum Island. Virtanen, et al. [37] study the effects of deer on the vegetation of this Isle, and indicates that high deer densities within an unculled food-limited population were however associated with negligible effects on plants in Calluna-Molinia wet heath vegetation. This might also be our case. A preference for C. vulgaris has also been found for another cervid, the roe deer (Capreolus capreolus L.), in autumn in Poland [38]. And, also, in chamois (Rupicapra rupicapra L.) [39, 40], which shares the niche with red deer in this area, which gives rise to thinking about interspecies competition. On the other hand, another difference between these areas was in the consumption of Pinus, which was higher in the Pre-Pyrenees. This high consumption of Pinus was also found in a study of the diet composition of red deer in the western Axial Pyrenees [8]. In the case of the Pre-Pyrenees, it could be, as in the case of Garin’s study, that there was a high consumption of Pinus because the availability of more nutritious food was limited in the area. This may also explain our finding that in the Pre- Pyrenees red deer were more browsers than in the Axial Pyrenees. It also fits with the three feeding patterns proposed by Garin, et al. [8] for Europe. In this scheme, the Axial Pyrenees would fit between the oceanic, with preponderance of the herbaceous and Ericaceae woody plants, and the center-European model, with the alternation of herbaceous and woody plants, whereas the Pre-Pyrenees would better fit the Mediterranean model, with a preponderance of woody species all year round.
Seasonality in Diet Composition
In contrast with most studies on diet in red deer populations, we did not find a significant clear seasonal trend in the case of Axial Pyrenees. Graminoids were the main group consumed during all seasons, in this area there were more habitats with availability of herbaceous plants and graminoids. In this area the hardest seasons to find food were winter and spring. In winter, the diet composition was based on graminoids and other woody species. During this season the snow depth prevents deer from feeding at higher altitudes, so they have to move to lower areas with higher food availability where they find grasslands with no or little snow cover [41]. Other habitats where they found food in winter were deciduous forests, where deer can feed on the fallen leaves, as sika deer (Cervus nippon Swinhoe) do under food limitation [42]. This was also the season when the most Pinus was consumed, in agreement with other studies that also show increased consumption of pine and other woody species in hard seasons with poor forage quality [8, 15]. In this area spring was an unfavorable season, which could be called “late winter”. During these months the snow was still found in many habitats, especially in the higher ones, but in some others, like valley bottoms, it was starting to melt. For this reason, it could be that the consumption of graminoids increased and that of woody species decreased. In summer and autumn, although graminoids continue to dominate, the composition of the diet was more varied due to the absence of snow. Also noteworthy is the increased the consumption of Quercus, since in this area the dominant oak species (Q. petraea) is deciduous.
In the Pre-Pyrenees there were significant differences between seasons. In both winter and spring, the diet groups that dominated the diet composition were graminoids, Quercus and Pinus. In the Pre-Pyrenees, the species of Quercus that dominated was Q. ilex, a perennial one. There could be two reasons why red deer in this area prefer Quercus in winter and spring. One reason is that this species begins to sprout in late winter. For this reason, Quercus may have more tender shoots in these seasons and leaves will be generally more palatable [43]. The consumption of Quercus and Pinus leaves could be due to higher protein and digestibility levels reported for leaves compared with graminoid stems, depending on the maturity of their tissues [44, 45, 46]. In summer, there were mainly two groups that dominated the diet composition, graminoids and Pinus. In this dry season, the percentage that was consumed from Quercus was replaced by Pinus, probably because the dry thorns of Q. ilex leaves are excessively unpalatable. Contrarily to most studies, where pine is consumed almost exclusively in winter, in this area it is consumed also in summer. The reason could be that graminoid species are also very dry, as has been suggested for other areas [8, 47]. In autumn, the diet composition was more uniform than in other seasons, being most of the diet composition graminoids, possibly because the increase of rainfall in this season makes these species regrow and become more palatable, at a time when tender shoots of other species are less abundant.
Differences between Sexes
We expected males to be more browsers than females in both areas, as found in most of studies [11, 12, 18, 19]. This expectation was upheld in the Axial Pyrenees area (in winter and summer), but not in the Pre-Pyrenees area, where females tended to be more browsers than males (with statistically significant differences between spring and other seasons). The fact that the males were more browsers was in agreement with the Jarman Bell principle [48], which predicts that larger animals can subsist on lower quality bulk food. This principle is based on the fact that males have a larger rumino-reticular volume than females, which makes them more efficient at assimilating fibers, and have lower relative metabolic requirements. Additionally, we also expected more differences between sexes in the Axial Pyrenees due to the differences in their seasonal movements. Monitoring data and the GPS movement analysis strongly suggest that males and females select habitats differently in each area, with populations spatially segregated by sex throughout most of the year (with the exception of the rut) in the Axial Pyrenees, but not in the Pre-Pyrenees (Gort-
Esteve et al., unpublished results). In Axial Pyrenees, it seems that males made greater movements during the year than females, having a home range up to 7 times greater, which would explain their differences in the consumption of woody and herbaceous plants between seasons.
The finding that females were more browsers than males in the Pre-Pyrenees area was unexpected, and we have not been able to find a similar observation in the published literature. A possible explanation for this observation was the lower quality of forage in the study area. When resources are scarce small animals have an advantage because they need less food [49]. At any rate, our results emphasize the high plasticity of this species in terms of diet.
Relation between Diet and Habitat Use
Studies concur in that deer use shelter habitats for refuging or resting and open areas mainly to feed [24, 26, 50]. Our results show that habitat and diet composition were significantly related at one of the areas (Pre-Pyrenees) but not at the other (Axial Pyrenees). This contrasting result suggests that there may be differences in the drivers of habitat selection between the two areas, with foraging a stronger driver in the Pre-Pyrenees, which might be explained by the composition and configuration of the landscape at each of the areas, and the role those specific habitats play as providers of forage or of places for resting and taking refuge.
In the Axial Pyrenees, winter was the only season when the diet and the habitat composition were related, with more than 50% of the home range composed of habitats dominated by species found in the diet (Figure 2). The most abundant habitats in deer winter home range were grasslands and scrubs of G. balansae. Grasslands are congruent with the most abundant group in diet composition, graminoids. There was a high percentage of scrubs of G. balansae in all seasons expect on summer, yet we never found this species in the diet composition, possibly because of its toxicity [51]. Scrubs of G. balansae could instead be used for resting or as a refuge, as this specie in this area had a high height that could protect deer form wind and without letting the snow penetrate inside it creating the effect of a cave. Similarly, in summer pine forest were abundant in the habitat composition, even though Pinus was the only diet group that was not consumed. We hypothesize that, similarly to the scrubs of G. balansae, the pine forest was used as a refuge, but in this case from high temperatures, while deer possibly fed on species from crown gap areas, as Matsubayashi, et al. [50] observed for lesser mouse-deer (Tragulus javanicus Osbeck) deer in Southeast Asia. Unlike most studies, which show that deer prefer habitats where they can both take refuge and forage [23, 25], in the Axial Pyrenees it seems that the main habitat is used mostly as refuge, perhaps because those dual-function habitats are not available. In contrast, in the Pre-Pyrenees we found that scrubs of boxwood, B. sempervirens, were abundant within the habitat composition in each season. The reason could be that this habitat is very suitable for deer, as it combines protection and food. Deer can then take refuge and rest under boxwood, and feed in patches of grassland interspersed among scrub patches [52]. Boxwood did not appear in the diet composition due to its toxicity [53, 54]. On the other hand, we also found grasslands and pine forest, in accordance with the amounts of graminoids and Pinus that we found in the diet composition. For these reasons, in this area it seems that the main habitat is used mostly for feed.
Conclusions
Red deer had a high flexibility and adaptability in their diet. In two areas as differentiated as those of this work we have been able to check how the composition of the diet fits perfectly. The contrast between the diet composition of each area provided us with key information to evaluate the possible impact of red deer populations on the different habitats. The high consumption of woody species confirmed that these populations could play a role on woody species control, contributing to the maintenance of open areas such as clearings or grasslands. On the other hand, the consumption of herbaceous species gave us reason to think that they could be occupying part of the trophic niche of the domestic herds of grazers (cattle and sheep) that have disappeared. Not only diet, but they also adapted habitat use. In more unfavorable climatological conditions, such as those of the Axial-Pyrenees, the main use of the habitat is for refuge, while in more favorable conditions, such as those of the Pre-Pyrenees, the main use of the habitat is for feeding.
Declaration of Interest
There are not actual or perceived conflicts of interest for all authors.
Funding
This research has been funded by the Department of Climate action, Food and Rural agenda of the Generalitat de Catalunya.
Acknowledgements
We would like to thank the financing of the project to the Department of Climate action, Food and Rural agenda (Generalitat de Catalunya) and to Forestal Catalana. We would also like to thank the staff of the Nacional Game Reserves, particularly Jordi Palau, reserve manager for part of the study period, Joan Curià and Juan Fernández, the forest technicians, and Marc Lluçà and Ramon Lladós. Finally, I can’t leave my guides in the animal science laboratory of the UAB, Anna Garrit, Carme Martínez and Cristina Xufré.
Author Contributions Statement
AGE, JRO and JLLR conceived the ideas; AGE, JLLR, APH and JB designed methodology; AGE and JRO collected the data; AG and JB did the laboratory analysis; AGE and JLLR analyzed the data; all the authors led the writing of the manuscript. All authors contributed critically to the drafts and gave final approval for publication.
References
-
Navarro LM, Proença V, Kaplan JO, Pereira HM (2015) Rewilding european landscapes. In: Pereira HM, Navarro LM (Eds.), Springer Nature, pp: 227.
-
Acevedo P, Farfán MA, Márquez AL, Delibes-Mateos M, Real R, et al. (2011) Past, present and future of wild ungulates in relation to changes in land use. Landscape Ecology 26(1): 19-31.
-
Svenning JC, Pedersen PBM, Donlan CJ, Ejrnæs R, Faurby S, et al. (2016) Science for a wilder Anthropocene: synthesis and future directions for trophic rewilding research. Proc Natl Acad Sci USA 113: 898-906.
-
Iacolina L, Lukassen MB, Fløjgaard C, Buttenschøn R, Nielsen JL, et al. (2020) eDNA and metabarcoding for rewilding projects monitoring, a dietary approach. Mammalian Biology, 100(4): 411-418.
-
Lorimer J, Sandom C, Jepson P, Doughty C, Barua M, et al. (2015) Rewilding: science, practice, and politics. Annual Review of Environment and Resources 40: 39-62.
-
Corlett RT (2016) Restoration, reintroduction, and rewilding in a changing world. Trends in ecology and evolution 31(6): 453-462.
-
Zielke L, Wrage-Mönnig N, Müller J, Neumann C (2019) Implications of spatial habitat diversity on diet selection of European Bison and Przewalski’s Horses in a Rewilding Area. Diversity 11(4): 63.
-
Garin I, Aldezabal A, García-González R, Aihartza JR (2001) Composición vegetal y calidad de la dieta del ciervo (Cervus elaphus L.) en el norte de la península ibérica. Animal Biodiversity and Conservation 24(1): 53-63.
-
Gebert C, Verheyden‐Tixier H (2001) Variations of diet composition of red deer (Cervus elaphus L.) in Europe. Mammal Review, 31(3‐4): 189-201.
-
Krojerová‐Prokešová J, Barančeková M, Šustr P, Heurich M (2010) Feeding patterns of red deer Cervus elaphus along an altitudinal gradient in the Bohemian Forest: effect of habitat and season. Wildlife Biology 16(2): 173- 184.
-
Azorit C, Tellado S, Oya A, Moro J (2012) Seasonal and specific diet variations in sympatric red and fallow deer of southern Spain: A preliminary approach of feeding behaviour. Animal Production Science 51(4): 78-82.
-
Miranda M, Sicilia M, Bartolomé J, Molina-Alcaide E, Gálvez-Bravo L, et al. (2012) Foraging sexual segregation in a Mediterranean environment: Summer drought modulates sex-specific resource selection. Journal of Arid Environments 85: 97-104.
-
Zweifel‐Schielly B, Leuenberger Y, Kreuzer M, Suter W (2012) A herbivore’s food landscape: seasonal dynamics and nutritional implications of diet selection by a red deer population in contrasting Alpine habitats. Journal of Zoology 286(1): 68-80.
-
Álvarez G, Ramos J (1991) Estrategias alimentarias del ciervo (Cervus elaphus L.) en Montes de Toledo. Doñana Acta Vertebrata 18(1): 63-99.
-
Bugalho MN, Milne JA (2003) The composition of the diet of red deer (Cervus elaphus) in a Mediterranean environment: a case of summer nutritional constraint?. Forest Ecology and Management 181(1-2): 23-29.
-
Suter W, Suter U, Kriisi B, Schütz M (2004) Spatial variation of summer diet of red deer Cervus elaphus in the eastern Swiss Alps. Wildlife Biology 10(1): 43-50.
-
Zhang M, Liu Z, Teng L (2013) Seasonal habitat selection of the red deer (Cervus elaphus alxaicus) in the Helan Mountains, China. Zoologia (Curitiba) 30(1): 24-34.
-
Clutton-Brock TH, Guinness FE, Albon SD (1982) Red deer: behavior and ecology of two sexes. University of Chicago Press, Chicago, USA.
-
Bugalho MN, Milne JA, Racey PA (2001) The foraging ecology of red deer (Cervus elaphus) in a Mediterranean environment: is a larger body size advantageous?. J Zool 255(3): 285-289.
-
Stewart KM, Bowyer RT, Weinberg PJ (2011) Spatial use of landscapes. Hewitt DG (Ed.), Biology and Management of White-tailed Deer. CRC Press, Boca Raton, FL, USA, pp: 181-217.
-
Vera FWM (2000) Grazing ecology and forest history. Cabi.
-
https://pubmed.ncbi.nlm.nih.gov/16701360/
-
Borkowski J, Ukalska J (2008) Winter habitat use by red and roe deer in Pine-dominated forest. Forest ecology and management 255(3-4): 468-475.
-
Bonnot N, Morellet N, Verheyden H, Cargnelutti B, Lourtet B, et al. (2013) Habitat use under predation risk: hunting, roads and human dwellings influence the spatial behaviour of roe deer. European journal of wildlife research 59(2): 185-193.
-
Alves J, da Silva AA, Soares AM, Fonseca C (2014) Spatial and temporal habitat use and selection by red deer: The use of direct and indirect methods. Mammalian Biology 79(5): 338-348.
-
Laguna E, Carpio AJ, Vicente J, Barasona JA, Triguero- Ocaña R, et al. (2021) The spatial ecology of red deer under different land use and management scenarios: Protected areas, mixed farms and fenced hunting estates. Science of The Total Environment 786: 147124.
-
Lande US, Loe LE, Skjærli OJ, Meisingset EL, Mysterud A (2014) The effect of agricultural land use practice on habitat selection of red deer. European Journal of Wildlife Research 60(1): 69-76.
-
Homolka M, Heroldová M (1992) Similarity of the results of stomach and faecal contents analyses in studies of the ungulate diet. Folia zoologica (Brno) 41(3): 193-208.
-
Maier MJ (2021) DirichletReg: Dirichlet Regression. R package version 0.7-1.
-
Bartolomé J, Franch J, Plaixats J, Seligman NG (1998) Diet selection by sheep and goats on Mediterranean heath- woodland range.
-
Cribari-Neto F, Zeileis A (2010) “Beta Regression in R.” Journal of Statistical Software 34(2): 1-24.
-
Vigo J, Carreras J, Ferré A (2006) Cartografia dels hàbitats a Catalunya: Manual d’interpretació. Generalitat de Catalunya. Barcelona.
-
GIS.org (2023) QGIS Geographic Information System. QGIS Association.
-
Palarea-Albaladejo J, Martin-Fernandez JA (2015) zCompositions -- R package for multivariate imputation of left-censored data under a compositional approach. Chemom Intell Lab Syst 143: 85-96.
-
Oksanen J, Simpson G, Blanchet F, Kindt R, Legendre P, et al. (2022) Vegan: Community Ecology Package. R package version 2.6-4.
-
R Core Team (2022) R: A language and environment for statistical computing. R Foundation for Statistical Computing, Vienna, Austria.
-
Virtanen R, Edwards GR, Crawley MJ (2002) Red deer management and vegetation on the Isle of Rum. Journal of Applied Ecology pp: 572-583.
-
Siuda A, Żurowski W, Siuda H (1969) The food of the roe deer. Acta theriologica 14(18): 247-262.
-
Villamuelas M, Fernández N, Albanell E, Gálvez-Cerón A, Bartolomé J, et al. (2016) The Enhanced Vegetation Index (EVI) as a proxy for diet quality and composition in a mountain ungulate. Ecological Indicators 61(2): 658-666.
-
Espunyes J, Bartolomé J, Garel M, Gálvez-Cerón A, Fernández-Aguilar X, et al. (2019) Seasonal diet composition of Pyrenean chamois is mainly shaped by primary production waves. PLoS One 14(1).
-
Gilbert SL, Hundertmark KJ, Person DK, Lindberg MS, Boyce MS (2017) Behavioral plasticity in a variable environment: snow depth and habitat interactions drive deer movement in winter. Journal of Mammalogy 98(1): 246-259.
-
Takahashi H, Kaji K (2001) Fallen leaves and unpalatable plants as alternative foods for sika deer under food limitation. Ecological Research 16(2): 257-262.
-
Miranda M, Cristóbal I, Díaz L, Sicilia M, Molina-Alcaide E, et al. (2015) Ecological effects of game management: does supplemental feeding affect herbivory pressure on native vegetation?. Wildlife research 42(4): 353-361.
-
Aldous CM (1945) A winter study of mule deer in Nevada. The Journal of Wildlife Management 9(2): 145-151.
-
Blair RM, Epps EA (1967) Distribution of protein and phosphorus in spring growth of rusty blackhaw. The Journal of Wildlife Management 188-190.
-
Short HL, Blair RM, Burkart l (1972) Factors affecting nutritive values. In: McKell CM, Blaisdell JP, et al. (Eds.), Wildland shrubs-their biology and utilization. U.S. Dep. Agric For Serv Gen Tech Rep INT-1, pp: 311-318.
-
Homolka M (1993) The food niches of three ungulate species in a woodland complex. Folia Zoologica (Brno) 42(3): 193-203.
-
Demment MW, Van Soest PJ (1985) A nutritional explanation for body size patterns of ruminant and non-ruminant herbivores. American Naturalist 125: 641e672.
-
Case TJ (1978) A general explanation for insular body size trends in terrestrial vertebrates. Ecology 59 (1): 1-18.
-
Matsubayashi H, Bosi E, Kohshima S (2003) Activity and habitat use of lesser mouse-deer (Tragulus javanicus). Journal of Mammalogy 84(1): 234-242.
-
Agelet A, Valles J (2003) Studies on pharmaceutical ethnobotany in the region of Pallars (Axial Pyrenees, Catalonia, Iberian Peninsula). Part II. New or very rare uses of previously known medicinal plants. Journal of Ethnopharmacology 84(2-3): 211-227.
-
Aymerich P, Cambra J, Carreras J, Carrillo E, Guardiola M, et al. (2006) Cartografia dels Hàbitats de Catalunya. Manual d’interpretació. Departament de Medi Ambient i Habitatge.
-
Kuhns LJ, Sydnor TD (1976) Copper toxicity in woody ornamentals. Journal of Arboriculture 90: 68-73.
-
Široká Z, Pána O, Svobodová Z (2016) The case of goat poisoning by boxwood. Veterinářství 66(1): 52-54.
- Mitochondrial Bio-Logistics: Steering Co-Enzyme Q10 and Lycopene Synergies within the Science 4.0 Bio-OS Framework
- Hymenoptera Specimens from the Caño Negro Wetland, of the National Museum Collection, Costa Rica
- Science 4.0: Comprehensive Architecture of the Biological Operating System (Bio-OS) A Framework for Systemic Resilience and Industrialized Bio-Governance
- Rabbit on, or Hare Back? Understanding Climate Change
- Clinical Validation of Science 4.0: Flow Steering and Epigenetic Drift Inversion on a 76-Year-Old Hybrid System
- Seeds Planted by another Mind