Characteristics of Presbycusis in A Super-Aged Society
Objectives: To estimate presbycusis' characteristics and investigate whether any changes have occurred in the pathophysiology of presbycusis over the decades. Methods: This was a retrospective cross-sectional observational study. A total of 186 patients aged ≥ 65 years were selected for the elderly group; they included patients with mild-to-moderate sensorineural hearing loss of unknown cause. For the middle age group, 56 patients aged 30–50 years who had positive results for the recruitment phenomenon were selected as controls. The participants’ age, sex, pure-tone hearing levels of air conduction (125–8000 Hz), maximum speech discrimination score (SDSmax), and the presence or absence of the recruitment phenomenon were investigated based on medical records. Results: Sixty-one patients in the elderly group were aged ≥ 80 years. Hearing levels were significantly better in male patients in the low-frequency range and significantly better in female patients in the high-frequency range (p < 0.01). In the elderly group, the proportion of patients with poor speech discrimination was 52.4–70.2%. The SDSmax was significantly higher in female patients than in male patients (p < 0.01). The proportion of patients with the recruitment phenomenon was 93.5%. The audiometric hearing pattern was dominated by a gradual-down slope, high-frequency-impaired, and flat patterns. There were significantly more female patients with a flat pattern and significantly more male patients with a gradual-downslope pattern and U-shaped pattern (p < 0.01). Age, sex, mean pure-tone hearing level, and audiometric hearing pattern significantly affected the SDSmax (all, p < 0.05), as evaluated with multiple regression analysis. Conclusion: More than half of the elderly patients with mild or moderate hearing loss were estimated to have retrocochlear damage. The age of hospital visitors for presbycusis was found to have increased over time. However, the distribution of pathophysiologies was not different from that in previous studies performed with relatively younger patients. This suggests a shift of patients presenting with presbycusis toward an older age range.
Introduction
Japan has been considered to have a super-aged society since 2007, and aging in Japan is progressing. The rise of a super-aged society is expected to increase hearing loss cases among older adults. For example, Uchida, et al. [1] reported that approximately 70% of people aged 75 or older were diagnosed with mild or more severe hearing loss based on results from pure-tone audiometry, and the Japan Trak Report 2018 [2] indicated that approximately 40% of individuals in this age group showed a form of hearing loss.
Presbycusis, caused by aging, is commonly characterized by bilateral high-frequency sensorineural hearing loss with hearing level deterioration at high frequencies followed by gradual deterioration at mid and low frequencies.
Presbycusis can manifest with different audiometric hearing patterns, flat or tent-shaped, and with different levels of speech discrimination from poor to good, even at the same hearing level [3]. Shimoda [4] described the pathophysiology of presbycusis as mild-to-moderate inner ear damage combined with retrocochlear damage that increases with age until the age of 70 years, manifesting as markedly reduced speech discrimination by the age of 80 years due to advanced inner ear damage and increasing retrocochlear damage. Presbycusis is classified by type according to temporal bone pathology (e.g., cochlear hair cells, stria vascularis, and spiral ganglion), and each type can occur independently or in combination [5]. Thus, presbycusis manifests in various pathophysiological forms.
Okamoto [6] reported that based on pure-tone audiometry results conducted during health screenings in Japan, hearing in elderly individuals of similar ages has improved over the decades. This may be attributable to improvements in the general health of the elderly population, which might change the pathophysiology of presbycusis. Furthermore, as the elderly population becomes increasingly healthier, the age composition of individuals visiting hospitals is also expected to diversify. However, no recent studies have examined the general characteristics of presbycusis; hence, an investigation that compares recent characteristics of presbycusis found in elderly patients with those in previous studies would be clinically relevant.
We conducted a retrospective cross-sectional observational study to examine the characteristics of presbycusis using recent hearing-test approaches and investigated whether, over the decades, any changes have occurred among elderly individuals examined for hearing loss and the pathophysiology of presbycusis.
Methods
Subjects
Study participants were patients aged ≥ 65 years (hereinafter, called the elderly group) examined at the Department of Otorhinolaryngology in Kitasato University Hospital for hearing loss between April 2009 and March 2019 who met the following inclusion criteria: 1) performance of pure-tone audiometry, speech discrimination testing, acoustic reflex testing, and short-increment sensitivity index (SISI) testing; 2) unknown cause of hearing loss and no history of diseases associated with acute hearing loss; and 3) sensorineural hearing loss with an average pure-tone hearing level (four-divided average calculated as (500 Hz +1000 Hz × 2+2000 Hz)/4) in the better ear of ≥ 25 dB and < 70 dB and a left-right difference in the average pure-tone hearing level (four-divided average) of < 10 dB. In addition, patients aged ≥ 30 and ≤ 50 years who visited our institution between February 2002 and March 2019 for hearing loss who satisfied the above criteria and whose test results indicated inner ear hearing loss (hereinafter, the middle age group) were enrolled as a comparator group. The middle age group was included in this study to comprehend the range of speech discrimination scores of the patients with inner ear hearing loss.
Only results from the ear with the better average pure- tone level (four-divided average) results were investigated in both groups. An ear was selected at random when there was no left-right difference in the average pure-tone hearing level.
Pure-tone audiometry
Pure-tone audiometry was performed in accordance with the methods described by the Japan Audiological Society [7]. Air conduction hearing thresholds were measured at 125, 250, 500, 1000, 2000, 4000, and 8000 Hz.
Speech Discrimination Test
Speech discrimination was examined using the 67-S list of Japanese monosyllables. Speech materials were first presented at the average pure-tone hearing level (three- frequency average) + 30–50 dB and then changed at 10 dB increments or decrements. Test levels were adjusted based on the type and severity of hearing loss; speech materials were presented to produce a peak in a speech discrimination curve. The maximum speech discrimination score (SDSmax) was calculated based on this peak. Speech noise was used for masking.
Acoustic Reflex Test
First, tympanometry was performed, and then, the ear canal pressure was matched to the peak on the tympanogram; the threshold of the stapedius reflex to an ipsilateral 1000 Hz pure-tone stimulus was measured.
SISI Test
Pure-tone thresholds were determined at 1000 Hz and 4000 Hz, and SISI testing was performed at 20 dB above the threshold. Band noise was used for masking in accordance with the method described by the Japan Audiological Society [7].
Pure-tone audiometry, speech recognition testing, and SISI testing were performed with an AA-78 or AAH1 audiometer (RION, Tokyo, Japan), and acoustic reflex testing was performed using an RS-22 impedance audiometer (RION).
Testing Outcomes and Statistical Analysis
The following were investigated via testing.
Pure-tone hearing levels
a) Pure-tone hearing levels in three frequency ranges: Pure-tone hearing levels were compared between the elderly and middle age groups In both the elderly and middle age groups, frequencies were grouped as shown below, and the average pure-tone hearing level was calculated in each frequency range for each group. a. (low-frequency range): average air conduction thresholds at 125, 250, and 500 Hz. b. (mid-frequency range): average air conduction thresholds at 500, 1000, and 2000 Hz. c. (high-frequency range): average air conduction thresholds at 4000 and 8000 Hz. The pure-tone hearing level in each frequency range was compared between the elderly and middle age groups using the t-test.
b) Sex-Related Differences in Pure-Tone Hearing Levels in the Elderly Group The pure-tone hearing level in each frequency range was compared between sexes in the elderly group using the t-test.
Speech Discrimination
a) Comparison of SDSmax between the elderly and middle age groups: SDSmax was compared between the elderly and middle age groups using t-tests. b) Frequency of ears with poor speech discrimination in the elderly group: Based on the average hearing level (four-divided average), patients were grouped into interval A (≥ 25 dB, < 40 dB), interval B (≥ 40 dB, < 55 dB), and interval C (≥ 55 dB, < 70 dB), and the lower confidence limit of the 95% confidence interval (CI) for speech discrimination was calculated among the middle age group in each of these hearing level intervals. Patients in the elderly group with a speech discrimination score below the lower confidence limit of scores in the middle age group were defined as having poor speech discrimination. The proportion of patients with poor speech discrimination was calculated. c) Sex-related differences in SDSmax in the elderly group: SDSmax was compared between sexes in the elderly group using the t-test.
Recruitment Phenomenon a) Frequency of the recruitment phenomenon in the elderly group: Patients with a difference of less than 55 dB between their reflex threshold on the acoustic reflex test and pure-tone hearing level (Metz test) or with an SISI score of ≥ 60% at 1000 Hz or 4000 Hz were considered positive for the recruitment phenomenon. The proportion of patients in the elderly group who showed the recruitment phenomenon was calculated. b) Effect of the recruitment phenomenon on speech discrimination: Speech discrimination was compared between patients positive and negative for the recruitment phenomenon in the elderly group using the t-test. c) Sex-related differences in the recruitment phenomenon in the elderly group: The proportion of male and female patients positive for the recruitment phenomenon in the elderly group was calculated, and the sexes were compared using the chi-square test. d) Comparison of the frequency of recruitment phenomenon with those in past studies: To compare the proportion of elderly patients with the recruitment phenomenon to those reported by past studies, we investigated the frequency of patients with an SISI score ≥ 60% at 1000 Hz, compared with the results of Shimoda [4] and Yagi, et al. [8].
Audiometric Hearing Patterns
a) Audiometric hearing pattern frequency in the elderly group: The following seven audiometric hearing patterns were defined based on pure-tone hearing levels in the frequency ranges a, b, and c mentioned in Section 1:
Gradual-downslope pattern: a is at least 10 dB higher than b; b is at least 10 dB better than c. High-frequency-impaired pattern: < 10 dB difference between a and b; b is at least 10 dB better than c. Low-frequency impaired pattern: < 10 dB difference between b and c; a is at least 10 dB worse than b. Tent-shaped pattern: both a and c are at least 10 dB worse than b. U-shaped pattern: both a and c are at least 10 dB better than b. Gradual-upslope pattern: b is at least 10 dB better than a; c is at least 10 dB better than b. Patients who did not show any of the above patterns were considered to have a flat hearing pattern, and the frequency of each hearing pattern was calculated. b) Comparison of speech discrimination according to hearing patterns: Speech discrimination was compared between hearing patterns in the elderly group. When one-way analysis of variance revealed a significant difference, multiple comparisons were performed using Tukey’s method. c) Sex-related differences in hearing patterns in the elderly group: The frequency of each hearing pattern was calculated among male and female patients in the elderly group, and the sexes were compared using the chi-square test.
Factors Affecting Speech Discrimination
Factors affecting SDSmax in the elderly group were investigated with multiple regression analysis using SDSmax as the dependent variable and age, sex, average pure-tone hearing level (four-divided average), recruitment phenomenon (y/n), and hearing pattern as independent variables.
Estimated Pathological Types of Presbycusis
Schuknecht described six types of presbycusis based on temporal bone pathology [5]: a) Cochlear sensory cell damage-type presbycusis (sensory presbycusis) b) Cochlear nerve damage-type presbycusis (neural presbycusis) c) Stria vascularis degeneration-type presbycusis (strial presbycusis) d) Cochlear conduction disturbance-type presbycusis (cochlear conductive presbycusis) e) Mixed presbycusis (a mixture of the abovementioned four types) f) Indeterminate presbycusis (none of the above five types) We considered types a), b), and c) to be important because they had been confirmed pathologically, and their characteristics with respect to auditory functions had been explained by Merchant SN [5]. Table 1 shows how the auditory function test data obtained in this study were correlated with these three types of presbycusis. Assuming that patients with the recruitment phenomenon had sensory presbycusis, patients with poor speech discrimination had neural presbycusis. Patients with a flat hearing pattern had strial presbycusis. The frequencies of the three types of presbycusis were calculated.
| Speech discrimination | Recruitment phenomenon | Audiometric hearing pattern | |
|---|---|---|---|
| Sensory presbycusis | Good | Positive | High-frequency impaired |
| Neural presbycusis | Poor | Negative | Various |
| Strial presbycusis | Good | Positive or negative | Flat |
Table 1: Typical findings in types of presbycusis.
Statistical analyses were performed using IBM SPSS Statistics v. 24 (IBM Corp., Armonk, NY) with a significance level of < 5%.
This study was approved by the Epidemiology Research Review Board of Kitasato University School of Medicine and Hospital (approval number: B19-160). The board granted a formal exemption regarding the requirement for participant informed consent.
Results
Patient Characteristics
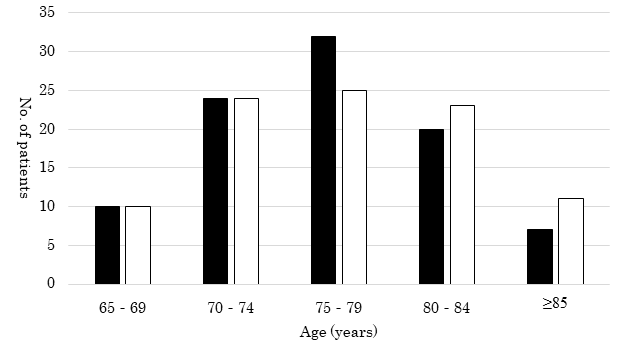
The elderly group consisted of 186 patients (93 male and 93 female) with a mean age of 77.0 ± 5.9 years (range, 65–90 years) and an average pure-tone hearing level (four-divided average) of 43.6 ± 9.0 dB (range, 25.0–67.5 dB). There were 61 patients aged 80 years or older (32.8%). The sex and age distributions of the elderly group are shown in Figure 1.
The middle age group consisted of 56 patients (29 male and 27 female) with a mean age of 42.0 ± 5.2 years (range, 30–50 years) and an average pure-tone hearing level (four- divided average) of 38.2 ± 9.9 (range, 26.3–61.3 dB).
Pure-Tone Hearing Levels
a) Comparison of pure-tone hearing levels between the elderly group and middle age group: In the elderly group, the mean (± standard deviation) hearing level in the low-frequency range (a) was 33.3 ± 12.6 dB, in the mid-frequency range (b) was 43.6 ± 9.0 dB, and in the high-frequency range (c) was 64.3 ± 13.3 dB. In the middle age group, the mean (± standard deviation) pure-tone hearing level in range a was 26.2 ± 13.8 dB, in range b was 38.1 ± 9.7 dB, and in range, c was 50.7 ± 19.0 dB. Thus, hearing levels were significantly better in the middle age group at all frequency ranges (all p < 0.01).
b) Sex-related differences in pure-tone hearing level in the elderly group: Among the male patients in the elderly group, the mean hearing level in range a was 30.2 ± 12.0 dB, in range b was 43.3 ± 9.6 dB, and in range, c was 68.5 ± 12.8 dB. Among the female patients in the elderly group, the mean hearing level in range a was 36.4 ± 12.4 dB, in range b was 43.7 ± 8.5 dB, and in range, c was 60.2 ± 12.5 dB. Hearing levels were significantly better in male patients in the low-frequency range (p < 0.01) and significantly better in female patients in the high-frequency range (p < 0.01), and there was no significant difference in the mid-frequency range.
Speech Discrimination
a) Comparison of speech discrimination between the elderly group and middle age group: The mean SDSmax in the elderly group was 73.1 ± 19.0% (range, 15–100%) and in the middle age group was 88.8 ± 11.5% (range, 55–100%). Thus, SDSmax was significantly lower in the elderly group than in the middle age group (p < 0.01).
b) Frequency of ears with poor speech discrimination in the elderly group (Figures 2-4): In the elderly group, the number of ears in each pure-tone hearing interval was 61 in interval A (≥ 25 dB, < 40 dB), 104 in interval B (≥ 40 dB, < 55 dB), and 21 in interval C (≥ 55 dB, < 70 dB). In the middle age group, there were 35 ears in interval A, 14 in interval B, and 7 in interval C. In the middle age group, the lower confidence limit of the 95% CI for the SDSmax was 88.3% among patients in interval A, 84.0% in interval B, and 59.8% in interval C. In the elderly group, the proportion of patients with poor speech discrimination was 54.1% (33 ears) in interval A, 70.2% (73 ears) in interval B, and 52.4% (11 ears) in interval C.
c) Sex-related differences in speech discrimination in the elderly group: Among elderly male patients, the mean SDSmax was 69.1 ± 19.7%, and among female patients, the mean score was 77.0 ± 17.5%. SDSmax was significantly better in female than in male patients (p < 0.01).
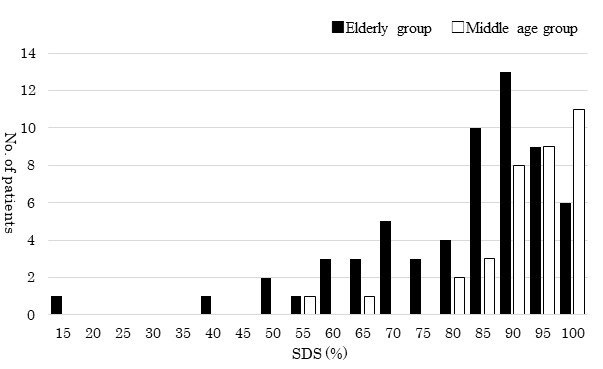
SDS = maximum speech discrimination score. Figure 2: Distribution of the speech discrimination score (SDSmax) by hearing level interval A (≥ 25 dB, < 40 dB).
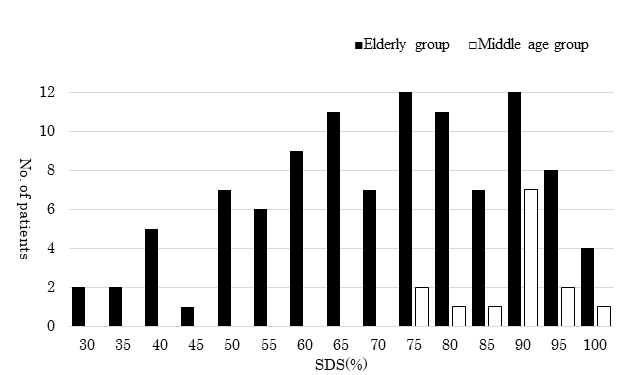
SDS = maximum speech discrimination score. Figure 3: Distribution of the speech discrimination score (SDSmax) by hearing level interval B (≥ 40 dB, < 55 dB).
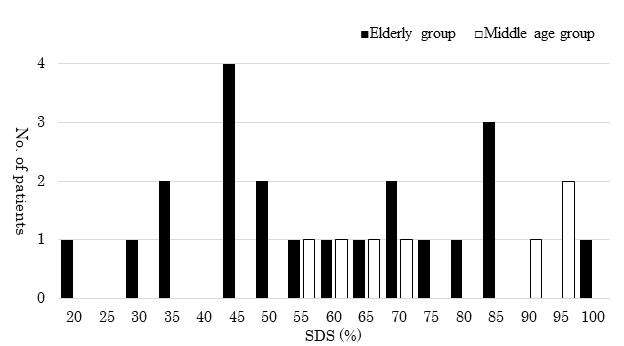
SDS= maximum speech discrimination score. Figure 4: Distribution of the speech discrimination score (SDSmax) by hearing level interval C (≥ 55 dB, < 70 dB).
Recruitment Phenomenon
a) Frequency of the recruitment phenomenon in the elderly group: In the elderly group, the proportion of patients with the recruitment phenomenon, as per a SISI score of ≥ 60% at 1000 Hz or 4000 Hz and Metz test results, is shown in Table 2. We defined patients with positive results in at least one of the three tests to have a recruitment phenomenon. The overall proportion of patients with recruitment phenomenon was 93.5% (174 ears). b) Comparison of speech discrimination by the recruitment phenomenon in the elderly group: The mean SDSmax among patients with recruitment was 72.6 ± 18.7%, and that among recruitment-negative patients was 80.8 ± 19.0%. There was no significant difference in speech discrimination between the groups (p = 0.147). c) Sex-related differences in the recruitment phenomenon in the elderly group: The proportion of elderly male patients with recruitment was 94.6% (88/93 ears), and the proportion of elderly female patients with recruitment was 92.5% (86/93 ears). There was no significant difference in the proportions of male and female patients (p = 0.551).
d) Comparison of proportion of recruitment phenomenon with that in past studies: The comparison of past studies and the present study is shown alongside the mean pure-tone hearing level data in Table 3. Table 3 shows the number (%) of patients with an SISI score ≥ 60 % at 1000 Hz in the present study. Shimoda [4] and Yagi, et al. [8] defined patients with an SISI score ≥ 70% at 2000 Hz as positive for the recruitment phenomenon. Although the test frequency and criterion for positive judgment were different between this study and the past studies, in patients aged 65–74 years, the positive rate for the recruitment phenomenon was higher in this study than in the past two studies.
| Overall | SISI | Metz test | ||
|---|---|---|---|---|
| 1 kHz | 4 kHz | |||
| No. of patients | 174 | 91 | 163 | 114 |
| Percentage (%) | 93.5 | 48.9 | 87.6 | 61.3 |
Table 2: Mean pure-tone hearing level and recruitment phenomenon by age group.
Overall: recruitment positive in at least one of three results. Abbreviations: SISI, short increment sensitivity index. Table 2: Recruitment phenomenon frequency in each test.
| Mean pure-tone hearing level (dB) | Patients with recruitment (%) | |||||
|---|---|---|---|---|---|---|
| Age group (years) | Present study | Shimoda | Yagi, et al. | Present study | Shimoda | Yagi, et al. |
| 65–69 | 42.8 | 28 | 30 | 65 | 35 | 45.2 |
| 70–74 | 42.5 | 33.4 | 36.7 | 58.3 | 35 | 49.3 |
| 75–79 | 42.3 | 36.4 | 40.9 | 45.6 | 41 | 47.9 |
| 80–84 | 44.7 | 44.2 | 46.8 | 37.2 | 65 | 51.6 |
| ≥85 | 49 | 48.7 | 44.4 | 59.7 |
Table 3: Mean pure-tone hearing level and recruitment phenomenon by age group.
Audiometric Hearing Pattern
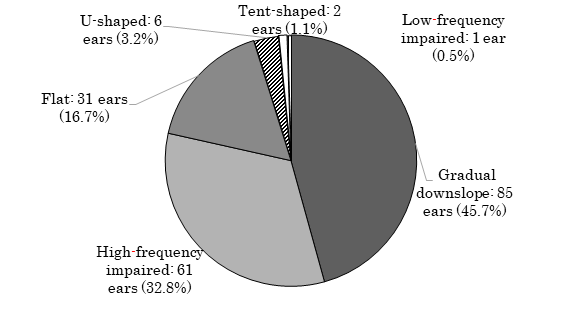
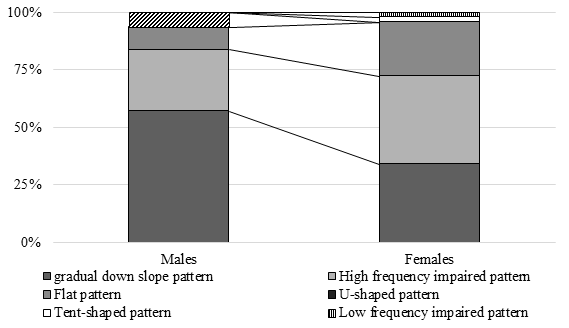
a) Audiometric hearing pattern frequency in the elderly group (Figure 5): The gradual-down slope, high-frequency-impaired, and flat patterns accounted for most patients in the elderly group. No patients exhibited a gradual upslope pattern; hence, this pattern was excluded from the analysis below. b) Comparison of speech discrimination by audiometric hearing pattern: In the elderly group, the SDSmax was compared between patients with a flat, gradual- down slope and high-frequency-impaired pattern. Other hearing patterns were excluded from the analysis because of the small number of applicable patients. In the elderly group, the mean speech discrimination score among patients with the flat pattern was 82.3 ± 15.9%, among patients with the gradual down-slope pattern was 72.5 ± 18.2%, and among patients with the high- frequency-impaired pattern was 70.7 ± 20.2%. When the SDSmax was compared between these three hearing patterns with a one-way analysis of variance, there was a significant difference between the hearing patterns (p < 0.05). A multiple comparison method revealed that speech discrimination was significantly better among patients with the flat pattern than patients with the gradual-downslope pattern and high-frequency- impaired pattern (p < 0.05, in both cases). There was no significant difference in speech discrimination between the gradual-downslope and high-frequency-impaired patterns (p = 0.843). c) Sex-related differences in audiometric hearing patterns in the elderly group (Figure 6): The proportions of elderly male patients with different patterns were as follows: gradual-downslope pattern, 57.0% (53 ears); high-frequency-impaired pattern, 26.9% (25 ears); flat pattern, 9.7% (9 ears); U-shaped pattern, 6.5% (6 ears); and tent-shaped pattern or low-frequency gently sloping pattern, 0% (0 ears). The proportions of elderly female patients with different patterns were as follows: gradual-downslope pattern, 34.4% (32 ears); high-frequency-impaired pattern, 38.7% (36 ears); flat pattern, 23.7% (22 ears); U-shaped pattern, 0% (0 ears); tent-shaped pattern, 2.2% (2 ears); and low-frequency impaired pattern, 1.1% (1 ear). The chi-square test revealed a significant difference (p < 0.01) in the frequency of each hearing pattern between male and female patients. When the adjusted residual was calculated and residual analysis was performed, there were significantly more female patients with a flat pattern and significantly more male patients with a gradual downward-slope pattern and U-shaped pattern.
Factors Affecting Speech Discrimination
In the elderly group, multiple regression analysis was performed with the data of 177 patients with a gradual- downslope pattern, high-frequency-impaired pattern, and flat pattern after excluding patients with a low-frequency- impaired pattern tent-shaped pattern, and a U-shaped pattern because of the small number of applicable patients.
Among the elderly patients analyzed, the mean SDSmax was 70.3 ± 19.6% among the 87 male patients and 76.8% ± 17.8% among the 90 female patients. The results of the multiple regression analysis are presented in Table 4. Age, sex, mean pure-tone hearing level, and audiometric hearing pattern significantly affected SDSmax. The recruitment phenomenon did not have a significant effect on SDSmax.
| Standard regression coefficient | P-value | |
|---|---|---|
| Age | -0.14 | 0.044 |
| Sex | 0.195 | 0.004 |
| Mean pure-tone hearing level (dB) | -0.36 | 0.0001 |
| Recruitment phenomenon | -0.077 | 0.253 |
| Audiometric hearing pattern (flat, gradual downslope, and high-frequency impaired) | -0.172 | 0.012 |
Table 4: Standard regression coefficient for each variable.
Estimated Pathological Types of Presbycusis
Table 5 shows the number and proportion of patients grouped by estimated presbycusis type. Sensory presbycusis was the most common presbycusis type (89.8%) because of the high proportion of patients with the recruitment phenomenon (93.5%). Neural presbycusis was also common (59.7%); mixed sensory and neural presbycusis was seen in over half of the patients (51.1%), and sensory presbycusis alone was the next most common type (24.7%).
| Speech discrimination | Recruitment phenomenon | Audiometric hearing pattern | No. of patients (%) | Estimated type | ||
|---|---|---|---|---|---|---|
| Overall | Males | Females | ||||
| Good | Positive | Gradual downslope or High-frequency impaired | 46 (24.7) | 21 (22.6) | 25 (26.9) | Sensory presbycusis only |
| Flat | 15(8.1) | 5(5.4) | 10(10.8) | Sensory presbycusis + strial presbycusis | ||
| Negative | Flat | 3 (1.6) | 1 (1.1) | 2 (2.2) | Strial presbycusis | |
| Poor | Positive | Gradual downslope or High-frequency impaired | 95 (51.1) | 54 (58.1) | 41 (44.1) | Sensory presbycusis + neural presbycusis |
| Flat | 11 (5.9) | 3 (3.2) | 8 (8.6) | Mixture of 3 types | ||
| Negative | Flat | 2 (1.1) | 0 (0) | 2 (2.2) | Neural presbycusis + strial presbycusis | |
| Pattern other than flat | 3 (1.6) | 2 (2.2) | 1 (1.1) | Neural presbycusis only | ||
| Other | 11 (5.9) | 7 (7.5) | 4 (4.3) | Indeterminate presbycusis | ||
| Total | 186 (100) | 93 (100) | 93 (100) |
Table 5: Estimated presbycusis type and frequency.
Discussion
Patients aged 80 years or older accounted for 32.8% of the elderly participants in this study. On the other hand, the proportion of participants aged 80 years and older in the 1995 study by Shimoda [4] was 12.2% and that in the 1996 study by Yagi, et al. [8] was 14.7%; hence, patients aged 80 years and older in the present study accounted for at least twice as many elderly participants compared to that in the two previous studies. In contrast, the proportion of participants aged 65-69 years was 22% in the present study, 44% in Shimoda’s study and 32% in the study by Yagi, et al. This confirmed that the overall age of elderly hospital visitors with hearing loss has increased with the development of a super-aged society.
In this study, elderly male patients with hearing loss had a poorer hearing at high frequencies than the corresponding female ones. This result is in line with the findings of previous studies [8, 9, 10, 11, 12, 13]. In addition, elderly female patients with hearing loss had a poorer hearing at low frequencies than male patients. Studies outside Japan have shown poorer hearing at low frequencies in female individuals [14] but have also shown no significant sex-based differences in hearing at low frequencies [15, 16, 17, 18, 19]. Japanese studies have noted worse hearing at low frequencies [8, 9, 10] and have shown a tendency for a higher hearing threshold at low frequencies [11, 12, 13] in female individuals, which was not noted in their description. Our findings showed that the hearing level was significantly worse at low frequencies in elderly female patients. Although poorer hearing at low frequencies in elderly female patients with hearing loss could be due to earlier degeneration of the stria vascularis in this population [20], various factors may contribute to this difference.
In 1995, Shimoda [4] divided middle-aged patients with inner ear hearing loss into four average hearing level intervals (≤ 20, 21–30, 31–50, and 51–70 dB) and calculated a critical score for speech discrimination among patients in each interval. Elderly patients were then divided according to the same four hearing level intervals. A speech discrimination score outside the critical score was considered a poor result, and thus, the percentage of elderly patients with poor results in each hearing level interval was calculated. The percentage of patients with poor results was 28% at 20 dB and 23% at 21–30, 54% at 31–50, and 65% at 51–70 dB. The present study defined three average pure-tone hearing level intervals: interval A, 25-39 dB; interval B, 40–54 dB; and interval C, 55- 69 dB. The results of this study and those of Shimoda’s study cannot be compared directly because different hearing level intervals were used. However, the results of this study do not appear to be particularly different from those of Shimoda’s study. In other words, although this study included a higher proportion of elderly patients aged 80 years or older, our findings did not differ substantially from those of Shimoda’s study.
Although published more than 40 years ago, the study by Shitara, et al. [13] also used the 67-S lists of Japanese monosyllables to study speech discrimination in individuals subjected to health screening. When the mean speech discrimination score by age group was evaluated according to the groups defined by Shitara, et al. the speech discrimination scores among health screening recipients aged 65–69 and 70–74 years were 95% or higher on average among both men and women. Furthermore, because the average pure- tone hearing level (four-divided average) of participants in Shitara, et al. was approximately 7–15 dB, these results were representative of the general population. Therefore, they indicated better hearing results than those investigated in the present study.
To compare the proportion of elderly patients with recruitment by age group to those reported by past studies, we investigated patients with an SISI score ≥ 60% at 1000 Hz. Shimoda [4] and Yagi, et al. [8] defined patients with an SISI score ≥ 70% based on SISI testing at 2000 Hz as positive for the recruitment phenomenon and reported the proportion of patients with recruitment. The percentage of patients with the recruitment phenomenon based on SISI testing has increased at higher test frequencies [21]. Nevertheless, the proportion of patients with recruitment aged 65-69 and 70- 74 years when tested at 1000 Hz in this study was higher than that reported by Shimoda and Yagi, et al. who tested at 2000 Hz. In terms of mean pure-tone hearing levels, a high proportion of patients aged 65-69 years in the studies by Shimoda and Yagi et al. had mild hearing loss compared to that in this study. Accordingly, the smaller proportion of patients with recruitment in Shimoda and Yagi, et al. was probably attributable to mild hearing loss among patients aged 65-69. Although hearing has been reported to improve over the years for similar age groups [6], the fact that hearing was worse among patients aged 65–69 years in this study than that more than 20 years ago suggests that elderly people’s tendency to visit hospitals for hearing loss has probably undergone some form of change in the intervening years.
In 1996, Yagi, et al. [8] classified elderly patients with hearing loss into seven audiometric hearing patterns (flat, low-frequency, gradual-downslope, high frequency steeply sloping, dip-shaped, U-shaped, and tent-shaped) and calculated the proportion of patients with each pattern by age group. Yagi, et al. observed almost no differences in hearing pattern distribution between the age groups with a gradual-downslope pattern, accounting for most patients (55–70%). Most patients had one of these three patterns: gradual-downslope, flat (10–20%), or high frequency steeply sloping (5–12%). In the present study, 45.7% of patients in the elderly group had a gradual-downslope, 16.7% flat, and 32.8% high-frequency-impaired pattern, showing a greater proportion of patients in this study had a high-frequency- impaired pattern than the high frequency steeply sloping pattern observed by Yagi, et al. Although Yagi, et al. did not describe how hearing patterns were ascribed to patients, some patients with a high-frequency-impaired pattern in this study would probably belong to the gradual-downslope group according to Yagi, et al. [8]. Hence, although a greater proportion of patients with presbycusis in this study were aged 80 years and older, the proportions of each audiometric hearing pattern remained largely the same.
Schuknecht, et al. [22] examined 160 ears with presbycusis and, based on temporal bone pathology and clinical findings, reported sensory presbycusis in 13.1% (21 ears), neural presbycusis in 31.8% (51 ears), and strial presbycusis in 32.5% (52 ears) of patients. Schuknecht et al. reported that pathological findings probably have the greatest effect on hearing loss in different types of presbycusis. However, they did not mention mixed manifestations of each type, making a direct comparison with the present study difficult. Assuming that the sensory presbycusis type described by Schuknecht et al. is identical to the isolated sensory presbycusis described in this study, there is an approximately 10% difference in frequency between the results of the study by Schuknecht, et al. and the present study, indicating a potential relative increase in the proportion of patients with sensory presbycusis over time. In addition, the proportion of patients with neural presbycusis may be higher in this study because all patients with poor speech discrimination were assumed to have neural presbycusis; in contrast, the proportion of patients with strial presbycusis may be lower in this study because only patients with a flat audiometric hearing pattern were assumed to have strial presbycusis.
This study had some limitations. The participants of this study were patients who visited the hospital for hearing loss; hence, this study can be compared with the studies by Shimoda [4] and Yagi, et al. [8], which also investigated patients who complained of hearing loss similarly; however, the present study cannot be compared with the studies by Okamoto [6] and Shitara [13], which studied health screening recipients from the general population. The selection bias in this study favored individuals with hearing loss that was sufficiently severe to cause inconvenience.
Regarding the presbycusis types described by Schuknecht [22], patients with the recruitment phenomenon were classified as having sensory presbycusis, and patients with poor speech discrimination were classified as having neural presbycusis. Although the association between temporal bone pathology and auditory function test results may be theoretically consistent to a certain degree, it remains speculative, as no pathological examinations were performed. Furthermore, regarding strial presbycusis, because this study had no test data that directly assessed the stria vascularis, an audiogram with a flat hearing pattern was assumed to indicate stria vascularis degeneration. Although a large proportion of female patients with a flat hearing pattern and good speech discrimination were observed in this study, this indirectly supports the validity of this assumption, despite the weak theoretical connection.
Conclusion
This study suggests that, among elderly individuals with mild or moderate hearing loss, more than half exhibited retrocochlear damage. The recruitment phenomenon was also common, and most audiometric hearing patterns were flat, gradual-downslope, or high-frequency-impaired patterns. Sex differences were characterized by a higher hearing threshold in the high-frequency range among male patients, a higher hearing threshold in the low- frequency range among female patients, and better speech discrimination among female patients. The proportion of female patients with flat audiometric hearing patterns was relatively high. Regarding presbycusis type based on temporal bone pathology, approximately half of the patients were estimated to have coexisting sensory and neural presbycusis.
The age of hospital visitors for presbycusis was found to have increased over time. However, the distribution of pathophysiologies was not obviously different from that in previous studies performed with relatively younger participants. This suggests that there is a shift of patients presenting with presbycusis toward an older age range.
Acknowledgement
We would like to express our sincere gratitude to Junko Suzuki of Kitasato University Hospital for providing information on the tests and Professor Katsutoshi Tanaka of Kitasato University Graduate School for teaching us some of the tests used in statistical analysis. In addition, we would like to thank Editage (www.editage.com) for English language editing.
References
-
Uchida Y, Sugiura S, Nakashima T, Ando F, Shimokata H (2012) Estimates of the size of the hearing-impaired elderly population in Japan and 10-year incidence of hearing loss by age, based on data from the National Institute for Longevity Sciences-Longitudinal Study of Aging (NILS-LSA). Nihon Ronen Igakkai Zasshi 49(2): 222-227.
-
(2018) Japan Hearing Instruments Manufacturers Association: Japan Trak 2018 Report.
-
Sano H, Watanabe H (2017) [Effective Approaches to Presbycusis] Diagnosis of presbycusis. ENTONI 211: 7-11.
-
Shimoda K (1995) A study of audiologic findings in the elderly. Nippon Jibiinkoka Gakkai Kaiho 98(9): 1426- 1439.
-
Merchant SN, Nadol JB, Schuknecht HF (2010) Schuknecht’s Pathology of the Ear. pp: 432-464.
-
Okamoto M (2013) Auditory compensation in the super- aging society. Audiol Jpn 56: 50-58.
-
(2017) Japan Audiological Society: Practical Auditory Testing Revised Fourth Edition, Nanzando, Tokyo, pp: 48-76.
-
Yagi M, Kawabata I, Sato T, Toriyama M, Yamashita K, et al. (1996) Hearing acuity in the elderly in Japan. Nippon Jibiinkoka Gakkai Kaiho 99(6): 869-874.
-
Yokouchi K (1964) Studies on the physiological hearing loss by age. Nippon Jibiinkoka Gakkai Kaiho 67: 1307- 1319.
-
Kiritani N, Inoue H, Asano Y, Seki H, Honda Y, et al. (1992) Evaluation of the differences of adult hearing level between right and left ears, male and female measured by new JIS standard audiometer. Oto-Rhino-Laryngology, Tokyo 35: 281-287.
-
Okamoto M, Shitara T, Momiyama Y, Hirayama M, Ishii T (1989) Pure-tone hearing levels according to age. Audiol Jpn 32: 81-86.
-
Tsuiki T, Sasamori S, Minami Y, Ichinohe T, Murai K, et al. (2002) Age effect on hearing: a study on Japanese. Audiol Jpn 45(3): 241-250.
-
Shitara T (1980) Age changes in otorhinolaryngology, Seikisha Shuppan, Tokyo, pp: 65-93.
-
von Gablenz P, Holube I (2016) Hearing threshold distribution and effect of screening in a population- based German sample. Int J Audiol 55(2): 110-125.
-
Kim S, Lim EJ, Kim HS, Park JH, Jarng SS, et al. (2010) Sex differences in a cross-sectional study of age-related hearing loss in Korean. Clin Exp Otorhinolaryngol 3(1): 27-31.
-
Hoff M, Tengstrand T, Sadeghi A, Skoog I, Rosenhall U (2018) Improved hearing in Swedish 70-year olds-a cohort comparison over more than four decades (1971- 2014). Age Ageing 47(3): 437-444.
-
Valiente AR, Fidalgo AR, Berrocal JRG, Camacho RR (2015) Hearing threshold levels for an ontologically screened population in Spain. Int J Audiol 54(8): 499- 506.
-
Cruickshanks KJ, Wiley TL, Tweed TS, Klein BE, Klein R, et al. (1998) Prevalence of hearing loss in older adults in Beaver Dam, Wisconsin. The Epidemiology of Hearing Loss Study. Am J Epidemiol 148(9): 879-886.
-
Hannula S, Torkko ME, Majamaa K, Sorri M (2010) Hearing in a 54- to 66-year-old population in northern Finland. Int J Audiol 49(12): 920-927.
-
Pearson JD, Morrell CH, Gordon Salant S, Brant LJ, Metter EJ, et al. (1995) Gender differences in a longitudinal study of age-associated hearing loss. J Acoust Soc Am 97(2): 1196-1205.
-
Ishigami H (2007) Psychoacoustical Test I, Loudness Recruitment II Short Tone Threshold. Audiol Jpn 50: 83- 100.
-
Schuknecht HF, Watanuki K, Takahashi T, Belal A Jr, Kimura RS, et al. (1974) Atrophy of the stria vascularis, A common cause for hearing loss. Laryngoscope 84(10): 1777-1821.
- 4th Branchial Cleft Sinus Anomaly Presenting as Recurrent Thyroid Abscess in A Child: A Case Report
- Parotid Duct Injury Repaired Using an Angiocatheter Stent: A Case Report
- Organization and Functionality of the Referral and Counter-Referral System for ENT Disorders in District Hospitals of N’Djamena, Chad: A Cross-Sectional Analytical Study
- Facial Metastases from a Gastrointestinal Stromal Tumor: A Case Report
- Panorama of Ent Cancers and Literature Review: Epidemiological Profile and Therapeutic Management
- Could Antimicrobial Resistance Prove to Be Both a Threat and an Opportunity for us?