Universal “Plug and Play” Real-Time Entire Automotive Exhaust Effluents, Industry Vents and Flue Gas Emissions Liquefiers: The Game Changer Approach-Phase Two Category
The first in the series of Azuberths Game Changer publications “Synergy of the Conventional Crude Oil and the FT-GTL Processes for Sustainable Synfuels Production: The Game Changer Approach-Phase One Category” a.k.a. (DOI: 10.23880/ppej- 16000330) is targeted at reducing 80 per cent CO2 emissions from the internal combustion engines by upgrading from the conventional crude oil refinery products to the synthetic fuels products (ultra-low-carbon fuels). This paper will focus on the complete elimination of the remaining 20 per cent CO2 emissions (i.e. to achieve zero- CO2 emissions) in transportation and power generating internal combustion engines as well as in the other centralized emissions/emitters such as petroleum industry flare lines, industrial process and big technology industries scrubber flue gas, et cetera. This invention stems from similar biblical quote {Isaiah 6:8-New International Version (NIV)} which states, and then I heard the voice of the Lord saying, “Whom shall I send? And who will go for us?” And I (Isaiah) said, “Here am I. Send me!” Laterally, in this case I (Azunna) said, “Here am I. Please use me”. Hence the aftermath, IJN-Universal Emissions Liquefiers is a plug and play units for all categories of pollutants discharge into the atmosphere. The work is motivated by the scientific facts that (i) The release of CO2 from automotive exhaust effluents, industry vents and flue gas emissions into the atmosphere contributes to greenhouse gas (GHG) accumulation causing global warming hence climate changes issues such as flooding of coastlines/sea-rising, melting of the glaciers, disrupted weather patterns, bushburning/ wildfire, depletion of Ozone layer, smog and air pollution, acidification of water bodies, runaway greenhouse effect, etc. (ii) Every gas stream (e.g., flue gas) can be made liquid by e.g. a series of compression, cooling and expansion steps and once in liquid form, the components of the gas can be separated in a distillation column. (iii) Captured liquefied gases can be put to various uses, especially carbon dioxide (CO2), which can be used for the production of renewable energy via Synfuels such as the e-fuel/solar fuel. The natural atmosphere is composed of 78% nitrogen, 21% oxygen, 0.9% argon, and only about 0.1% natural greenhouse gases, which include carbon dioxide, organic chemicals called chlorofluorocarbons (CFCs), methane, nitrous oxide, ozone, and many others. Although a small amount, these greenhouse gases make a big difference - they are the gases that allow the greenhouse effect to exist by trapping in some heat that would otherwise escape to space. Carbon dioxide, although not the most potent of the greenhouse gases, is the most important because of the huge volumes emitted into the air by combustion of fossil fuels (e.g., gasoline, diesel, fuel oil, coal, natural gas). In general, the major contributors to the greenhouse effect are: Burning of fossil fuels in automobiles, deforestation, farming, processing and manufacturing factories, industrial waste and landfills, increasing animal and human respiration, etc. The increased number of factories, automobiles, and population increases the amount of these gases in the atmosphere. The greenhouse gases never let the radiations to escape from the earth atmosphere and increase the surface temperature of the earth. This then leads to global warming. The petroleum industry well sites vent/flare gases (methane, ethane, propane, butanes, H2O (g), O2, N2, etc.). Internal combustion engines (automobiles-cars, vehicles, ships, trains, planes, etc.) release exhaust effluents (containing H2O (g), CO2 , O2, and N2); steam generators in large power plants and the process furnaces in large refineries, petrochemical and chemical plants, and incinerators burn considerable amounts of fossil fuels and therefore emit large amounts of flue gas to the ambient atmosphere. In general, Flue gas is the gas exiting to the atmosphere via a “flue”, which is a pipe or channel for conveying exhaust gases from a fireplace, oven, furnace, boiler or steam generator. The emitted flue gas contains carbon dioxide CO2 , carbon monoxide CO, sulphur oxide SO2, nitrous oxide NO and particulates. Furthermore, GTL plants produce CO2, H2O and waste heat, while both pyrolysis and gasification plant generate gaseous products consisting of (a mixture of non-condensable gases such as H2, CO2, and CO and light hydrocarbons “e.g. CH4” at room temperature, as well as H2O (g), O2 and complex hydrocarbons e.g. C2H2, C2H4, etc.). In general, all combustion is as a result of air-fuel mixture burning (i.e. air or oxygen mixing directly with biomass/ coal or with liquid/gaseous hydrocarbon inside internal combustion engines), releases carbon dioxide and steam (H2O) back into the atmosphere as well as producing energy for work. Specifically, during combustion, carbon combines with oxygen to produce carbon dioxide (CO2). The principal emission from transportation and power generating internal combustion engines is carbon dioxide (CO2). The level of CO2 emission is linked to the amount of fuel consumed and the type of fuel used as well as the individual engine’s operating characteristics. For instance, diesel-powered engines have higher emission than petrol/gasoline-powered engines. Although emphasis is places more on CO2, this investigation is ultimately concerned with the real-time liquefaction of all the components of gaseous release/emissions -related to air pollution/health problem. It is believed that the mortality rate from air pollution is eight times larger than the mortality caused by car accidents each year. Pollutants with the strongest evidence for public health concern include particulate matter (PM), ozone (O3), nitrogen dioxide (NO2) and sulphur dioxide (SO2). All the exhaust effluents gases/flue gas and vent/flare gases are captured by liquefying them and then put to various uses, to achieve “Net zero” emissions. Fundamentally, the objective of the present invention is to develop a compact device (Universal Emissions Liquefiers) that can be retro-fitted onto the exhaust tailpipe-end of the internal combustion engines (diesel-powered, gasoline-powered, and hybrid automobiles-cars, vehicles, SUV’s, trucks, motor cycles, tri-cycles, portable electric generators, sea and cargo ships/ boats, trains, planes, rockets, etc.) and outlet of industrial machines that release flue gases through exhaust/scrubber channels, as well as crude oil, refined products storage tanks that vent greenhouse gases into the atmosphere, coal processing units/ plants and turn them into liquid { CO2 (l), N2 (l), O2 (l), etc.} or powdered components or chemically transform them in realtime with selective catalysts to any other specific compound, e.g. treating CO2 with hydrogen gas (H2) can produce methanol (CH3OH), methane (CH4), or formic acid (HCOOH), while reaction of CO2 with alkali (e.g. NaOH) can give carbonates (NaHCO3) and bicarbonates (Na2CO3). Nitrogen (N2) to ammonia (NH3) or Hydrazine (N2H4), and molecular oxygen (O2) to hydrogen peroxide (H2O2), et cetera. Alternatively, in new automobiles designs, the universal emissions liquefiers’ device can be directly net-worked on the floor alongside the catalytic converters and may eliminate the need for muffler/silencer/resonator. This is achieved by the application of any of the five main gas capture/separation technologies: Liquid absorption, Solid adsorption, Membrane separation (with and without solvent- organic or inorganic), Cryogenic refrigeration/distillation, and Electrochemical pH-swing separation or their combination to selectively trap and liquefy the individual pollutants. According to the fact from CarBuster, almost 0.009 metric tons of carbon dioxide is produced from every gallon of gasoline burned, which means that the average car user makes about 11.7 tons of carbon dioxide each year from their cars alone.
Introduction
It all started in 1988 when I enrolled for Master’s degree in Petroleum/Gas Engineering at the University of Port Harcourt, with the proposal topic “Economic Viability of producing liquefied petroleum gas “LPG” and liquefied natural gas “LNG” from the Nigerian Flare Gas Stream” [1]. Sequel to my series of publications on flared/stranded gas monetization, in 2018, I published an article that detailed the various process techniques for the complete conversion of natural gas flare stream, to its separate hydrocarbon and non- hydrocarbon pure liquid components (through successive cooling and fractionation steps), (Figure 1) [2].
![Figure 1: Process Layout for Petroleum Industry Flare Stream Liquid Components Production [2].](/fulltextimages/10352/fig_1.png)
Around the mid-1960’s the terrifying news was “global cooling” and just after 30 years (i.e. mid-1990’s), the prevailing view went from global cooling to global warming.
Studies by experts reveal that, since the mid-1800’s (starting from 1859 drake’s modern petroleum fuels), the concentrations of greenhouse gases in the atmosphere have increased, measured in parts per million (ppm). For instance, according to National Aeronautics and Space Administration (NASA), CO2 level has steadily increased (i.e. in 1960 aprox. 320 ppm, 1970 aprox. 328 ppm, 1980 aprox.
341 ppm, 1990 aprox. 356 ppm, 2000 aprox. 372 ppm, 2010 aprox. 390 ppm and 2020 aprox. 414 ppm). The current (NOAA Daily CO2 record 2:35:04 AM on Apr. 13, 2023) concentration of carbon dioxide in the atmosphere is about 0.04% ( 423.23 ppm) by volume, having risen from pre- industrial levels of 280 ppm (0.03%) due to greenhouse gas GHG phenomenon. Similarly, it has been shown that global mean temperature has been on the rise since 1880 due to the rapid industrialization through the 19th, 20th and 21st centuries.
In general, it is believed that the atmospheric concentrations of naturally occurring greenhouse gases— carbon dioxide (CO2), methane (CH4), and nitrous oxide (N2O)—three important long-lived greenhouse gases (Figure 2), have varied over the past 650 millennia as the Earth has cooled (glacial periods) and warmed several times (interglacial periods), figure 2b. Leading to concentration units in parts per million (ppm) or parts per billion (ppb)— the number of molecules of the greenhouse gas per million or billion molecules, respectively, in a dry atmospheric sample {each part per million of CO2 in the atmosphere represents approximately 2.13 gigatonnes (Gt) of carbon, or 7.82 gigatonnes of CO2}. Until the past two centuries, the concentrations of CO2 and CH4 had never exceeded about 280 ppm and 790 ppb, respectively. The concentration of CO2 was 421 ppm as of May 2022 and CH4 levels about 1,923.57 ppb as of November 2022.While N2O concentrations have increased from a pre-industrial level of 270 ppb to 332 ppb in 2019.
![Figure 2: Greenhouse Gases and the Global Temperature Fluctuations Long before the Industrial Revolution (b) from 2500 B.C. to 2040 A.D., projection by Climatologist Cliff Harris and Meteorologist Randy Mann, in which volcanic activity rather than human activity was dominant before the industrial Revolution [7].](/fulltextimages/10352/fig_2.png)
Although the natural increase in the Earth’s average surface temperature has risen by 0.07°C (0.13°F) every decade, since 1880, the rate of temperature change has grown significantly more dramatic over time—more than doubling to 0.18°C (0.32°F) since 1981 [8]. Hence, the scientists at NASA’s Goddard Institute for Space Studies (GISS), stated that “the average global temperature on Earth has increased by at least 1.1° Celsius (1.9° Fahrenheit) since 1880 and that the majority of the warming has occurred since 1975, at a rate of roughly 0.15 to 0.20°C per decade”.
These increases are largely attributable to contributions from both natural systems (variations in sunlight, variations in the Sun itself, volcanic eruptions which have generated particles that reflect sunlight, brightening the planet and cooling the climate) and human activities/emissions (from factories, automobiles, deforestation, etc.). Simply put, natural causes are still in play today, but their influence is too small or they occur too slowly to explain the rapid warming seen in recent decades, i.e. have varied approximately plus and minus 0.2° C (0.4° F), (averaging to about zero), while human influences have contributed roughly 0.8° C (1° F) of warming since 1889 [9]. Furthermore “The Intergovernmental Panel on Climate Change (IPCC) estimates that sea levels will rise between 0.18 and 0.59 meters (0.59 to 1.9 feet) by 2099 as warming sea water expands, and mountain and polar glaciers melt”.
Specifically, “Although volcanoes are active around the world, and continue to emit carbon dioxide as they did in the past, the amount of carbon dioxide they release is extremely small compared to human emissions. On average, volcanoes emit between 130 and 230 million tons of carbon dioxide per year. By burning fossil fuels, people release in excess of 100 times more, about 26 billion tons of carbon dioxide, into the atmosphere every year (as of 2005). As a result, human activities, overshadows the contribution, which volcanoes may have made to recent global warming” [9].
Consequent to the temperature rise (a.k.a. global warming of 1.1oC) are other environmental problems such as flooding of coastlines due to melting of the glaciers (polar ice cap melting- decrease in the volume of mountain glaciers); disrupted weather patterns (extreme weather changes around the world) i.e. change in wind and rainfall patterns as well as soil moisture; increase in the length of growing seasons; rises in the ocean levels, increased intensity of tropical storms, and losses in biodiversity, etc. Electric generating facilities often use much water for cooling and release the heated water into lakes or oceans, leading to local ‘impacts on the ecosystem’.
It has been predicted that a rise above 1.5°C would have devastating consequences such as reduction in the amount of food we can get from crops as well as drive 20-30% of plants and animals to extinction. Furthermore, they believe that “Current global greenhouse-gas-emission trajectories put us on track for over 3°C increase by 2100.
![Figure 3: Reflection of the global temperature changes from cooler to warmer from 1880-2022 [10].](/fulltextimages/10352/fig_3.png)
![Figure 4: Global Temperature Graph (1851-2020) [8].](/fulltextimages/10352/fig_4.png)
Figure 3 shows the global temperature anomalies in 1880-1884; 1900-1904; 1940-1944; 1990- 1994; 2005- 2009; and 2022 [10]. It reflects how much warmer or cooler each region has been. The past nine years have been the warmest years since modern recordkeeping began in 1880. And Figure 4 shows the visualized: historical trends in global monthly surface temperatures (1851-2020).
Definitively, “Greenhouse effect is the process by which radiations from the sun are absorbed by the greenhouse gases and not reflected back into space. This insulates the surface of the earth and prevents it from freezing.” Analogically, greenhouse is a house made of glass that can be used to grow plants. The sun’s radiations warm the plants and the air inside the greenhouse. The heat trapped inside can’t escape out and warms the greenhouse which is essential for the growth of the plants.
Similar situation occurs in the earth’s atmosphere in two folds. Firstly, the greenhouse gas in our atmosphere traps/ absorbs some of the radiant heat (infrared heat radiation) from the Sun, and re-radiates some to the surface of the Earth, warming it. This process, as explained above, is the natural greenhouse effect and is completely necessary to our life on this planet. NASA has reported that the average temperature of the Earth as a result of the warming from the greenhouse effect is 15°C. Without the influence of the greenhouse effect on our planet, the average surface temperature would be 255 Kelvin - which can also be expressed as -18°C or 0°F. If this were the case, water on Earth would freeze and life as we know it would not exist.
Secondly, during the day the Sun heats up the earth’s surface (land and ocean). In the night when the earth’s land cools down the heat is radiated back into the atmosphere. During this process, the heat is absorbed by the greenhouse gases in the earth’s atmosphere, making the surrounding of the earth’s surface warmer. Simply put, greenhouse gases absorb solar heat reflected off the earth’s surface and retain this heat, keeping the earth warm and habitable for living organisms. This means, it acts like a blanket around the earth to help keep heat radiated up from escaping. This process, as explained above, is the enhanced greenhouse effect and is generally what is being talked about when people refer to the greenhouse effect and climate change. This effect refers to the increased heating of the Earth’s surface as a result of a higher amount of greenhouse gases being released into the atmosphere from human activities. That is, the more greenhouse gases that accumulate, the more heat it will retain. Producing too thick a blanket around the earth causes too much heat to be trapped and an average rise in global temperatures occurs, hence the emphasis is for carbon- neutrality.
Precisely, out of the solar “short-wave” radiation that reaches the earth, some two-thirds are absorbed and the remainder is reflected back into space as infra-red “long- wave” radiation. Subsequently, the greenhouse gases absorb some of this “long-wave” radiation and reflect it downwards to warm the earth’s surface. Without the greenhouse effect, or atmospheric re-radiation, the average surface temperature of the earth would be some 330C cooler than it is today and the world would be uninhabitable. Therefore greenhouse effect is a natural process that warms the Earth’s surface. Hence, the earth system requires the GHG effect to function/ occur as a result of the combined effect of the solar radiation that reaches the earth and the atmospheric re- radiation by greenhouse gases, which include water vapor (the predominant one), carbon dioxide (CO2), methane (CH4), nitrous oxide (N2O) and, in recent years halocarbons {chlorofluorocarbons (CFCs) and their substitutes – hydrofluorocarbons (HFCs) and perfluorocarbons (PFCs)} and six types of sulphur hexafluoride (SF6), (Figure 5) and (Figure 6) shows the complete solar system arrangement and operational pattern.
The worst-case scenario results to the “runaway
greenhouse effect” phenomenon which occurs when the planet absorbs more radiations than it can radiate back. Thus, the heat lost from the earth’s surface is less and the temperature of the planet keeps rising. This is also called the “positive feedback loop”.
Quote: The greenhouse effect is not the same on all planets, and differs dramatically based on the thickness and composition of the atmosphere. Three planets that show how dramatically the conditions of a planet can change with the different levels of the greenhouse effect are Venus, Earth, and Mars. These planets illustrate a kind of “Goldilocks effect”, meaning that the influence of the greenhouse effect on Venus is too great, making the planet too hot to live on. Conversely, the greenhouse effect on Mars is too small, making it far too cold. Earth exists as the “just right” planet, with the greenhouse effect having just enough influence to make the planet livable. End of quote.
![Figure 5: Reflects the natural phenomenon for keeping the earth’s surface warm via the combined effect of the solar radiation that reaches the earth and the atmospheric re-radiation by greenhouse gases [11-13].](/fulltextimages/10352/fig_5.png)
![Figure 6: The complete solar system arrangement and the orbital speeds of the planets [14-17].](/fulltextimages/10352/fig_6.png)
Note-worthy also is the contribution from the increasing human population. Figure 7 shows the movement of air through airways (mouth and nose) outside to the lungs inside and the composition of human inhaled and exhaled air.
The respiratory system is the network of organs and tissues that help in breathe i.e. absorb oxygen from the air so human organs can work. It also cleans waste gases, such as carbon dioxide, from the blood. The airways (mouth and nose) pull air from outside and deliver air to the lungs (Figure 7a). Pharynx (throat) is the tube that delivers air from the mouth and nose to the trachea (windpipe) i.e. passage connecting the throat and lungs. Bronchial tubes are the tubes at the bottom of the windpipe that connect into each lung i.e. the two organs that remove oxygen from the air and pass it into the blood and the bloodstream delivers oxygen to all organs and other tissues. Muscles (diaphragm) and bones help move the inhaled air into and out of the lungs i.e. pull in air and push it out.
The air which we breathe in and breathe out is not pure oxygen or carbon dioxide respectively. The atmosphere is a mixture of gases and it contains 78% nitrogen, 21% oxygen, 1% argon, 0.04% carbon dioxide, 0.5% water vapor. Thus, when we breathe in, we inhale the same mixture of gases contained in the atmosphere as our nose cannot filter out the oxygen from other gases. On the other hand, when we exhale, the composition of the air remains almost the same as the air we inhale, only the percentage of carbon dioxide and oxygen changes. The amount of inhaled air contains 21% of oxygen and 0.04% of carbon dioxide, while the air we breathe out contains 16.4% of oxygen and 4.4% of carbon dioxide, figure 7c. This is because our “cell” use oxygen from the inhaled air to release energy and give out carbon dioxide as a byproduct i.e. we breathe in oxygen (O2) to fuel organs and tissues and the end product is CO2. The balance between these two gases is required for a healthy body. In the human body, the oxygen is absorbed by the blood stream in the lungs, being then transported to the cells where it oxidized the nutrient compounds, inside of the cell through complex enzymatic processes i.e. the metabolism of the living organisms. This is the process of chemical and physical change which goes on continually in the human body: build-up of new tissue, replacement of old tissue, conversion of food to energy, disposal of waste materials, reproduction - all the activities that we characterize as “life”. Imagine the contribution of CO2 into the atmosphere by all living-animals per seconds- per seconds of inhaling (0.04%) and exhaling (4.4%) of carbon dioxide continuously weather awake or sleeping
24/7 and 365 days. It took over 200,000 years of human history for the world’s population to reach 1 billion; and only 200 years more to reach 7 billion (i.e. in 2011), while as of march 30, 2019, the total population of the world was 7,714, 576,923 (7.71billion) people and on march 16, 2023, it was 8,022,112,348 as at 12.40AM, figure 8. The United Nations has gradually been revising its predictions downwards, and now believes that the world population in 2050 will be around 9 billion, I strongly believe that it will be very far more than that, based on the different between march 30, 2019 and march 15, 2023 of 4years with 307,535,425 rise. That is approximately 307million every 4years [18].
![Figure 7: Movement of air through airways (mouth and nose) from outside to the lungs inside and the composition of human inhaled and exhaled air [19-22].](/fulltextimages/10352/fig_7.png)
![Figure 8: The United Nations has gradually been revising its predictions downwards, and now believes that the world population in 2050 will be around 9 billion, I strongly believe that it will be very far more than that, based on the different between march 30, 2019 and march 15, 2023 of 4years with 307,535,425 rise. That is approximately 307million every 4years [18].](/fulltextimages/10352/fig_8.png)
Figure 9 depicts the estimates for carbon dioxide sources and destinations since 1850 [5]. Conventionally, the gaseous separation/capture industry have been concentrated on direct capture from CO2 from sinks (e.g. atmosphere and ocean) such as (i) capturing CO2 from air (ii) capturing CO2 from ocean (iii) separation of O2 from the air (iv) separation of N2 from the air (v) capturing CO2 from centralized flue gas emitters such as fossil fueled power plants/process furnaces, iron, steel, cement industries, coal processing units, incinerators, etc. (vi) gaseous components separations from petroleum well sites and equipment, refineries, petrochemical and chemical plants, etc. However, this approach is impotent to achieve a net zero CO2 emission because, decentralized sources (such as emissions from the transportation- vehicles, trucks, lorry, intercontinental air- planes, marine ships, non-electrical railway trains, portable electric generators, etc.) still constitute a large part of the total emission (about 16.2% GHG emissions in 2020 [24]), figure 10 and has gone up to 17% this 2023. Figure 11 shows the contribution from the different mode of transportation in EU in 2019 [25]; and figure 12 represented the carbon emissions of the “Big Tech” in 2021 [26].
![Figure 9: Carbon dioxide sources and destinations since 1850 [5].](/fulltextimages/10352/fig_9.png)
![Figure 10: Global greenhouse gas emissions contribution from the different sectors [24].](/fulltextimages/10352/fig_10.png)
![Figure 11: The greenhouse emissions contribution from the different mode of transportation in EU in 2019 [25].](/fulltextimages/10352/fig_11.png)
![Figure 12: Presents the carbon emissions of the “Big Tech” in 2021[26].](/fulltextimages/10352/fig_12.png)
From the foregoing, the atmosphere (troposphere region) gets clogged with more particles of carbon dioxide every minute by both centralized (factories i.e. Steel/cement production, power industry, etc.); and decentralized (animals and agriculture, transportation sector, and more) emitters/ sources. The estimate is that we currently emit around eight billion tons of carbon per year, hence, in order to keep temperature rises below 2℃ we would have to remove from the atmosphere at least a few billion tons of CO2 per year and maybe ten billion or more rates in the latter part of this century that will exceed emissions at that time (“net negative emissions”).
The present “CO2 removal” techniques include the engineered solutions that “scrub” CO2 directly from dilute sources (CO2 sinks), such as from atmosphere air and ocean seawater {e.g. direct air capture (DAC)-a post capture technique [27]}, using chemical absorbents, and then recover, purify, compress and liquefy it, so that it can be buried/ stored/sequestrated deep geological layers underground the land or the ocean a.k.a. CO2 capture and sequestration (CCS) or carbon capture and storage (CCS); growing trees on land or algae in the sea which capture some of the carbon from the atmosphere or in the sea to grow. Both are methods of CO2 removal, designed to take from the air and/or sea what cannot easily be prevented from reaching it. There are also engineered solutions that are being directed at preventing the emissions from reaching the atmosphere (in other words, keeping more CO2 from going into the atmosphere) i.e. pre-capture techniques a.k.a. CO2 capture and utilization (CCU), mostly from centralized emitters/ sources. For instance, capturing carbon from power plants and using it in generating more electricity from renewable sources such as Synfuels (synthetic hydrocarbon fuels and chemicals).
Notably, two companies, the “Carbon Engineering” and the “Climeworks” are applying the direct air capture (DAC) technique [28, 29]. Their individual facilities can go to megaton scales—million tons of CO2 captured per year (by addition of units). According to Geoff Holmes of Carbon Engineering, “That’s capturing and purifying the quantity of emissions released by 250,000 cars”. Also several process plants are applying the (CCU) technique, typical example of companies that are using the Earthly Labs CO2 recovery solution (CiCi) are Austin Beerworks and Alchemist Brewery, which captures CO2 from the fermentation process that was previously released to atmosphere, stores and re-use it in their carbonating and packaging processes [30, 31]. The automotive trade journal Ward’s Auto had estimated that the total number of light-duty vehicles in the world crossed 1 billion vehicles sometime during 2010. In 2014 it was 1.2 billion as of July 29, 2014. By some estimates, the total number of vehicles worldwide could be 1.55 billion now (2023), 2 billion by 2035 and 2.5 billion by 2050. Which mean that to keep carbon emissions level with today’s total, average fleet fuel efficiency would have to double? In addition the global aircraft fleet is expected to have 25,578 aircraft in service worldwide, while around 58,000 merchant ships are trading internationally and an excess of 350,000 trains (passenger and freight trains) as well as over 100,000, 000 long distance commercial passenger and freight trucks.
On the other hand, a variety of systems for controlling emissions from automobiles exhaust pipelines have been developed such as the (i) positive crankcase ventilation (PCV) valve; (ii) the exhaust gas recirculation (EGR) system; (iii) the catalytic converters (Cat-Con) devices; (iv) the particulate matter and black smoke removal device; (v) the advanced vehicle technologies {which includes battery- powered electric vehicles EVs, plug-in hybrid electric vehicles (gasoline-electric), hydrogen fuel cells vehicles (power with electricity supply to an electric motor), flexible-fuel vehicles or FlexFuel vehicles (FFVs)- E10-E85 gasohol to E100 ethanol fuel, i.e. vehicles/cars that may run on any gasoline and ethanol fuel blended/combination, from 100 percent hydrated ethanol to 100 percent gasoline e.g. E10 bio-fuel, E18, E20, E25, E85, E100 (an azeotrope composed of 95.6% ethanol and 4.4% water), (vi) the Solar-powered electric vehicles and (vii) the sustainable aviation fuel (SAF) a.k.a. bio-aviation fuel (BAF) or bio-jet-fuel is an ultra-low-carbon fuel that serve as alternative to the fossil fuels traditionally used by airlines (i.e. cleaner alternative to power aircraft)}. Excluding the battery-powered electric vehicles EVs and the hydrogen fuel cells vehicles, the combined outcome of all the systems simply resulted to the emissions of only the lesser harmful gases water vapor, carbon dioxide, oxygen and nitrogen. While in addition the sustainable aviation fuel (SAF) is capable of reducing aviation carbon dioxide emissions by up to 80% in comparison to using conventional fossil-based jet fuels.
The innovation article is targeted at eliminating the remaining 20% carbon dioxide emissions and the other components emissions to achieve an overall zero emissions from the transport and power generation sector, because the growing demand for carbon energy as a resource coupled with the current agriculture techniques (which results to net global deforestation), implies that CO2 will continue to be emitted as evidenced with the following facts.
- For over 140 years, the internal combustion engine has been the heartbeat of our planet, moving billions of people, goods, and materials across the world in cars, trucks, ships, planes and trains. And the future will be no different, as more countries globally move themselves out of poverty and consume more energy.
- “The automobile industry is responsible for about two- thirds of the rubber, one-half of the platinum, one-third of the aluminum, one-seventh of the steel, and one-tenth of the copper consumed in the United States each year. About four-fifths of the material in a car is recyclable, and in the United States 19 out of 20 Scrapped cars are recycled. Because the automobile is likely to remain an important part of the transportation system, it requires continuing improvement in safety and emission control as well as performance and cost”.
- Current estimates predict that there will be 1.7 billion vehicles using internal combustion engines by 2040. This clearly poses huge challenges for both our natural resources and the environment – particularly in terms of carbon dioxide (CO2) emissions and impending targets on carbon neutrality.
- Presently, the renewable energy sources, solar, wind, wave, tidal, biomass (wood or crops such as sugar), ocean thermal energy conservation (OTEC), electro-kinetic energy, hydrogen, nuclear fusion, geothermal energy and hydro power contribute less than one-fifth ( > 20%) of the worlds commercial energy supply, despite the fact that many of the technologies necessary to harness these energies are fully developed.
- Approximately 70% of the world’s coal production is used to generate 40% of the world’s electricity, 12% is made into coke used to produce 70% of the world’s steel, and the remaining 18% used for industrial and domestic purpose. For instance, the steel wire used for tire cords is made from a high carbon steel rod, i.e., > 0.7% carbon, which gives a high-modulus, high-tensile wire. Coal plants today typically use what is called pulverized coal. That means the coal is ground up, burned, and the steam from that burning drives turbines. There’s also newer integrated gasification combined cycle (IGCC) technology, which sends the gas through a combustion turbine to generate electricity, and then routes excess heat from that process to generate even more electricity through a traditional steam turbine.
- Today, petroleum has major influence in the world politics and economy. It is also the most important energy source, providing fuel for transportation, electricity generation and raw material from which many key substances are made (plastics, pharmaceutical drugs, automobile parts, etc). Currently, more than 50% of world energy demand is met by oil and gas.
- The question for the energy industry becomes, can there be any alternative energy source or combinations that will be enough to replace petroleum, especially in the transportation sector which currently consumes from 75 to 80% of the oil produced or for power generation and petrochemicals that uses gas as the primary source of energy. Practically, it implies that the only option is to continue the trend of improving the products until we achieve zero emissions.
- Advantages of fossil fuels are that they have been abundant and low cost; crude oil use to have an Energy Profit Ratio (EPR) of 100 to 1 i.e. it took only one barrel of oil to extract 100 barrels of oil. This was such a fantastic ratio that oil was practically free energy. However oil’s EPR is now down to 10 to 1, which is still pretty good. If a proposed alternative source does not have an EPR comparable to that of oil, the amount of good it does us is very limited.
- Furthermore, Experts foresee the world’s energy needs to be almost 50% greater in 30 years from now (2050) due to the present rate of petroleum energy consumption and the world’s astronomical population growth especially in the developing countries, figure 13 and figure 14.
![Figure 13: Evolution of the human Energy Sources [32].](/fulltextimages/10352/fig_13.png)
![Figure 14: The rising world energy consumption that is projected to increase 30% - 50% by 2040 [33].](/fulltextimages/10352/fig_14.png)
Mechanism Of CO2 Release from Fossil Energy Resources and Biomass Resources
The organic origin theory of fossil energy carriers is based on the decomposition of the complex organic matter found in dead plants and animals (Figure 15). This theory assumes that coal, oil and gas was formed in a very remote past i.e. the genesis took place over much extended periods lasting for tens of thousands of years under geological conditions that allowed the substance produced, to seep through the sedimentary rocks and accumulate under the impenetrable caps in the so-called “trap-rocks”.
The process of conversion from dead plants and animals organic matter into fossil energy carrier can be summarized in three steps. (a) Diagenesis: characterized by low-temperature 50oC (122oF) and it involves conversion of organic matter to kerogen (b) Catagenesis: occurs as further burial results in more pressure and increased heat in the range of 50oC to 150oC (122oF to 302oF), which causes chemical bonds to break within kerogen (c) Metagenesis: in this final stage, heat and chemical changes transform kerogen to hydrocarbons (which are compounds composed of hydrogen and carbon). The temperatures ranges from about 150oC to 200oC (302oF to 392oF) and higher [34].
![Figure 15: The organic origin theory of fossil energy carriers based on the decomposing of the complex organic matter found in dead plants and animals [35,36].](/fulltextimages/10352/fig_15.png)
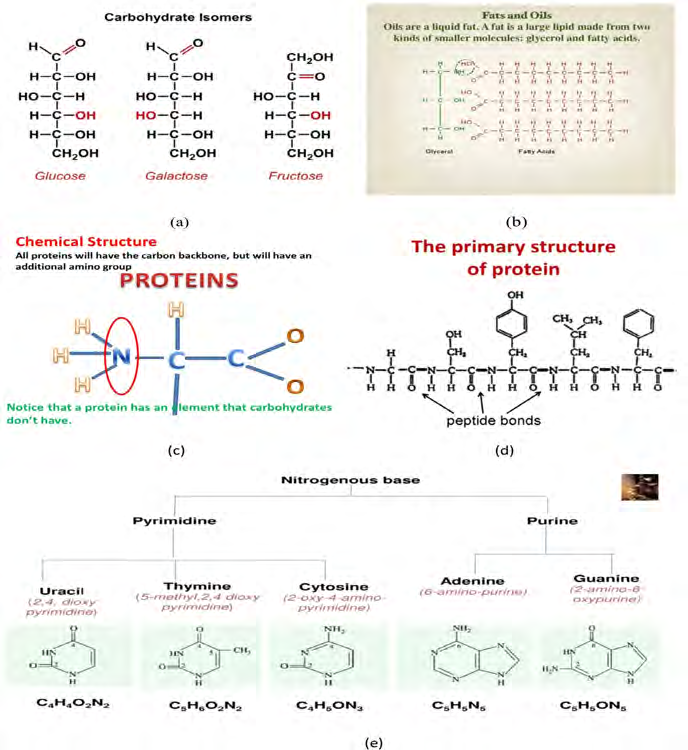
The structure of biomass (living organisms-plants and animals), which also constitutes the starting material for the fossil energy carrier (dead plants and animals) is complex and usually are cellular in nature. The simplest form of life consist of a single cell (single-celled organisms such as bacteria and some algae), while the more complex forms of life are multi-cellular organisms (multi-celled organisms such as plants and animals). Fundamentally the cell is composed mainly of four classes of molecules: carbohydrates, lipids (fats and oils), proteins, and nucleic acids, which are organic compounds, figure 16.
In organic chemistry, a carbohydrate is a biomolecule consisting of carbon (C), hydrogen (H) and oxygen (O) atoms with the general formula C6H12O6. Carbohydrates are utilized by animals and humans in metabolism to produce energy and other compounds. The most common classification schemes divide it into four major groups—monosaccharides, disaccharides, oligosaccharides, and polysaccharides.
Lipids are a diverse family of molecules that includes fats & oils, phospholipids, waxes, and steroids. Proteins have the general formula RCH (NH2) COOH, where C is carbon, H is hydrogen, N is nitrogen, O is oxygen, and R is a group called a side chain that varies in composition and structure.
Each nucleic acid contains four of five possible nitrogen- containing bases: adenine (A), guanine (G), cytosine (C), thymine (T), and uracil (U). The A and G are categorized as purines, and C, T, and U are collectively called pyrimidines. Part of the structure of nucleic acids, which contain genetic information, consists of carbohydrate.
All plants, algae and certain bacteria are able to make their own food by the process of photosynthesis i.e. plants use the chloroplasts (the green pigment chlorophyll in plant- leaves) in their cells, to capture the energy from the sun- in the form of light energy, or photons, and use it together with carbon dioxide from the air and water from the earth (soil/ground), to manufacture a range of glucose compounds (such as sugars, starches and cellulose), collectively called carbohydrates (complex compounds composed of carbon, hydrogen, and oxygen) (Figure 17). Basically, the carbon dioxide and water are converted into ‘oxygen’ byproduct (a waste product that is released back into the air) and ‘glucose compounds’ (the source of energy for the plant). Furthermore, the simple sugars are then converted into other molecules such as starch, fats, proteins, enzymes, and DNA/RNA i.e. all of the other molecules in living plants.
![Figure 17: The Process and Chemistry/Chemical Reactions of Photosynthesis [42, 43].](/fulltextimages/10352/fig_17.png)
On the other hand, animals cannot manufacture carbohydrates (i.e. glucose) within their bodies. Therefore, they rely completely on those manufactured by plants. In essence, when other organisms (animals, fungi and microbes) eat plants, the energy in plant is then transferred into them by processes of digestion and assimilation, which are not efficient (i.e. bulk of it is also stored after being eaten by humans or animals in waste material). Simply put, some of this stored energy in plants is passed on to animals when they eat plants (or eat other animals) and for example only about 10 percent of the biomass eaten by a cow is converted into new cow and only about 10 percent of cow eaten by a person gets turned into new person. Similarly, in sugar cane, a good example of a biomass crop, the chief commercial product, sugar, is extracted from the cane by removing the juice; the remainder of the plant, called “bagasse”, still contains the chemical energy of the sun.
The stored energy (in waste material or bagasse etc.) is released as heat, methane gas, sugar, alcohol or other useful chemical compounds when biomass is burned, allowed to decay/decompose or processed chemically, (Figure 18). In the process of firewood combustion, two ingredients (biomass and oxygen) are combined in a high temperature environment to form carbon dioxide, water vapor, and heat.
CH1.44O0.66 + 1.03 O2 = 0.72 H2O + CO2 (+Heat)
Note: CH1.44O0.66 is the approximate chemical equation for the combustible portion of biomass. Thus, when plants die, the process of photosynthesis is reversed. In other words, the death and decay of vegetation and animals results in the return of carbon dioxide back into the environment through the process of combustion and decay.
![Figure 18: Direct combustion of biomass firewood for heat and methane gas release from landfill [44-46].](/fulltextimages/10352/fig_18.png)
Factually, since the mid-1800s, fossil energy coal, crude oil, natural gas– each includes carbon has been the primary energy resource of global economic growth via direct combustion and indirect combustion of products, such as (kerosene, gasoline, diesel, fuel oil, etc. – mostly alkane products) in the internal combustion engines.
Scientifically, an alkane undergoes combustion when it reacts with oxygen to produce carbon dioxide, water, and energy [47]. And this is the basis for their use as energy sources for heat in {natural gas (CH4), liquefied petroleum gas (LPG, C3-C4), power gasoline (C5-C11), aviation fuel/ kerosene (C12-C15), diesel fuel (C14-C18), and fuel oil (C18+), etc.}. Precisely a mixture of air and hydrocarbon vapor in proper proportions explodes on ignition, and the heat energy produced is used to do work [48].
Hence: Alkane + O2 ⟶ CO2 + H2O + energy Standard heat of combustion is the heat released when one mole of a substance in its standard state (gas, liquid, solid) is oxidized completely to carbon dioxide and water, and is given the symbol ∆Ho.
The equations [49] for the combustion of methane (CH4), propane (C3H8), hexane (C6H14) and octane (C8H18) are:
CH4 (g) + 202 (g) ⟶ CO2 (g) + 2H2O (g) + heat energy: ∆Ho = -890.4KJ (-212.8 k cal)/mol C3H8 (g) + 5O2 (g) ⟶ 3CO2 (g) + 4H2O (g) + heat energy: ∆Ho =-2220 KJ (-530.6kcal)/mol 2C6H14 (l) + 19O2 (g)⟶ 12CO2 (g) + 14H2O (g) + heat energy: ∆Ho =-4163 KJ/mol 2C8H18 (l) + 25O2 (g) ⟶ 16CO2 (g) + 18H2O (g) + heat energy: ∆Ho =-5470 KJ/mol In a deficiency of oxygen, carbon monoxide or carbon black may be produced (Bamkole, Ogunkoya, 1978). That is, if the supply of oxygen is limited, incomplete combustion of methane in natural gas is written as.
2CH4 (g) + 3O2 (g) ⟶ 2CO (g) + 4H2O (g) + heat Limited oxygen Supply carbon monoxides water/steam energy In practical terms, part of oxygen reacts with the carbon component to yield CO2, while the remaining part of the oxygen reacts with the hydrogen component to yield H2O. According to United States Environmental Protection Agency, “in a perfect engine, oxygen in the air would convert all the hydrogen in the fuel to water and all the carbon in the fuel to carbon dioxide.” This would mean the nitrogen in the air would remain pretty much unaffected.
Fossil fuels (gaseous or liquid), contains hydrocarbons, whose carbon atoms are linked together in chains of different lengths. The chains from C5H16 through C11H24 are blended together and used for gasoline. Next is kerosene, in the C12 to C15 range, followed by diesel fuel and heavier fuel oils (like heating oil for houses). The different mixtures of hydrocarbon compounds are different in volatile, boiling points and molecular weights.
Chemically, gasoline is a mixture of 5-11 carbons comprising aliphatic alkanes like heptane, branched alkanes like iso-octane, aliphatic cyclic compounds, and small aromatic compounds. But there are no alkenes or alkynes other than these hydrocarbons. Usually, manufacturers mix the additional compounds iso-octane or benzene and toluene with gasoline in order to enhance its use in engines i.e. to increase its octane rating.
Chemically, kerosene is a mixture that consists of about 10 different hydrocarbons, each containing 10 to 16 carbon atoms per molecule. The main constituents are saturated straight- chain and branched-chain paraffins (55.2%), as well as ring- shaped cyclo-paraffins {also known as naphthenes (40.9%)}, and aromatic hydrocarbons (3.9%) [50, 51].
On the other hand, chemically, diesel consists of hydrocarbons having longer carbon chains from 8 to 21. The compounds in this fuel include paraffin, iso-paraffins, naphthenes, olefins and aromatic hydrocarbons. Depending on the usage, we can categorize it into different grades, such as 1-D (S15), 1-D (S500), 1-D (S5000), 2-D (S15), 2-D (S500), 2-D (S5000), and 4-D.
Coal Fossil Energy Resources CO2 Release Mechanism
The typical coal formula is (C135 H96 O9 NS); Lignite (CH0.849 N0.015 O0.211); Bituminous (CH0.793 N0.015 O0.078); Anthracite (CH0.358 N0.009 O0.022). Hence, coal has the approximate chemical formula CH. When coal is burned, the hydrogen is converted to water and the carbon to carbon dioxide. Energy is obtained from both the hydrogen and the carbon, and one carbon dioxide (CO2) is emitted into the atmosphere.
Petroleum Fossil Energy Resources CO2 Release Mechanism
Petroleum (crude oil/asphalt and natural gas) is not a simple substance but a mixture of many different kinds of (liquid/semi-solid/solid and gases) complex saturated/ stable hydrocarbons, which include paraffins/isoparaffins (or alkanes), naphthenes (cycloparaffins), and asphaltics (multi-ring paraffins). The simplest member of the series, methane, with chemical formula CH4- one atom of carbon combined with four hydrogen atoms, is the most abundant or predominant component and is always present in gaseous form.
The other hydrocarbons components include ethane (C2H6), propane (C3H8), and butane (C4H10) whose components may occur in either gaseous or liquid form, depending on the pre-existing temperature and pressure conditions, while the pentanes (C5 H12), hexanes (C6H14), heptanes (C7 H16), and heavier hydrocarbons, up to triacontane (C30H62) are always in liquid/wax form. Components ranging from hentriacontane (C31H64) to Asphaltene (C80H162) are always in semi-solid/ solid form. Currently it supplies a large percentage of the world’s energy demand.
Crude oil has the approximate chemical formula CH2. Burning crude oil releases energy from both hydrogen atoms and from the carbon atom, and still one carbon dioxide is emitted. Hence, more energy is released per carbon dioxide emitted compared to coal.
Natural gas is mainly methane which has the exact chemical formula CH4. Burning methane releases energy from the four hydrogen atoms and from the carbon, but still only emits one carbon dioxide. Therefore, natural gas is the best fossil fuel in terms of energy output per unit carbon dioxide emitted.
Biomass energy resources CO2 release mechanism: Biomass is renewable because a new crop can be grown after each harvest. It exhibits carbon neutral cycle because it breathes carbon dioxide (extracted from the atmosphere) and stores it in its tissue. When it re-grows, it absorbs exactly the same amount of carbon dioxide in the process of photosynthesis. However, when biomass is burned, it emits carbon dioxide into the atmosphere. To be specific, although biomass is often said to be zero carbon, it is more accurate to say that, it is a very low carbon fuel. Usually, the carbon dioxide released in burning biomass is emitted very quickly, but only reabsorbed over the growth period of the biomass. The timescale of biomass carbon neutrality can be 20 or 30 years in the case of some trees.
Bio-refinery can use all kinds of biomass including dedicated wood and agricultural crops (such as corn, sugar cane and grasses such as Giant King Grass), organic residues/ biodegradable waste resources (both plant and animal derived, and industrial and municipal wastes) and aquatic biomass (e.g., algae, aquatic sea weed, chitin, etc.). The typical biomass formula is (CH1.44O0.66). Hence, biomass is a low carbon fuel, with approximate chemical formula CHO. It is similar to coal with an oxygen atom added. The oxygen reduces the energy of biomass compared to coal, because the carbon is “half burned” and that energy is not available. When biomass is burned, energy is obtained from the hydrogen atom and some energy from the further burning of CO (but this is less energy than produced when burning coal) and one carbon dioxide is emitted into the atmosphere. Based on this perspective, biomass is a worse fuel than coal in terms of carbon dioxide emissions per unit of energy produced. The situation is reversed based on {biodiesel or bioethanol C2H5OH and methanol CH2OH from lingo-cellulosic or cellulose (C6H10O6), derived from biomass (CH1.44O0.66)}; which has the approximate chemical formula CH3O. Burning methanol or ethanol releases energy from the three hydrogen atoms and some energy from the further burning of CO, but still only emits one carbon dioxide. Making it the second best fuel (after natural gas), in terms of energy output per unit carbon dioxide emitted.
Seemingly, FT-GTL synthetic products “Synfuels” (GTL- gasoline (C5-C11), GTL- jet kerosene (C12-C15), GTL-diesel (C14-C18), GTL-marine fuel oils) releases very low CO2 (g) and steam H2O (g) on combustion, because they are composed of synthesized carbon components. Technically, at present they are made from the steam reforming of natural gas (mainly methane CH4) and the thermo-chemical conversion process for the biomass-derived energy carriers which uses feedstock-such as coal, heavy oil, biomass or waste organic matters in the gasification process, which is actually, combined pyrolysis and gasification processes for generation of “synthesis gas” {carbon monoxide and hydrogen (CO + H2) mixture}, which subsequently converted to liquid fuels, hydrogen or chemicals and to electricity via turbines or fuel cells.
Furthermore, the general reaction formula for steam reforming of saturated hydrocarbon components {CnHm + nH2O → nCO + (m/2+n) H2}; dry reforming and bi- reforming concepts, can be applied to convert the entire end products stream from the conventional petroleum refinery (comprising C1 to C70+) to carbon monoxide and hydrogen (CO + H2) mixture, for subsequent production of Synfuels [52].
So far, to date this is the cleanest and practically it is the best scenario that can be actualized or is achievable. This is evidenced by the use of the F-T jet fuel (aviation fuel) a.k.a. the sustainable aviation fuel (SAF) which reduces emissions by approximately 80% compared to traditional petroleum crude oil, kerosene-based jet fuel. Hence the only remaining available option to eliminate the unavoidable 20% CO2 (g) exhaust emission from the combined global abundant fossil energy resources (that most occur from the combustion reactions of carbon and oxygen as well as hydrogen and oxygen, the constituents of the fuel) is to capture it in real- time using any of the established CO2 (g) capture techniques via gas liquefaction concepts or catalytic transformation to other chemical compounds.
Living Organisms CO2 Release Mechanism
Living organisms consume carbohydrates (a range of glucose compounds-such as sugars, starches and cellulose) and other organic materials {lipids (fats & oils, phospholipids, waxes, and steroids), proteins, and nucleic acids}, using oxygen in the body to form water, carbon dioxide, and releases energy, which is captured by the cell in the form of adenosine triphosphate, or ATP (a small molecule that gives cells a convenient way to briefly store energy) [53]. All of the chemical reactions that take place inside of a cell living organism are collectively called the cell’s metabolism a.k.a. cellular metabolism or cellular respiration. And it provides the energy for all vital processes and for synthesizing new organic material, figure 19. The breakdown chemical reaction equation of glucose is C6H12O6 + 6O2 --> 6CO2 + 6H2O, where 2870 kilojoules of energy are released for each mole of glucose that’s metabolized. “Although this equation does describe the overall process, its simplicity is deceptive, because it conceals all the details of what’s really taking place. Glucose isn’t metabolized in a single step. Instead, the cell breaks glucose down in a series of small steps, each of which releases energy [54]. The water and carbon dioxide are expired (given off) by humans and animals.
![Figure 19: The breakdown chemical reaction equation of glucose is C6H12O6 + 6O2 --> 6CO2 + 6H2O, where 2870 kilojoules of energy are released for each mole of glucose that’s metabolized. “Although this equation does describe the overall process, its simplicity is deceptive, because it conceals all the details of what’s really taking place. Glucose isn’t metabolized in a single step. Instead, the cell breaks glucose down in a series of small steps, each of which releases energy [54]. The water and carbon dioxide are expired (given off) by humans and animals.](/fulltextimages/10352/fig_19.png)
In summary therefore, the direct products of photosynthesis are: plant matters – leaves, stems, etc. while the indirect product of photosynthesis is animal mass resulting from the consumption of plant material and animal excretes, all of which constitute the various types of biomass. Dead plants and animals’ material buried underground over millions of years transform to fossil energy used to produce conventional fossil fuels (gasoline-petrol, diesel, kerosene- jet fuel, etc.). In recent times, as an alternative, chemical processing of living or waste biomass converts it in real-time to bio-fuels (Ethanol and methanol) a category of Synfuels.
Operationally, based on their compositions {Coal C135 H96 O9 NS}; {Crude Oil pentanes (C5 H12) up to triacontane (C30H62), with trace quantities of N2 S, O2}; and {biodiesel or bioethanol C2H5OH and methanol CH2OH from lingo-cellulosic or cellulose (C6H10O6), derived biomass (CH1.44O0.66)}; which contains, hydrocarbons and trace elements/metals. The ideal consumption/combustion of all these fuels results in exhaust gases (flue gas emission) containing carbon dioxide CO2 , carbon monoxide CO, steam H2O, sulphur oxide SO2, nitrous oxide N2O and particulates, in varying quantities depending on the particular fuel, which can cause pollution to the surrounding environment and air if prevention steps are not taken, figure 20. For instance, CO2 released by gasoline is about 2.44 kg/l, while ethanol releases about 1.94 kg/l, which means it reduces CO2 emissions by 21 percent. The combustion of 1 liter of diesel fuel releases approximately 13% more CO2 than for the same amount of gasoline fuel.
![Figure 20: Presents the major human activities that constitute greenhouse gas cycle [43, 55].](/fulltextimages/10352/fig_20.png)
![Figure 21: Presents the photosynthesis and celluar respiration equations and cycle [56-58].](/fulltextimages/10352/fig_21.png)
Figure 21 is the photosynthesis and celluar respiration equations and cycle, which vividly illustrates that the reactants in photosynthesis are the same as the products of celluar respiration, while the products in photosynthesis are the same as the reactants of celluar respiration.
Conventional Physical Change of States
The three homogeneous physical states or phases (solid, liquid and gas), in which a substance can exist is as shown in Figure 22.
![Figure 22: Arrangement and movement of molecules/particles in the various states of matter [59].](/fulltextimages/10352/fig_22.png)
Although the liquid state is intermediate between the gaseous and solid states, it appears to be closer to the solid state than the gaseous state. The major characteristic feature of a solid is the orderly arrangement of its particles because the intermolecular attraction between the molecules is more dominant, and the movement of the molecules is restricted to vibration about a mean position. The same forces which hold molecules together in a solid (crystal) still hold them together in liquid, although less firmly. In a liquid intermolecular attraction is supreme, but the thermal energy of the molecules prevents them from occupying fixed positions. Thus the structures formed in liquid are temporary i.e. constantly breaking down and re-forming and in many cases the structures will be only partially complete. In contrast, a gas is characterized by the disorderly distribution of its particles since the distance between the molecules is greatly increased [60]. Figure 23 shows the general cooling and heating curve pattern for physical change of states from gaseous to liquid to solid and vice versa.
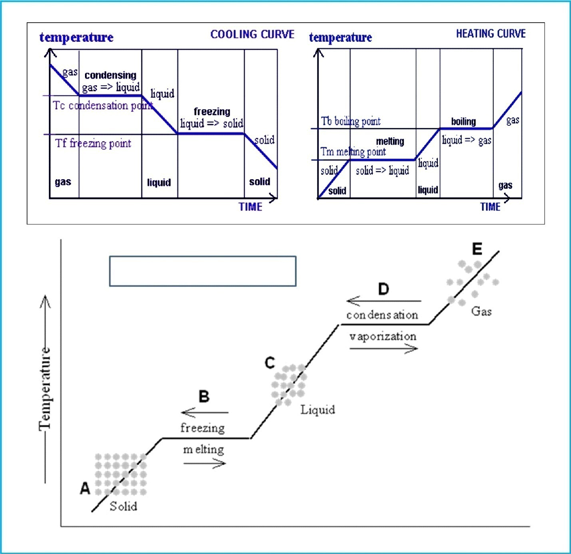
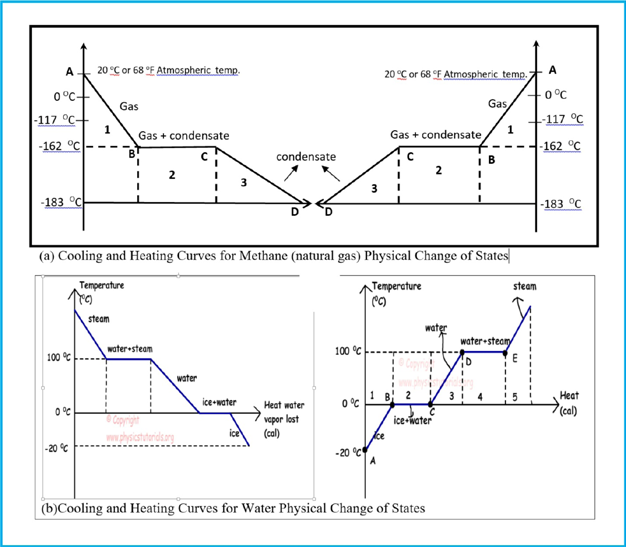
Figure 24 shows the typical cooling and heating curves for methane (natural gas) and water physical change of states. For instance, graph (24-a) shows the relationship between temperature and heat loss, when methane gas is cooled to its condensation temperature. At point A; normal temperature 20oC (68oF) and atmospheric pressure 14.7 psia, it is gaseous methane. Within the interval of points A and B, it losses heat to cool from 20oC to its critical point -82.3oC (-117oF) and further to point B, its condensation/ boiling point -162oC (-260oF), and the gas starts to condense. Between points B and C, there is no change in temperature, because its state is changing from gas to condensed liquid.
At point C, the condensation process is completed and it becomes liquefied methane i.e. liquefied natural gas (LNG). Between points C and D, it remains condensate liquid, but if cooling continues below -183oC, its freezing/melting point, the condensate will start to freeze. In the reverse case, graph (24-b) shows the relationship between temperature and heat gain, when water ice (-20oC) is heats to water (0oC) and then steam (100oC).
Figure 25 shows the phase diagram pattern for water (H2O), methane (CH4) and nitrogen (N2), juxtapose (placed side by side) on the same scale drawing to illustrate the sequence of liquefaction for the multiple component system. Hence, to process the flue gas from the exhaust pipeline containing the three components, entails an initial systematic uncoupling of the entire components of the gas stream into their individual pure components based on their different boiling points. Pure water (100oC or 373.1500K); pure methane (-162oC or 111.1500K); pure nitrogen (-195.8oC or 78.1500K). Cooling the stream to the standard temperature and pressure 68oF (20oC or 293.1500K) and 14.7 psia or 1.01325 bar or 760 mm Hg}, will liquefy steam to water and it is recovered in scrub column. Further cooling to -162 oC (111.1500K) will liquefy methane while nitrogen still remains gaseous.
Subsequently, the stream is cooled to -196 oC (77.1500K) or -200oC (73.15000K) to liquefy nitrogen. By fractional distillation (or fractionation), the overall extracted flue gas liquids are separated into individual components.
![Figure 25: Phase diagram pattern for water (H2O), methane (CH4) and nitrogen (N2) [61].](/fulltextimages/10352/fig_25.png)
Gas Liquefaction Concept
The fundamental gas laws by Robert Boyle (1627- 1691), Jacques A Charles (1746-1823), Joseph L Gay- Lussac (1778-1850) and Amadeo Avogadro (1776-1856) started with observed temperature and pressure relation with air experiments [62, 63]. There finding was used on a hypothetical fluid known as an ideal gas to develop the equation of state for an ideal gas (pV=nRT), where p is absolute pressure in psia, V is volume in cubic feet, T is absolute temperature in oR, n is number of lb-moles and R is the universal gas constant (10.732 psia ft3/ lb-mole oR). The ideal gas describes the behavior of most real/actual gases at temperature and pressure conditions close to atmospheric (14.7 psia) [63]. At moderate pressures real gas tends to compress more than the ideal gas law indicates (super-compressible), particularly for temperatures close to the critical temperature. At high pressure the gas tends to compress less than the ideal gas law predicts. To correct for the deviation between the measured or observed volume and that calculated using the ideal gas law, an empirical factor Z, called the gas deviation factor or the Z-factor, is used. Z is the ratio of the actual volume of n moles of gas and the ideal (calculated) volume of n moles of gas at the same Pressure and Temperature. The real gas equation of state becomes (pV=ZnRT). Z is dimensionless and is approximately one (Z ≈1) at atmospheric pressure. Subsequent investigations, between 1961 to 1963, by Thomas Andrews, on liquefaction of real gases such as carbon dioxide, oxygen, nitrogen, helium and hydrogen, revealed that at room temperature they cannot be liquefied by application of pressure alone, rather it requires the combined effect of first cooling (down to or below a particular temperature ‘critical temperature’) and then, the application of pressure [64]. Each gas has a critical temperature above which it cannot be liquefied however high pressure may be applied on it. The critical temperature for oxygen (-181.1oF or -118oC)), nitrogen (-232.4oF or -147oC)), methane (-116.7oF or -82.3oC), etc.
On the other hand, any gas which has a critical temperature above room temperature can be liquefied by pressure alone e.g. ammonia (270.3oF or 132.4oC), chlorine (291oF or 144.0oC), carbon dioxide (87.9oF or 31.1oC), hydrogen chloride (124.5oF or 51.4oC), hydrogen sulfide (212.7oF or 100.4oC) and hydrogen dioxide (315.5oF or 157.5oC), water/steam (705oF or 374oC), etc.
Precisely, the liquefaction of gas takes place when the intermolecular forces of attraction become so high that they bind the gas molecules together to form the liquid state [64]. The intermolecular forces of attraction can be increased either by increasing the pressure so that the molecules come close together or by cooling the gas so that the kinetic energy of the molecules decreases and they become slower.
The two categories of gas liquefaction processes are the transitional and permanent gas liquefaction processes:
a) Transitional gas liquefaction processes in which, under specified temperature and pressure, the volume of the gas is drastically reduced for transportation convenience. In this case, the liquefied gas reverts to gaseous state at the point of use. The methods for liquefying gas with this approach are:
- Compression and external cooling [61], in which compression of the gas causes evolution of heat due to work done on the gas, and this heat of compression is removed by external cooling. An example is the stage mechanical refrigeration i.e. ‘cascade cycle’.
- Cooling by performance of external work [61], which involves compression, cooling and subsequent adiabatic expansion (in which heat is neither gained nor lost externally). An example is the use of expander cycle i.e. the turbo-expander cycle.
- Joule-thomson effect [61], which involves compression, cooling and subsequent expansion by passing it through a fine aperture (joule-thomson expansion valve) for further cooling.
b) Permanent gas liquefaction processes in which chemical transformation of the gas molecules occur simultaneously with super drastic volume reduction, such as the gas-to- liquid (GTL) i.e. to clean synthetic fuels (e.g. gasoline, diesel, kerosene etc) and green chemicals {e.g. methanol, ammonia, dimethylether (DME), etc} from gas. The overall reaction mechanism of the processes is based on the formation of radicals and radical’s polymerization or hybridization using highly selectivity catalyst, targeted at specific end products i.e. radical couplings (combination) to form a new covalent bond.
The various reaction mechanism for the direct GTL routes (production processes) presently being explored involves:
- The conversion of a pressurized mixture of methane gas and oxygen gas at moderate temperatures.
- The catalytic coupling (oxidative coupling) of methane gas and an oxidant in the presence of a catalyst at moderate temperatures.
- The catalytic reaction of methane gas with a mixture of hydrogen chloride and oxygen gas.
- Indirect oxidation of methane gas to ethylene liquid at high temperatures.
- Contacting methane gas with a catalyst at a relatively high temperature to form ethylene liquid [65].
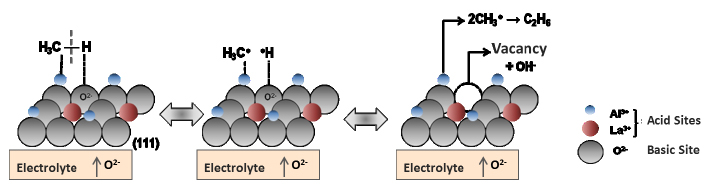
- chemical oxidative coupling of methane i.e. methane electrochemical oxidative coupling [66], in which ethylene can be generated using either the chemical oxidative coupling of methane. CH4 + 1/2 O2 → 1/2 C2H4 + H2O or the methane electrochemical oxidative coupling, in which solid oxide fuel cell (SOFC) reactor is used for the direct conversion of methane gas into C2 type hydrocarbons liquids via methyl radicals (CH3 * ), which couples to C2H6 and further dehydrogenated to C2H4, figure 26. On the other hand, figure 27 illustrates the hydrogenation of C2H4 to C2H6 i.e. the four steps in the catalytic reaction of C2H4+H2⟶C2H6 by nickel.
![Figure 27: The four steps in the catalysis of the reaction C2H4+H2⟶C2H6 by nickel [67].](/fulltextimages/10352/fig_27.png)
Precisely (a) Hydrogen is adsorbed on the surface, breaking the H–H bonds and forming Ni–H bonds. (b) Ethylene is adsorbed on the surface, breaking the π-bond and forming Ni–C bonds. (c) Atoms diffuse across the surface and form new C–H bonds when they collide. (d) C2H6 molecules escape from the nickel surface, since they are not strongly attracted to nickel.
Figure 28 shows the different volume reduction of natural gas (methane) by the various techniques for easy of transportation: compressed natural gas (CNG) - is achieved by volume reduction 200-250:1; liquefied natural gas (LNG) is achieved by volume reduction 600-625:1; and natural gas to liquid (GTL) is achieved by volume reduction 1781: 1 [68, 69]. Similarly, Liquid oxygen has an expansion ratio of 1:858 under standard pressure and temperature (100 kPa or 14.7 psia) and 20 °C (68 °F), etc. [70].
![Figure 28: Reduction in volume on Liquefaction for various gases [68-70].](/fulltextimages/10352/fig_28.png)
(a) Illustrative image not to scale
![Figure 29: The conventional techniques for capturing or separating the individual components of any gaseous mixture [72].](/fulltextimages/10352/fig_29.png)
(b) Figure 28: Reduction in volume on Liquefaction for various gases [68, 69, 70].
The compressed natural gas (CNG) and liquefied natural gas (LNG) are gas-to -gas (GTG) options to bring gas to market, which take advantage of the reduction in volume of the gas to economically transport the gas [65]. That is, it is still gaseous methane compressed or chilled at -162oC (-259oF), and it returns to gaseous phase if allowed to warm up to ambient condition.
On the other hand, the GTL process chemically converts methane molecules into other liquid compounds. Once converted, these liquids are stable and will remain in the liquid state. The chemical conversion involves control of pressure, temperature and the composition of the system in order to obtain the right kind of liquid [71].
Physical Mechanisms Of The Gas Capturing Techniques
The matured standard techniques for capturing or separating the individual components of any gaseous mixture, such as the atmospheric air {composed of nitrogen (N2), oxygen (O2), carbon dioxide (CO2), etc.}, flared natural gas stream {composed of methane (CH4), ethane (C2H6), propane (C3H8), butanes (C4H10), etc.} and industry process/ power plants flue gas {composed of carbon dioxide (CO2), water/steam-H2O (g), nitrogen (N2), oxygen (O2) etc.} are liquid absorption, solid adsorption, membrane separation (with or without solvent- organic and inorganic), cryogenic refrigeration/distillation, and electrochemical separation or their combination (Figure 29).
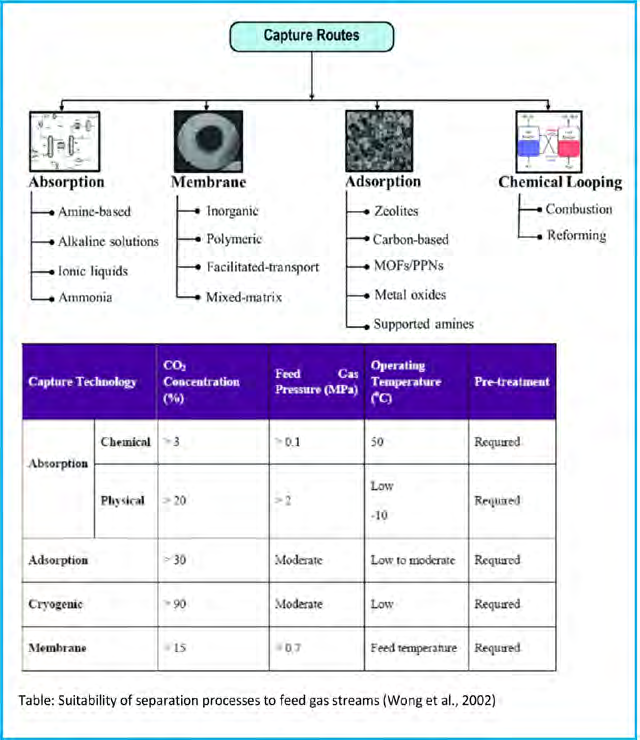
Absorption and Adsorption Technology
Definitively, absorption is the process in which a fluid (gas or liquid) is dissolved by a liquid or a solid (absorbent) i.e. penetrates into absorbing agent. While adsorption is the process in which atoms, ions or molecules from a substance (it could be gas, liquid or dissolved solid) accumulate/ adhere to a surface of the adsorbent due to chemical or physical attraction. Hence, adsorption is a surface-based process where a film of adsorbate is created on the surface while absorption involves the entire volume of the absorbing substance, figure 30. In the general process scheme the sorbent loaded with the captured (e.g. CO2 or N2 or O2) is transported to a different vessel, where it releases the (e.g. CO2 or N2 or O2- regeneration) after being heated, or after a pressure decrease or after any other change in the conditions around the sorbent. The sorbent resulting after the regeneration step is sent back to capture more (e.g. CO2 or N2 or O2) in a cyclic process.
![Figure 31: Illustration of the membrane gas separation process [77-79].](/fulltextimages/10352/fig_31.png)
Membrane Technology
Figure 31 depicts the membrane technology (membrane separation a.k.a. membrane gas absorption or membrane gas separation) which definitively, allows the separation of different species in a fluid (liquid or gas) stream i.e. selectively allow certain species to pass, while retaining others. Basically, membranes are specially manufactured porous materials that selectively filter out gases through differences in permeability at a more microscopic level. Usually, the gas molecules permeate according to their size, diffusivity, or solubility through the membrane. Membranes can separate gases through a variety of mechanisms including solution-diffusion transport, molecular sieving, and Knudsen diffusion. For instance, in the solution-diffusion transport mechanism, the “desired gas component” first dissolves into the membrane and then diffuses across. A membrane can be used with a solvent to capture the gas (the “desired gas component” diffuses between the pores in the membrane and is then absorbed by the solvent). The membrane maintains the surface area between gas and liquid phases (i.e. maintains a barrier between the liquid and gas phases-figure 31c). Ideally, a driving force must be applied to membranes to cause one species to permeate the membrane. This driving force is often a pressure, heat, or concentration gradient, depending on the membrane process that is implemented. For instance, the pressure-driven separation processes work through pressure-facilitated filtration (i.e., the process is driven by partial pressure difference of the gas molecules to be separated).
Put in simple terms, the porous membrane allows gases to come into contact with the solvent. Only the target gas (e.g. CO2 or N2 or O2) is absorbed because of the selectivity of the solvent. The membrane itself does not separate the (e.g. CO2 or N2 or O2) from other gases, but rather maintains a barrier between the liquid and gas with permeability through the pores, such that only the target component can permeate/penetrate through it.
![Figure 32: The main working parts of the conventional refrigeration system [81].](/fulltextimages/10352/fig_32.png)
Conventional Refrigeration and Cryogenics Refrigeration Technologies
The term refrigeration denotes cooling (artificial or human-made) of a space, substance or system to lower and/ or maintain its temperature below the ambient one (while the removed heat is rejected at a higher temperature). Put in simple terms, refrigeration refers to the process by which energy, in the form of heat, is removed from a low- temperature medium and transferred to a high-temperature medium. In a conventional refrigeration system, the main working parts are the evaporator, condenser, and compressor, (figure 32). The evaporator surface is where the liquid refrigerant boils, changes to vapor, and absorbs heat energy. It’s applications, includes household refrigerators, industrial freezers, cryogenics, and air conditioning. Similarly, heat pumps may use the heat output of the refrigeration process, and also may be designed to be reversible, but are otherwise similar to air conditioning units.
Cryogenics is the branches of engineering that involve the study of very low temperatures {ultra low temperature i.e. below -153oC (120K; -243.4oF)}, how to produce them, and how materials behave at those temperatures, to distinguish these terms from the conventional refrigeration, aimed to stay between 35° and 38°F (or 1.7 to 3.3°C). This is a logical dividing line, since the normal boiling points of the so-called permanent gases (such as helium, hydrogen, neon, nitrogen, oxygen, and normal air) lie below -153oC (120K; -243.4oF), while the Freon refrigerants, hydrocarbons, and other common refrigerants have boiling points above -153oC (120K; -243.4oF). The term “high temperature cryogenic” describes temperatures ranging from above the boiling point of liquid nitrogen, −195.79 °C (77.36 K; −320.42 °F), up to −50 °C (223 K; −58 °F) [80]. Put simply, cryogenic implies the use of very low temperature for separations.
![Figure 33: The typical configurations of the two stage and three stage cascade systems [81-85].](/fulltextimages/10352/fig_33.png)
Fundamentally, almost all the refrigeration systems used commercially and domestically has similar principle of operation. They conduct refrigeration by vapor compression cycle. However in some cases, especially for a gas stream it is more effective to use an advanced configuration (i.e. Refrigeration setup) called Cascade Refrigeration System (“CRS”-also referred to as cascading), which uses multiple refrigeration cycles coupled with each other via heat exchanger. Each refrigeration cycle is called stage and consists of its own refrigerant, with different boiling points, freezing points and critical pressures; depending on the lowest temperature that has to be achieved and refrigeration effect required at evaporation coil (hence refrigeration from all these systems is combined). Very low temperatures can be achieved by operating two or more vapor-compression systems in series, which broadens the refrigeration temperature range of conventional systems (i.e. achieve an evaporating temperature as low as −170 °C and beyond). The goal of adding another stage is to get even lower temperature.
![Figure 34: Input and metrics of electrochemical pH-swing based CO2 capture and the overall process concept [86].](/fulltextimages/10352/fig_34.png)
Figure 33 shows the typical configurations of the two stage cascade system and three stage cascade system; and simulated three discrete temperatures ranges cooling for natural gas feed. The overall refrigeration technology fall into two categories (a) single-stage refrigeration system with two options (i) the traditional single-stage compression refrigeration system (STCRS) and (ii) the traditional single- stage absorption refrigeration system (STARS); (b) cryogenic cascade refrigeration system with five options (i) the two or more-stage vapor compression cascade refrigeration system {“CCRS” e.g. comprised of two STCRSs, consisting of two circuits—high-temperature cycle (HTC) and low- temperature cycle (LTC), figure 33 “a”; (ii) the two or more- stage cascade absorption refrigeration system {“CARS” e.g. comprised of two STARSs that can operate with two different refrigerants passing through one heat exchanger a.k.a. mixed refrigerants}; (iii) the compression–absorption cascade refrigeration system {“CACRS” consists of a STCRS and a STARS, which are cascaded by a heat exchanger- driven by heat and power}; (iv) the absorption cascade refrigeration system {“ACRS” which realizes cascade between high and low boiling point components by an evaporative condenser} and (v) Cryogenic distillation comprising series of compression, cooling and expansion steps.
Electrochemical Gas-Capture Technologies
“In electrochemical systems, the electric potential gradient is the main driving force which can be controlled precisely to drive chemical reactions isothermally. The process can be applied electrochemically through electrolysis, bipolar membrane electro dialysis (BPMED), reversible redox reactions (couples), capacitive deionization and hybrid processes that combine two or more methods”. They do not require external sources of heat or high pressures/vacuum for operation, and no degradation of sorbent material is expected. Operationally (figure 34), it utilizes the “pH- swing” concept i.e. capturing and recovering different gases by shifting the pH of a working fluid (continuously) between acidic and basic pH to influence the target gas (e.g. CO2 or N2 or O2) equilibrium to capture and recover the target gas (e.g. CO2 or N2 or O2). Precisely, “the pH-swing allows absorption and desorption at ambient temperature and does not require use of any special chemicals. Rather, inexpensive, non-toxic/ non corrosive/nonvolatile salt solutions, such as NaCl, KCl, KHCO3 or even seawater can be used for the process”.
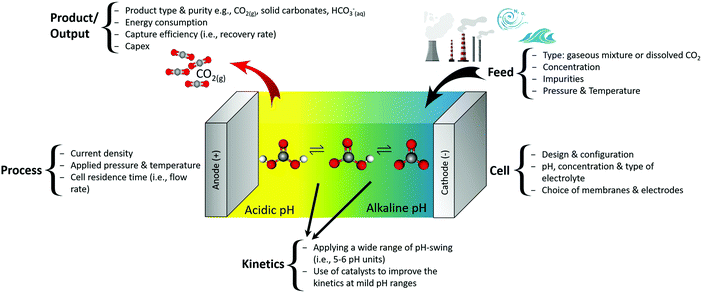
The most recent research development across the globe is the deployment of interfacial ionic liquid catalyst in all the conventional mixed gas stream separation techniques. In essence, the process captures the target component in the stream and simultaneously converts/synthesizes it (via hydrogenation, oxidation, etc.) into one or more valuable chemical compounds or energy chemicals in real- time depending on the preferred catalytic absorbents and chemical reagents (both metal-based homogeneous catalysts and heterogeneous catalysts) used. Typical resulting products include formic acid (HCOOH), methanol (MeOH or CH3OH), Ammonia (NH3), Hydrazine (N2H4), hydrogen peroxide (H2O2), water (H2O), etc. figure 35. In fact, the scientists were able to convert a mixture of hydrogen and carbon dioxide in the ratio 1:1 to make formic acid at room temperature. The multimetallic catalytic site nitrogenase (FeMoco) allows the efficient transformation of N2 into NH3 under ambient temperature and pressure conditions. While the oxygen reduction reaction (ORR), was used for the production of H2O2, H2O and in methane oxidation. These processes combine the component capture and conversion steps in a single chemical assembly, thereby making it a quicker “one-pot” process.
![Figure 36: The developmental stages for the CO2 capture and processing to end products [93-95].](/fulltextimages/10352/fig_36.png)
Notably, at the onset, CO2 capture was aimed at “carbon capture and storage/sequestration (CCS)”, figure 36 “a”, subsequently, emphasis was shifted to “carbon capture and recycling (CCR) a.k.a. carbon capture and utilization (CCU) strategy” whereby the captured CO2 is used as a non-toxic, abundant, and sustainable feedstock to produce valuable organic compounds/fuels (isocyanates, carbamates, ureas, oxazolidinones, etc.) via chemical, electrochemical or photochemical reactions, figure 36 “b”. This shows that the CO2 from the atmosphere or industrial exhaust can be used as C1 source directly for energy chemicals, based on its pure or high pressure fulfillment. The emergence of efficient absorbents resulted to the development of real- time transformation/conversion into value-added organic chemicals/products which has revolutionized the (CCU). Simply put, according to researchers at University, Tianjin, China “organic and inorganic bases, N-heterocyclic carbenes (NHCs) and N-heterocyclic olefins (NHOs), ionic liquids (ILs)
and frustrated Lewis pairs (FLPs) have already been applied to CO2 capture and in situ conversion. A plethora of valuable organic chemicals have been obtained through the novel CCU strategy as shown in Figure 36 “c”.
![Figure 37: The six American Society for Testing and Materials (ASTM) approved methods of creating SAF [98, 99].](/fulltextimages/10352/fig_37.png)
Automobiles Transportation Systems Co2 Gas Emissions Reduction Trend
Presently, automobiles and other machines that use internal combustion engines, mostly consume gasoline, diesel, kerosene/jet fuel, marine fuel oil etc. derived from fossil energy resources or biomass energy resources in form of either conventional fuels or synthetic fuels. At the onset, the main exhaust effluent products and their effects on the environment and human health are:
- Nitrogen (N2), Oxygen (O2) and Water (H2O): no adverse effects.
- Carbon Dioxide (CO2): non-toxic but contributes towards acidification of our oceans and one of the most important greenhouse gases that contributes to global warming.
- Carbon Monoxide (CO): reduces the ability of blood to carry oxygen and can cause headaches, respiratory problems and, at high concentrations, even death.
- Nitrogen Oxides (NOx): contribute to acid rain and react with hydrocarbons to produce low level ozone which can cause inflammation of the airways, reduced lung function and trigger asthma, as well as the formation of particulate matter.
- Sulphur Dioxide (SO2): contribute to acid rain and engine corrosion, as well as the formation of particulate matter.
- Hydrocarbons (HC): HCs are emitted from vehicle exhausts as un-burnt fuel and also through evaporation from the fuel tank, from the nozzle when you fill up and also at stages through the fuel supply chain. They react with NOx in sunlight to produce photochemical oxidants (including ozone), which cause breathing problems and increased symptoms in those with asthma.
- Benzene (C6H6): occurs naturally in small quantities (less than 2%) in petrol and diesel. Benzene is emitted from vehicle exhausts as un-burnt fuel and also through evaporation from the fuel system although modern fuel systems are sealed and have carbon canisters to hold the vapors. Benzene is toxic and carcinogenic and long-term exposure has been linked with leukemia.
- Particulate matter (PM) or soot – particulate matter is partly burned fuel associated mainly with diesel engines and is also formed by the reaction between other pollutants. Smaller particles can pass deep into your lungs causing respiratory complaints and contributing to the risk of developing cardiovascular diseases. Modern diesel cars are fitted with Diesel Particulate Filters (DPF) to stop these particles passing into the atmosphere.
The variety of systems for controlling emissions from the exhaust pipe of internal combustion engines developed from 1961–1975 {i.e. positive crankcase ventilation (PCV) valve; exhaust gas recirculation (EGR) system; replacement of carburetor with fuel injector-to adjust air-fuel ratios; catalytic converters (Cat-Con) devices; and particulate matter and black smoke removal device} reduced the effluent products to only water vapor, carbon dioxide, oxygen and nitrogen in an ideal situation. Most modern, three-way catalytic converters possess a surface impregnated with a platinum-rhodium catalyst, which converts nitric oxide into dinitrogen and oxygen, as well as converts carbon monoxide into carbon dioxide and hydrocarbons such as octane into carbon dioxide and water vapor. In simply terms, one step involves removing the oxygen from the molecule (eqn. A), and the other involves adding more oxygen to the molecule (eqns. B and C):
2NO2 (g) ⟶ N2 (g) +2O2 (g) ………. (Equation A) 2CO (g) + O2 (g) ⟶ 2CO2 (g) ………. (Equation B) 2C8H18 (g) +25O2 (g) ⟶16CO2 (g) + 18H2O (g) ………. (Equation C)
![Figure 38: Presents schematics of creating conventional jet fuel, sustainable aviation fuel, power-to-fuels or electro-fuels and the Synfuels petroleum refinery options [100-103,52].](/fulltextimages/10352/fig_38.png)
Since then the focus has been on reducing CO2 emissions via the advanced vehicle technologies which includes battery- powered electric vehicles EVs; plug-in hybrid electric vehicles (gasoline-electric); hydrogen fuel cells vehicles (powered with electricity supply to an electric motor); flexible-fuel vehicles or FlexFuel vehicles (FFVs)- E10-E85 gasohol to E100 ethanol fuel, i.e. vehicles/cars that may run on any gasoline and ethanol fuel blended/combination, from 100 percent hydrated ethanol to 100 percent gasoline e.g. E10 bio-fuel, E18, E20, E25, E85, E100 (an azeotrope composed of 95.6% ethanol and 4.4% water); the Solar-powered electric vehicles and the sustainable aviation fuel (SAF) a.k.a. bio-aviation fuel (BAF) or bio-jet-fuel, which is an ultra-low-carbon fuel that serve as alternative to the fossil fuels traditionally used by airlines (i.e. cleaner alternative to power aircraft). To date, the best result is the sustainable aviation fuel (SAF) blends, which is capable of reducing aviation carbon dioxide emissions by up to 80% in comparison to using conventional fossil-based jet fuels.
Currently there are six approved methods of creating SAF which are known as production pathways (figure 37) according to the American Society for Testing and Materials (ASTM) International Certification. Furthermore, researchers at NRL identified that methanogenesis during anaerobic digestion can be arrested during fermentation to instead produce C2 to C8 volatile fatty acids (VFA) for catalytic upgrading to SAF. Figure 37 “b” shows the “Overview scheme of the major oxygenate and hydrocarbon molecules produced when converting wet waste VFA into Fast Track VFA-SAF that is composed of normal paraffin-rich hydrocarbons (Top Right) and Aldol Condensation VFA-SAF composed of isoparaffin-rich hydrocarbons (Bottom Right)”. It qualifies for near-term use as a 10 vol% blend for ASTM “Fast Track” highly branched, isoparaffin VFA-SAF to increase the renewable blend limit [96, 97, 98].
In addition to the certified sustainable fuels, power to liquid (PtL) fuels a.k.a. power-to-fuels or electro-fuels or e-fuels or electricity to fuels (synthetic fuels), figure 38a-d, can be used as an alternative. PtL uses renewable electricity (such as solar, wind, or hydro power), carbon dioxide captured from air and water to form a sustainable fuel that chemically resembles conventional jet fuel. PtL has its advantages over SAF. It is “drop-in” capable, uses renewable feedstock and does not require as much land compared to other types of SAF [98]. Also included in this category is the “Sun-to-Liquid” (solar fuels) produced with solar heat -that drives a thermo-chemical reactor to converts carbon dioxide and water into syngas. The solar heat generated during the day can be stored by inexpensive thermal energy storage (e.g. molten salt storage) to enable round-the-clock production of fuels. Storage makes solar fuel plants self-sufficient and independent from any grid, giving them the potential to be scaled quickly and broadly.
![Figure 39: The components of the conventional internal combustion vehicle, the battery-powered electric vehicle EV and the plug-in hybrid electric vehicle [104,105].](/fulltextimages/10352/fig_39.png)
The CO2 can come from many sources including various industrial processes giving rise to excess CO2 , e.g. bio-fuel production facilities, natural gas processing, flue gases from fossil and biomass combustion plants, steel plants, oil refineries and other chemical plants, geothermal activity, the off-gases from ammonia plants have very high CO2 concentrations (some up to 100%). As well as from the clean petroleum refinery a.k.a. Synfuels petroleum refinery concept, (courtesy of Azuberths research complex Owerri, Nigeria- figure 38 “e”), considering the very high volume of CO2 extractable from reforming the conventional crude oil refinery products. And possibly from air and seawater, but based on the low concentration of CO2 in air (0.04), extraction of CO2 from water could be more feasible due to its higher concentrations in dissolved form.
![Figure 40: The features in the hydrogen fuel cells vehicles [106].](/fulltextimages/10352/fig_40.png)
Figures 39-41 represents the typical configurations of the various models of advanced vehicles technologies: Figure 39a-depicts the components of the conventional internal combustion vehicle models. Which is also compliant to all the categories of F-T synthetic fuels i.e. electro-fuels, solar fuels, bio-fuels and the reformed petroleum Synfuels. Figure 39b-depicts the components of the battery-powered electric vehicles EVs and the plug-in hybrid electric vehicles (gasoline-electric), placed side-by-side.
![Figure 41: Solar-powered electric vehicles and solar collector areas for recharging [107-115].](/fulltextimages/10352/fig_41.png)
![Figure 42: Schematic showing the components of a CHAMP cylinder-piston assembly [116-120].](/fulltextimages/10352/fig_42.png)
Figure 40a-illustrates the features in the hydrogen fuel cells vehicles (powered with electricity supply to an electric motor). Figure 40b- illustrates the features in the flexible-fuel vehicles or FlexFuel vehicles (FFVs) - vehicles that may run on any gasoline and ethanol fuel blended/combination, from 100 percent hydrated ethanol to 100 percent gasoline. Figure 41-shows the different models of the solar-powered electric automobiles.
Further proposed development on the advanced vehicle technology (as revealed by researchers at the Georgia Institute of Technology in 2009) is the concept of using an onboard fossil fuel closed-loop cycle processor. In this case, liquid hydrocarbon fossil fuel is synthesized with water/ steam via variable volume catalytic reaction to separate/ isolate it into hydrogen and carbon dioxide {e.g. CH4 + 2H2O ⟶ CO2 + 4H2 and C6H14 + 6H2O ⟶ 6CO2 + 13H2}.The hydrogen is used to power the engine with zero emissions, while the carbon dioxide would be captured in liquid form, stored on board, to be disposed-off at a refueling station. It is called the “CO2/H2 Active Membrane Piston (CHAMP)” reactor and it uses the four-stroke engine cycle to create hydrogen while simultaneously capturing carbon dioxide emission, figure 42.
![Figure 43: The comprehensive Aramco CO2 capture from the automobile exhaust gases approaches [121-123].](/fulltextimages/10352/fig_43.png)
Evolving CO2 Capture from Exhaust Automobile Engine Techniques
Despite all the improvements, estimates reveal that much greenhouse gases are still being released into the atmosphere from burning fossil in internal combustion engines, due to increasing industrialization, automobiles, power plants, etc. Hence, the compelling pressure to develop very low- and zero-emission automobiles or the immediate cease to the use of fossil fuels (petroleum i.e. oil and gas, coal) as well as the quest for alternative/renewable energy. So far, for the solution towards the drive to zero emissions from the automobile engine, the two research establishments that are making attempts to capture CO2 from the exhaust effluent pipeline are (i) Researchers for Aramco (the state-owned oil company) in Saudi Arabia through their mobile carbon capture (MCC) process and (ii) Researchers from École Polytechnique Fédéralede Lausanne (EPFL) in Switzerland.
(a) Figure 43 shows the Aramco contribution which works by taking the exhaust gases and bringing them into contact with a solvent to capture the CO2, compress and store it safely in a tank on board the vehicle (so that they can be removed and dumped at a station the next time the car is refueled), emitting nitrogen, water vapor, and any remaining CO2. They began in 2010, by exploring different approaches to capturing CO2, including: liquid absorption, solid sorbents, cryogenic, membranes and oxy-combustion. However, in 2011, they used solid sorbent in their feasibility prototype and successfully integrated it into a Ford F-250 pickup truck, capturing 10% of the CO2 emissions. Subsequently, in 2013, they switched to a liquid solvent (potassium carbonate solution), shrinking the whole system to just 1/8 of its original size, and successfully integrated it underneath the chassis of a Toyota Camry, capturing 30% of the CO2 emissions while the car was being driven. Furthermore, in 2019 they developed a novel solvent system based on amino acids, and used turbo-compounding to recover energy from the engine. They integrated it into a class 8 Volvo heavy-duty truck (between the cab and trailer), capturing 40% of the CO2 emissions-their best to date. Presently, they are exploring ways to adapt the technology for deployment on large ships.
![Figure 44: The typical large-scale direct air capture plants modular system by Carbon Engineering USA and Climeworks in Switzerland [28, 29].](/fulltextimages/10352/fig_44.png)
(b) Concurrently, in Switzerland, a team of researchers from École Polytechnique Fédéralede Lausanne (EPFL) has proposed a concept with prototypes in the works for capturing carbon emissions from exhaust pipes of any existing vehicle and reduces its emissions by 90%!
The device cools the vehicle’s exhaust gases, separate water from the gases, and then isolate and captures the CO2 from the nitrogen and oxygen with a temperature swing absorption system, which uses frameworks designed at EPFL. Once the system is full of CO2, it is heated (using heat from the vehicle’s engines) to extract pure CO2, which is then compressed into a liquid (using a turbo-compressor system), stored in a tank on the roof and transported to a service station, where the liquid is simply deposits when filling up with fuel. The weight of the capsule (within which the process takes place before the CO2 can be stored) and tank are only 7% of the vehicle’s payload [124].
Large Scale Atmospheric and Small Scale Industrial CO2 Gas Capturing Devices
On the other hand, considering the fact that, direct air capture technology is very much part of a portfolio of solutions, many other commercial operators are using different techniques to capture atmospheric CO2 on large scale bases as well as for capturing CO2 waste from smaller sources such as businesses, homes etc., in compact plug- n-play modular skids, sized to meet the gas processing requirements of each client.
(a) Figure 44 shows the massive structures that captures carbon dioxide directly from the atmosphere air {by Carbon Engineering USA, figure 44 “a” and Climeworks in Switzerland
and Iceland, figure 44 “b”}. The large-scale direct air capture plants are based on a modular system of CO2 collectors. These collectors, each the size of a small car, can be stacked in any number of configurations to create a plant of any size that extracts CO2 from ambient air. Their individual facilities can go to megaton scales—million tons of CO2 captured per year (by addition of units). According to Geoff Holmes of Carbon Engineering, “That’s capturing and purifying the quantity of emissions released by 250,000 cars”. And figure 44 “c” is the newly proposed artificial photosynthesis technology (APT) concept.
![Figure 45: Process Chemistry and Thermodynamics of the large-scale DAC techniques [28].](/fulltextimages/10352/fig_45.png)
Figure 45 illustrates their direct ambient air Carbon Dioxide (CO2) capturing process. Precisely, in (a) an aqueous solution of Potassium Hydroxide (KOH) captures CO2 to form liquid Potassium Carbonate (K2CO3) and water (H2O). Next, the Potassium Carbonate (K2CO3) reacts with Calcium Hydroxide {Ca (OH) 2} to form Calcium Carbonate (CaCO3). Subsequently, the Calcium Carbonate (CaCO3) is heated at high temperatures in absence of air or oxygen to release pure CO2, while the remaining Calcium Oxide (CaO) is hydrated with water to create Calcium Hydroxide for the re-cycling operation. This circular process allows for continuous operation of the plant.
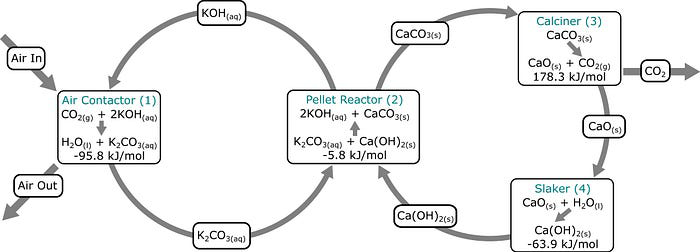
(b) Earthly Labs Technology solution with different size models in modular skids, sized to meet the gas processing requirements of each client (even for very low pressures and flow rates mixed gas waste stream), such as CiCi ® (Oak); CiCi ® (Elm) and CiCi ® (Teak). The CiCi’s patented purification technology (approximately the size of a double door refrigerator), captures and convert CO2 to beverage grade quality (99.9% pure CO2), through a three step process: drying the gas to remove moisture, scrubbing the gas to remove volatile organic compounds (VOCs) and other impurities, and chilling the gas to below -34.7 °C to convert gas to a liquid. The “CiCi ® CO2 emissions monitoring and reporting software controls gas processing, while providing real-time alerts so customers can let unit run 24x7 unmanned. The remote dashboard also allows the team to track via mobile phones or desktops, running reports off-line and assessing CO2 capture volumes” i.e. to troubleshoot or offer proactive feedback to maximize CO2 capture. For businesses, the application significantly reduces costs and creates a new revenue stream. Typical example of companies that are using the Earthly Labs CO2 recovery solution (CiCi) are Austin Beerworks and Alchemist Brewery, which captures CO2 from the fermentation process that was previously released to atmosphere, stores and re-use it in their carbonating and packaging processes [125, 126].
(c) Sustainable Energy Solutions (SES) Cryogenic Carbon Capture (CCC) technology: Is an integrated solution for high purity (99%), CO2 capturing across a variety of end-use applications. It is targeted at capturing CO2 in solid form instead of the more common approach i.e. compressed gas or liquefied. “Carbon dioxide is frozen out from the exhaust gases and subsequently the solids are separated from the gases. As well as removing >98% of the CO2 CCC also removes Nox, Sox and other pollutants from exhaust gases” [31].
(d) Furthermore, researchers at Ulsan National Institute of Science and Technology (UNIST) and Georgia Tech have developed a new system that absorbs CO2 directly from business emitters and produces electricity and useable hydrogen fuel, figure 46. Precisely, “When CO2 is injected into the aqueous electrolyte, it reacts with the cathode, turning the solution more acidic, which in turn generates electricity and creates hydrogen. In tests, the team reported a CO2 conversion efficiency of 50 percent, and the system was stable enough to run for over 1,000 hours without causing any damage to the electrodes. Unlike other designs, it doesn’t release any CO2 as a gas during normal operation – instead, the remaining half of the CO2 was recovered from the electrolyte as plain old baking soda” a.k.a. bicarbonate of soda, a chemical compound with the formula NaHCO3 {Sodium bicarbonate (IUPAC name: sodium hydrogencarbonate)}. It is a salt composed of a sodium cation (Na+) and a bicarbonate anion (HCO3 -). Sodium bicarbonate is a white solid that is crystalline, but often appears as a fine powder. It has a slightly salty, alkaline taste resembling that of washing soda (sodium carbonate).
![Figure 47: Schematic illustration of carbon emissions, capture, and storage. Metal–Organic Frameworks (MOFs) is one of diverse groups of materials that are used for carbon capture process [128].](/fulltextimages/10352/fig_47.png)
(e) Applying the Artists impression of a Solar Tower: In a CO2 collecting tower an amine solution would be pumped up to the top of the tower and allowed to fall from the top to be collected at the bottom. As the rising air stream passes over the falling amine stream, CO2 is absorbed from the air by the solution which is then collected at the bottom, heated to release the CO2 and then pumped up to the top of tower again. As it does not interfere with the power generation capabilities of the tower it is possible that CO2 absorbers could be retro- fitted to existing Power Towers. This could reduce the cost of implementing the reduction of CO2 concentration in the air by using existing structures.
Figure 47 reflects the sequence of events which highlights some possible sources of CO2 emissions, the various techniques to capture CO2 from atmosphere and storage options.
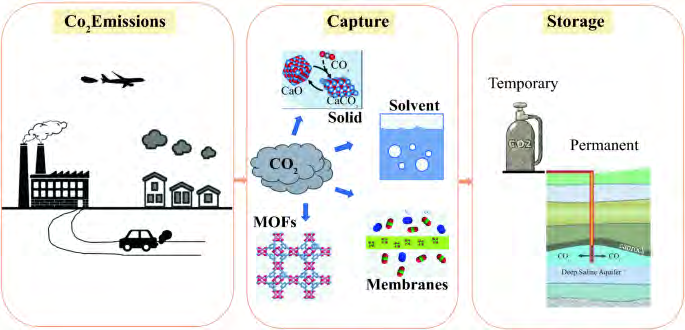
IJN- Universal Plug and Play Exhaust Effluent Gas Liquefiers Devices
In contrast to all the above proposed approaches that attempts to capture fraction of the emissions directly from the automotive exhaust effluents, this innovative article is targeted at zero emissions i.e. eliminating carbon dioxide (CO2) and other components emissions from the transport, power generation sector, process plants, etc. The growing demand for carbon energy as a resource coupled with the current agriculture techniques (which results to net global deforestation), implies that more CO2 will continue to be emitted from automotive exhaust and industrial processing plants, hence need for its elimination from source.
The proposed IJN-universal automotive exhaust effluents liquefiers a.k.a. IJN-universal industry vents liquefiers a.k.a. IJN-universal flue gas emissions liquefiers (courtesy Azuberths Research Complex, Owerri, Nigeria), are plug-n- play (compact in-box) units for all categories of pollutants discharge into the atmosphere. They are adaptable to exhaust pipe effluents of all types of internal combustion engines including motor cycles, tri-cycles, cars/vehicles, SUV’s, long distance cargo trucks, boats/ships, trains, airplanes and jet planes, portable electric generators, power plants, etc. as well as the effluents from the scrubbers of industrial processing plants and the emission channels of the electronic big tech companies. The units are made in different sizes, depending on the anticipated fuel consumption rate i.e.
quantity/volume of the effluent discharge. Also, the liquid products storage containers varies in size (i.e. 0.5 liter to 1.0 liter for motor cycles and tri-cycles; 1.0 liter to 5.0 liter for cars/vehicles and SUV’s; 5.0 liter to 10.0 liter for trucks and vans; 10.0 liter to 20.0 liter for ships, trains, airplanes and jet planes; 20.0 liter to 100.0 liter for mega processing plants, refineries, petroleum industry flare lines, etc.). It is possible to predict the quantity of fuel (gasoline or diesel-1,000 liters to over 500,000 liters) that will be consumed to generate/ fill a one liter or two liter liquid CO2 which settles in the collecting container in an automobile engine whether idle or cruising, using the ppm fraction. Therefore, depending on the particular gas component settling in the container (steam/H2O, CO2, N2, O2, CH4, C2H4, etc.), it might take weeks, months or years before the storage container will be due for replacement or discharge, based on the gas to permanent liquid volume reduction ratio of 1781: 1 for CH4, 858:1 for O2, 691:1 for N2, etc.
Operationally, the portable device is coupled/retro- fitted onto the tailpipe-end of the conventional exhaust pipe lines of internal combustion engines (diesel-powered, gasoline-powered, and hybrid automobiles-cars, vehicles, trucks, SUV’s, motor cycles, tri-cycles, portable electric power generators, sea and cargo ships/boats, trains, airplanes and jet planes, rockets, etc.) and outlet of industrial machines that release flue gases through exhaust/scrubber channels, as well as crude oil and natural gas flare lines, process furnaces in crude oil refineries, petrochemical and chemical plants, and refined products storage tanks that vent gases, coal processing units/plants, steam generators in large power plants, incinerators, and the electronic big tech companies etc. This enables the effluent to be rooted into the gas capturing medium (such as the liquid absorbent, solid adsorbent, membrane separation, cryogenic refrigeration/ distillation and electrochemical separation or their combination) inside the device. Which captures and turn the individual pollutants into liquid or powdered components or catalytically transform them to other chemical compounds in real-time to achieve zero- greenhouse gases release into the atmosphere.
Technically, the process configuration of the IJN- plug and play exhaust effluent liquefiers fall into two options: Capture and real-time direct permanent liquefaction in which, (i) the individual components of a gas stream (e.g., flue gas), is directly made liquid by being absorbed or adsorption in specific catalyst and the atoms/molecules diffuse across the surface and form new bond molecules when they collide, which subsequently escape as stable liquids; (ii) cascade cryogenic sequential cooling is used to isolate and liquefy the individual components of a gas stream (e.g., flue gas).
Capture and real-time catalytic transformation (chemical conversion of the captured component into valuable chemicals i.e. instantaneously as they are captured) which involves the following four critical steps: (i) specific absorbent or adsorbent catalyst is used to absorb or adsorb the atoms/molecules of the targeted component from the incident gas stream; (ii) the atoms/molecules diffuse across the surface and form radicals (e.g. O*, H*, OH*, OOH* , 2OH*, etc.); (iii) the radicals collide and form new covalent bond molecules i.e. radical couplings (combination); (iv) the molecules subsequently polymerize or hybridize and escape to yield specific stable liquid end products. These events occurred or completed without perceptible delay (i.e. done or made as quickly or directly as possible). A lot of catalysis has been developed recently by researcher from different universities such as USC Loker Hydrocarbon Research Institute, University of Pittsburgh, etc. for the instant transformation.
Furthermore the operational process is enhanced in some specific situations with the nano-particles fluids and molten salts heat transfer and storage technologies. The chemical conversion involves control of pressure, temperature and the composition of the system in order to obtain the right kind of liquid for storage in containers. Any of the six main gas capture/separation technologies: liquid absorption, adsorption (solid sorbents), membrane separation, cryogenic distillation/refrigeration, organic solvent and electrochemical separation or their combination could be applied to selectively trap and chemically converts the gas molecules into stable liquid states. The approach also, decreases (or eliminates) the required thermal energy for the regeneration step. The heat exchanger extracts the heat from the exhaust effluents and stores it in the molten salt, subsequently once the filter is saturated with the desired component (CO2, O2, N2, etc.), it is used to heat and release the trapped pure liquids off to accumulate in the storage containers until a certain quantity of fuel is consumed (may be in months or years). Hence, it breaks down the bond between the filter and the trapped component (CO2, O2, N2, etc.), which is released and collected as pure liquid. After some cycles (for 3-5 years) in the scheme a make-up flow of fresh sorbent is always required to compensate for the natural decay of activity and/or sorbent losses. Usually, the sorbent can be re-oxidized in air for reuse or replaced with a fresh sorbent unit.
Design Specifications
(i) An external refrigeration unit with molten salt heat absorber cycle base is placed in front of the IJN-universal liquefiers device to pre-condition effluents or emissions i.e. cool the stream to 100-0oC to condense the steam to water via heat exchanger of same size as either the catalytic converter or the muffler/silencer/resonator of the applicable vehicle, truck/lorry, etc. The heat is stored in a molten salt medium for use in regeneration of sorbents. Thus, it achieves zero heat loss to the environment and recovers pure water that settles in a container gradually until it is filled after months, depending on the size of the container. Alternatively, for some applications, such as ships, airplanes, trains, etc. it could be channeled out in real-time.
Note: In order to be as efficient as possible, most catalytic used for gas capturing needs to be preheated by an electric heater. This ensures that the metals in the catalyst are fully active even before the automobile exhaust is hot enough to maintain appropriate reaction temperatures. Hence the extracted heat serves this purpose in place of electric heater.
(ii) Different boxes are packaged with any of the various gas capturing techniques, using the choice catalyst to capture one particular component, and then liquefy it or transform it in real-time to another chemical compound. They can be used in capture technique combinations e.g. using the membrane separation kit/box to capture CO2, the liquid absorber kit/box to capture O2, and the pH- swing kit/box to capture N2.
(iii) Plug and play boxes for each of the possible effluent components, configured to operate as hybrid. Thus it can be couple to existing exhaust pipe tail-end of any vehicle/SUV/cargo van/trains, ships, airplanes via a U-tube pipe connection of same diameter as the of the exhaust pipe (4 inches or 5 inches), since it is the same volume of gas that passes through the catalytic converter and muffler that is processed. No other modifications are expected. Subsequent new model automobiles designs can incorporate the U-tube pipe at the exhaust pipe tail-end for easy of attaching the plug and play IJN- universal effluents liquefier’s boxes. Furthermore new model cars can be fitted with a sensitive and efficient control system to regulate the operation of the system under any conditions i.e. incorporate screen displays in the dashboard for displaying operating conditions of the equipment for instance, a sensor notifying the level of liquid in the storage containers, saturation status of the sorbents, etc. (iv) Re-designing the exhaust pipe line in new model cars with IJN-hybrid catalytic converter models that can (a) directly liquefy the dirty toxic engine emissions (nitric oxide, carbon monoxide and hydrocarbons such as octane plus) from the engine.
{i.e. NO2(g) ⟶ NO2(l); CO(g) ⟶ CO(l); and hydrocarbons C1 to C8+ e.g.
C8H18(g) ⟶ C8H18 (l); etc.} or (b) alternatively configured to convert them to any preferred chemical compound in real- time such as CO2(l); N2(l); O2(l); steam/H2O; CH4(l); C2H4(l); NGLs; as well as formic acid (HCOOH), methanol (MeOH or CH3OH), ammonia (NH3), hydrazine (N2H4), hydrogen peroxide (H2O2), etc. using the proper multi-metallic catalytic site that allows the efficient transformation under ambient temperature and pressure conditions. These processes combine the component capture and conversion steps in a single or dual chemical assembly, thereby making it a quicker “one-pot” or “two-pot” process.
Adaptable to all the internal combustion engines (diesel- powered, gasoline-powered, and hybrid automobiles-cars, vehicles, trucks, power generators, sea and cargo ships/ boats, trains, planes, rockets, etc.) and outlet of industrial machines that release flue gases through exhaust/scrubber channels, as well as crude oil, refined products storage tanks that vent greenhouse gases into the atmosphere, coal processing units/plants and turn them into liquid or powdered components or other chemical compounds. The storage containers are distinguished by colors for particular products.
Dimensions
- The body size of each of the component could be the same as the body size of either the catalytic converter or the muffler/silencer/resonator of the applicable vehicle, truck/lorry, etc.
- And the entire box unit housing all the box devices to liquefy the entire effluent components could be the same size as the fuel tanks of the applicable vehicle, truck/ lorry, etc.
Hints
Recall that, N2 and O2 are the main constituents of the air; therefore, in some situations they could be allowed to return to the atmosphere after the liquefaction of steam and CO2.
Notably, most fossil fuels are combusted with ambient air (as differentiated from combustion with pure oxygen). Since ambient air contains about 79 volume percent gaseous nitrogen (N2), which is essentially non-combustible, the largest part of the flue gas from most fossil-fuel combustion is un-combusted nitrogen.
Carbon dioxide (CO2), the next largest part of flue gas (created by the combustion of the carbon in the fuel with fraction of atmospheric oxygen), can be as much as 10−25 volume percent or more of the flue gas. This is closely followed in volume by water vapor (H2O) created by the combustion of the hydrogen in the fuel with fraction of atmospheric oxygen.
Hence, the composition of the effluents from the combustion of fossil fuels, depends on what is being burned, but it will usually consist of mostly N2 (typically more than two-thirds) derived from the combustion of air, CO2, and “water vapor- H2O” as well as excess O2 (also derived from the combustion air).
- Typical transport engines (e.g. vehicle, trucks, ships, jets, etc.) or power generator engines exhaust emissions are composed of carbon dioxide, water vapor, nitrogen and oxygen in unconsumed air.
- Typical flue gases from coal-fired boilers may contain 12-14 vol% CO2, 8-10 vol% H2O, 3-5 vol % O2 and 72- 77% N2.
- Typical flue gases from natural gas-fired power plants may contain 8-10% CO2, 18-20% H2O, 2-3% O2, and 67- 72% N2.
- The petroleum industry combustible components are mostly hydrocarbons, with boiling point temperatures {methane (-162oC), ethane (-88.6oC), propane (-42.1oC), ethylene (-104oC), propylene (-48 oC), butadiene (−4.41 °C), butane (-0.5oC) and pentane (36oC)}. In addition, it contains water vapor (100oC), hydrogen sulphide (H2S −59.55°C) and carbon dioxide (CO2 -78.5oC), nitrogen (N2 -196oC) and oxygen (O2 -183oC).
Hence all the constituents in the vent/flare stream can be recovered as useful products (i.e. H2O, NGLs, CO2, C2, C1, O2 and N2).
Operational Illustrations
Figure 48 demonstrates the proposed liquid absorbent technique used to absorb (i.e., chemically or physically) a particular specified component in the automotive exhaust pipe effluents discharge or scrubber outlet emissions. Precisely, the exhaust effluent or flue gas stream, flows into the component absorption section, where a liquid solvent traps and dissolves the desired component into it. The component rich-solvent is pumped into a de-sorption column (regenerator), where it is regenerated by stripping with steam at elevated temperature at near ambient pressure (i.e., after being heated, after a pressure decrease or after any other change in the conditions around the sorbent). The choice of solvent varies depending on the particular gas component and conditions of the gas stream. The regenerated absorbent (i.e. sorbent resulting after the regeneration step) is sent back to capture more gases in a cyclic process.
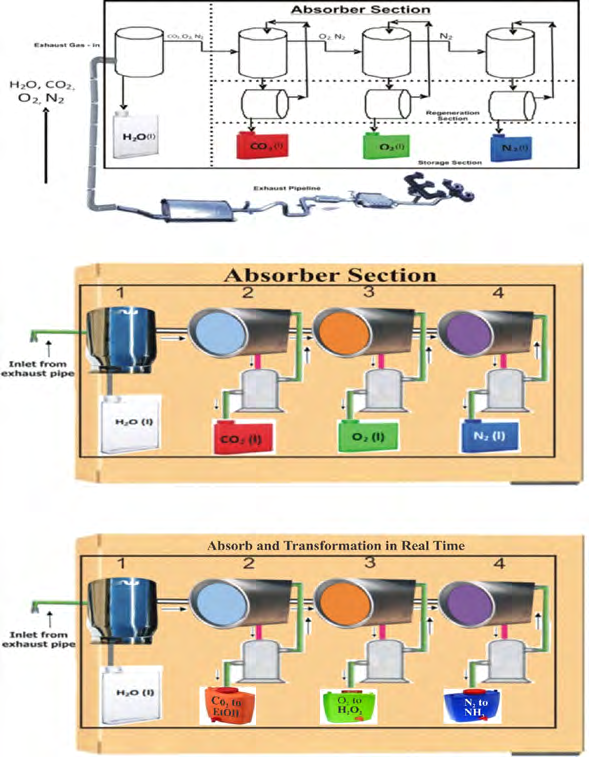
Figure 49 demonstrates the proposed solid adsorbent technique used to adsorb (i.e., chemically or physically- on surfaces of solid materials) a particular specified component in the automotive exhaust pipe effluents discharge or scrubber outlet emissions, through a variety of mechanisms (e.g., molecular sieving “size-exclusion”, physisorption “physisorbents”, and chemisorptions “chemisorbents”).
The captured pure component, is subsequently recovered through temperature, pressure or vacuum swing desorption in which the adsorbent will be regenerated e.g. by stripping with steam at elevated temperature at near ambient pressure. The regenerated adsorbent (i.e. sorbent resulting after the regeneration step) is sent back to capture more gases in a cyclic process.
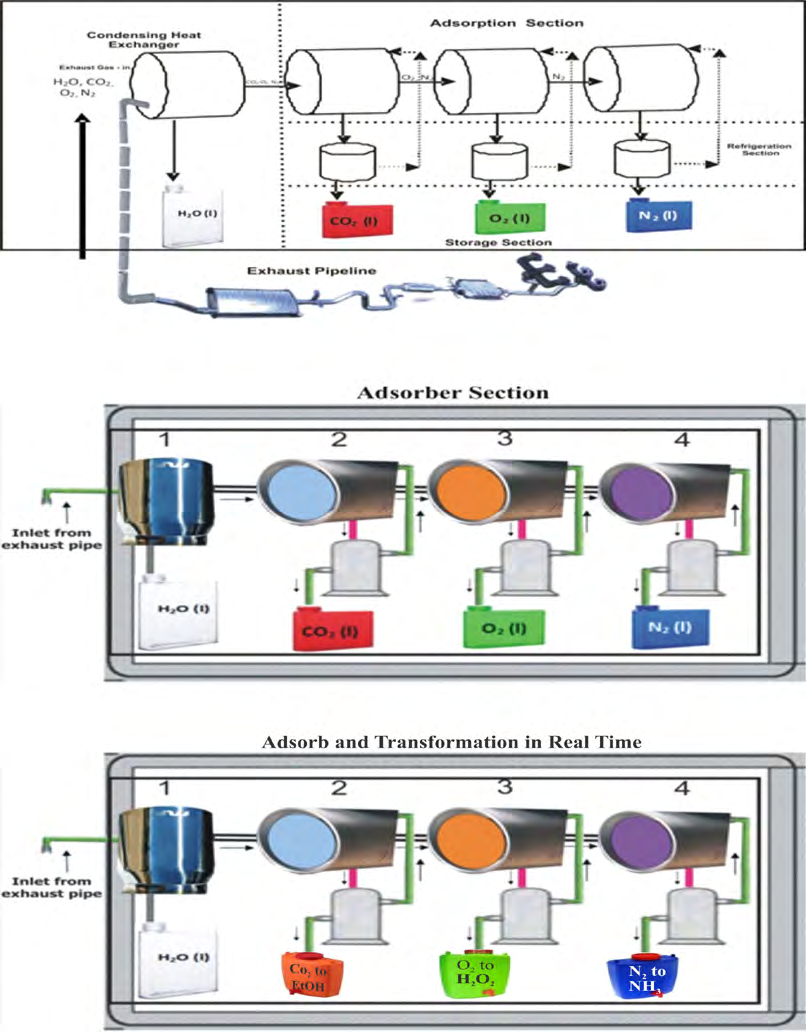
Figure 50 (a & b) demonstrates the proposed membranes technique which is achieved through a variety of mechanisms including solution-diffusion transport, molecular sieving, and Knudsen diffusion.
Precisely, a specially manufactured material that allows the selective permeation of different gases according to their size, diffusivity, or solubility is utilized. In this case, at a more microscopic level, the pressure difference across the membranes selectively filters out particular specified component in the automotive exhaust pipe effluents discharge or scrubber outlet emissions. In some other situations, a membrane can be used with a solvent to capture the gas (i.e. the “desired gas component” diffuses between the pores in the membrane and is then absorbed by the solvent). Essentially it is used for speeding up the chemical reactions so that the desirable components can be removed or produced at a fast rate. For instance, mixed- matrix membranes incorporated inorganic nano-particles to improve membrane properties.
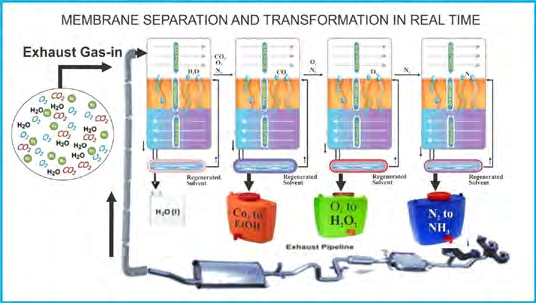
(a)
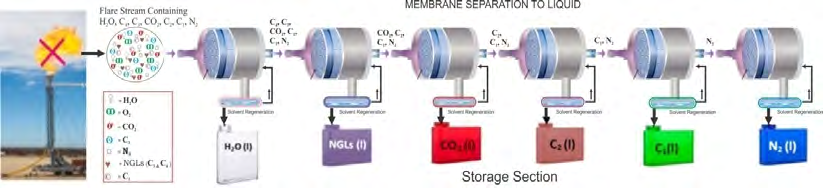
(b) Figure 50: The proposed universal membrane gas separation IJN-plug-n-play exhaust/gas stream effluent liquefier and transformer devices.
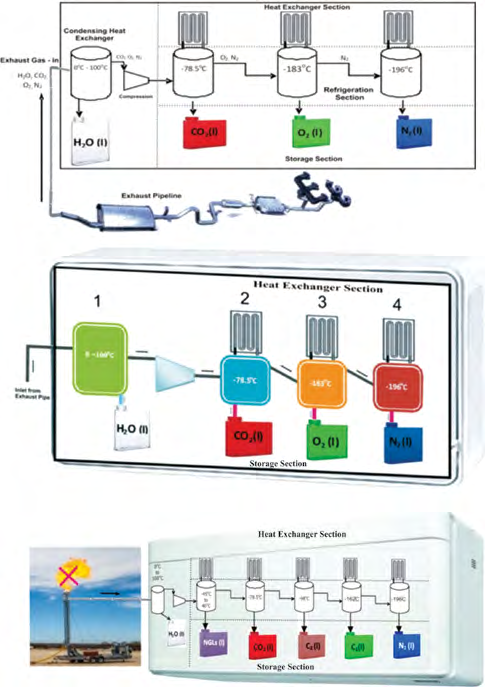
Figure 51 illustrates the proposed cryogenic separation process, in which the entire effluents or emissions stream is cooled over several stages. First it cooled (between 100oC to 0°C) and then passed through a dehydrator to remove the water i.e. condensed steam, e.g. using the combined nano- particles fluids and molten salt heat exchanger technology. Successive cooling using the cascading refrigeration technique and fractionation steps isolates the other different components. The first-stage cascade refrigeration cycle is configured to cool the stream to -80oC and liquefies carbon dioxide (pure liquid carbon dioxide is obtained at -78.5oC). The second-stage cascade refrigeration cycle is configured to cool the remaining stream to -185oC and liquefies oxygen (pure liquid oxygen is obtained at -183oC). The third-stage cascade refrigeration cycle is configured to further cool the stream to -200oC and liquefies nitrogen (pure liquid nitrogen is obtained at -196oC).For emissions from flare gas line, the gas is first cleared of its impurities and dewatered i.e.
purified water is obtained at (100oC to 0°C). Then successive cooling using the cascading refrigeration technique and fractionation steps, isolates the other components to yield, pure carbon dioxide (-78.5oC); pure methane (-162oC or -259oF), pure oxygen (-183oC or −297.33 °F); pure nitrogen (-196oC).
Figure 52 shows the electrochemical separation technique which operates by induced pH-swings through (membrane) electrolysis, bipolar membrane electro-dialysis, reversible redox couples, capacitive deionization and hybrid processes that combine two or more methods i.e. shifting the pH of a working fluid, such as NaCl, KCl, KHCO3 or even seawater (continuously) between basic and acidic pH to influence a specific gas equilibrium to allow absorption and desorption at ambient temperature (i.e. does not require use of any special chemicals).
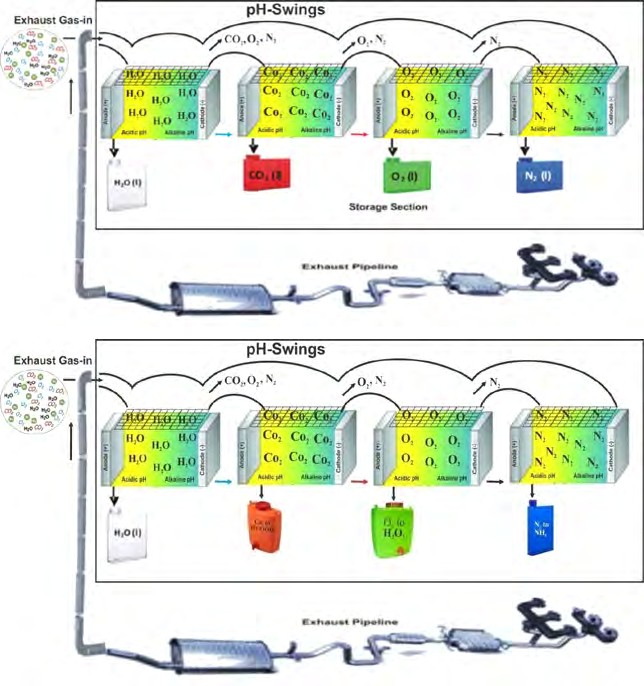
Figure 53 highlights the various application images for the possible placement location of the plug and play IJN-universal effluents liquefier’s devices on the different categories of transportation engine exhaust outlet and other systems i.e. salon car, tanker truck, portable power generators, marine ship, locomotive train, airplane, and petroleum industry flare line.
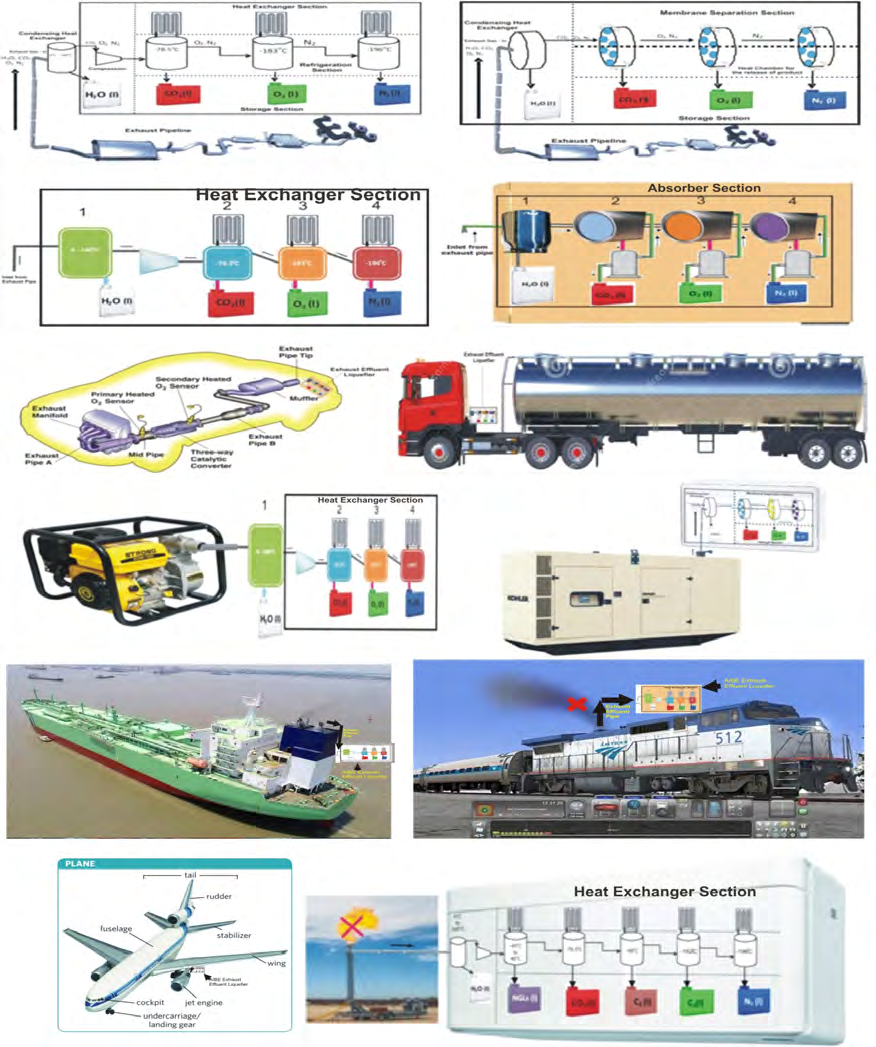
Figure 54 illustrate the separate Plug and play IJN- universal effluents liquefier’s boxes for each of the possible effluent components since the composition of gaseous effluent varies in different streams. This will enable the use of only the required component units. It could be made as follows (a) single component unit, housing one liquefier box e.g. only CO2 or only N2, etc. (b) dual components unit, housing two liquefiers boxes e.g. CO2 and N2, or CO2 and O2, or H2O and CO2, etc. (c) triple components unit, housing three liquefier boxes e.g. CO2, N2, and O2, or H2O, CO2, and O2, or H2O, NGLs, and O2, etc. (d) compact unit designs, housing all boxes in one unit e.g. H2O, CO2, O2 and N2 for automotive exhaust pipe effluents or H2O, NGLs, CO2, C2, C1, O2 and N2 for the petroleum industry emissions. The single boxed units could be placed at different location/point in the trunk/boot of a vehicle, but connected with piping.
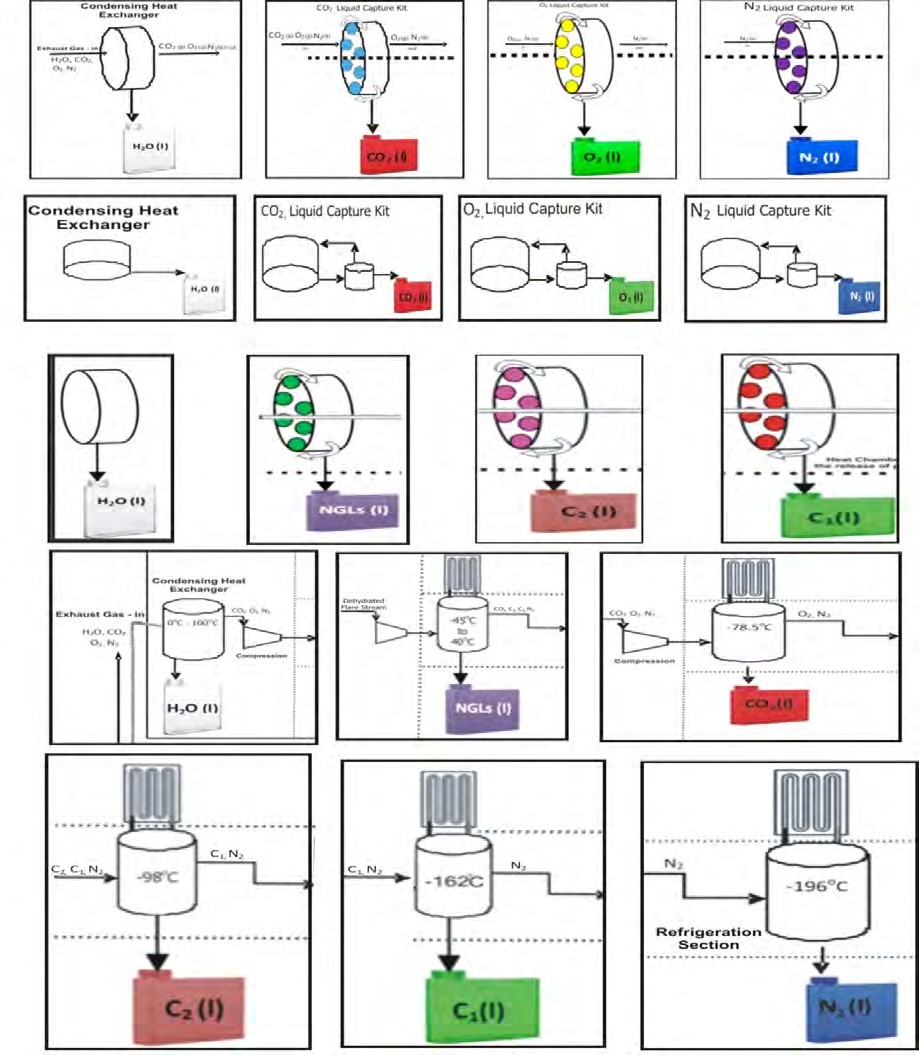
Figure 55 depicts the proposed re-designing of the exhaust pipe line in new model cars with IJN-hybrid catalytic converter models that can directly liquefy the dirty toxic engine emissions (nitric oxide, carbon monoxide and hydrocarbons such as octane plus) from the internal combustion engines to any preferred chemical compound in real-time. These processes combine the component capture and conversion steps in a single or dual chemical assembly, thereby making it a quicker “one-pot” or “two-pot” process. All the boxes are net-worked or planted at different places on the floor of the car and storage containers are located by the floor sides for easy of replacement. Figure 56 is the typical configuration of the existing exhaust pipe line whereby the catalytic converters product is rooted to the silencer/ muffler/resonator [129].
Figure 57 shows typical illustrative example of how the proposed IJN Universal Emissions Liquefiers can be retro-fitted onto the existing exhaust tailpipe-end, into automobiles-cars/vehicles/SUV’s trunks (similar to the boxed units in figure 53), to achieve zero emissions. Usually the hot molten salt is piped through the regenerates units to release heat for regeneration of the reagents and it flows back to the refrigeration unit to absorb heat, which is subsequently stored in the molten salt tank and the circle is repeated continuously
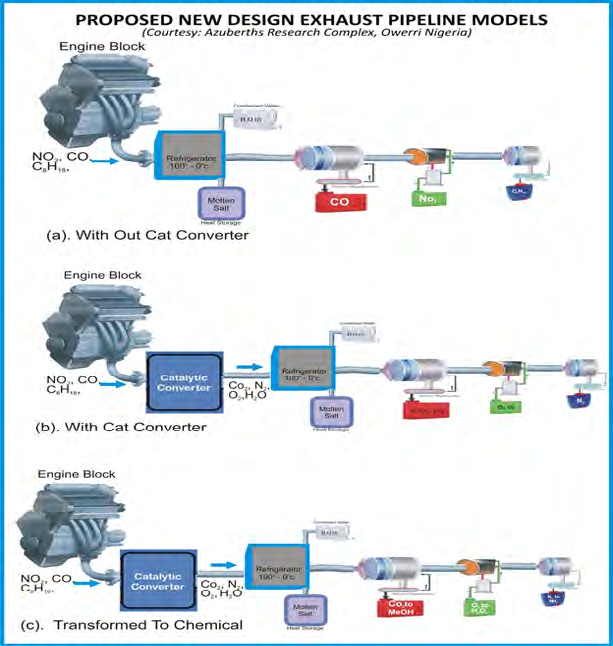
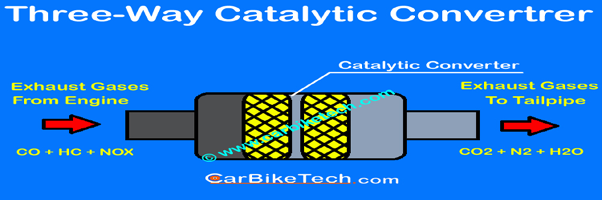
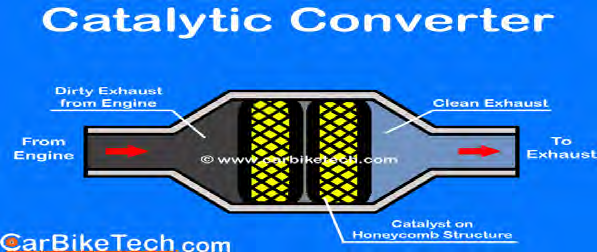
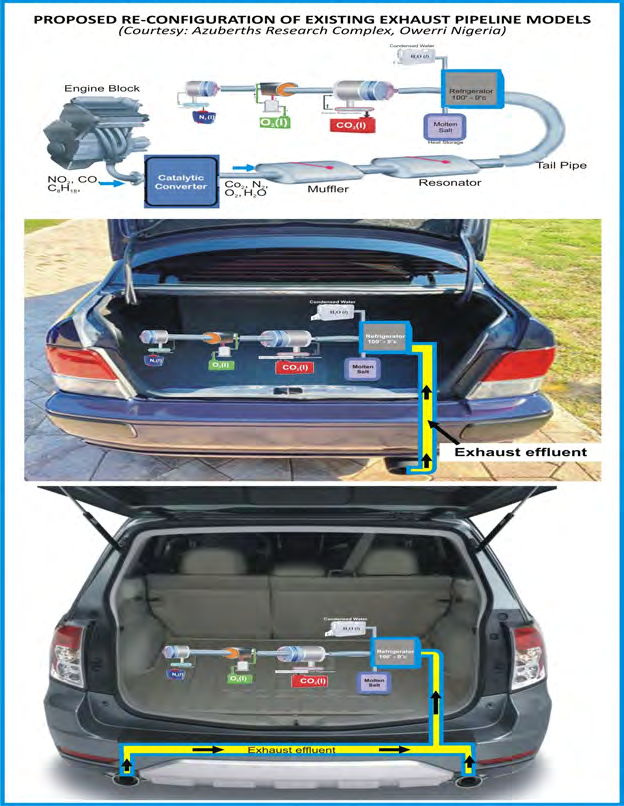
Conclusions
Energy has been the hallmark of human improvement in living standard and advancement in technology. Since 1900’s; fossil fuels (coal, oil and natural gas) have played and continue to play a major role in transforming the world from an agricultural society to the modern industrial world we live in today. Fossil fuels can provide reliable 24/7 electricity, and fuels for heating and cooling, as well as transportation fuels. They also provide petrochemicals used in industrial products and plastics. The use of fossil fuels emits pollutants like carbon dioxide, ozone, hydrocarbons, sulfur, mercury, smoke and ash, into the atmosphere.
Emissions from fossil energy resources are created by gas venting/flaring or within some type of combustion chamber, such as inside the block of an engine i.e. when the air-fuel mixture burns inside internal combustion engines; as the fuel used to power them contains hundreds of differently structured hydrocarbons that burn at different rates in different ways.
Fossil fuels are major sources of greenhouse gases (GHG- CO2, CH4, N2O) and smog-causing pollutants such as NOx, SOx, volatile organic compounds (VOCs), and particulate matter (PM). All these are responsible for respiratory problems, acid rain, haze (reduced visibility), climate changes, and mercury contamination of fresh and salt-water fisheries. CO2 and pollutants will not only contribute to climate change in the next few decades but also major air, water, and soil pollution that already afflicts many cities today, environmental degradation and loss of arable land, which threatens our very way of life, particularly in developing countries. In fact, urban air quality and indoor air pollution are two of the world›s worst toxic pollution problems. The World Health Organization reported that 9 out of 10 people worldwide breathe air containing high levels of pollutants and an estimated 7 million premature deaths annually are linked to air pollution, with most deaths in developing countries.
VOCs are chemical gases released from solid and liquid chemical products such as gasoline vapors, power plants, automobile exhaust, detergents, pesticides, printer supplies, adhesives, furniture, electronics, paints, and many other products.
Particulate matter (PM) is a mixture of solid particles and liquid droplets found in the air. Some particles, such as dust, dirt, soot, or smoke, are large or dark enough to be seen with the naked eye. Others are so small they can only be detected using an electron microscope. Particulate matter contains microscopic solids or liquid droplets that are so small that they can be inhaled and cause serious health problems. Some particulates occur naturally, originating from volcanoes, dust, storms, forest and grassland fires, living vegetation and sea spray. Human activities also generate significant amounts of particulates.
Fundamentally, there is a distinction between the natural greenhouse effect which is directly originated by the Sun, and the enhanced greenhouse effect originating from human activities, which could advance to the worst-case scenario “runaway greenhouse effect” phenomenon which occurs when the planet absorbs more radiations than it can radiate back. That is, the heat lost from the earth’s surface is less and the temperature of the planet keeps rising. Scientists believe that this phenomenon took place on the surface of Venus billions of years ago, making the planet too hot to live on.
The clean coal refinery, crude oil refinery, bio-refinery and natural gas refinery concepts produce similar overall products (i.e. expel steam/water vapor (H2O), carbon dioxide (CO2), unconsumed nitrogen and unconsumed oxygen) with different degrees of purity because they are composed of hydrocarbons, with different carbon-to-hydrogen ratios. The traditional coal combustion is the dirtiest (approximate chemical formula CH) followed by the traditional biomass (approximate chemical formula CHO); crude oil (approximate chemical formula CH2) and bio-fuels (approximate chemical formula CH3O) while natural gas (exact chemical formula CH4) is cleanness.
To date the use of the F-T jet fuel (aviation fuel) a.k.a. the sustainable aviation fuel (SAF) and the F-T category of Synfuels which reduces emissions by approximately 80% compared to traditional petroleum crude oil, kerosene- based jet fuel is the cleanest and practically it is the best scenario that can be actualized or is achievable. Hence the only remaining available option to eliminate the unavoidable 20% CO2 (g) exhaust emission from the combined global abundant fossil energy resources (that most occur from the combustion reactions of carbon and oxygen as well as hydrogen and oxygen, the constituents of the fuel) is to capture it in real-time using any of the established CO2 (g) capture techniques via gas liquefaction concepts or catalytic transformation to other chemical compounds.
Cellular metabolism inside of a cell living organism and fossil fuel combustion inside of an internal combustion engine are very similar. Both entails the breakdown chemical reactions with oxygen to release carbon dioxide CO2, steam H2O, and energy.
Notably, more than ever, energy is essential to all aspects of life in the modern world. Simply put, with the growing population; there will be more demand for energy to support agriculture and infrastructural development to meet the needs of the growing population. This implies that we will continue to emit pollutants, since no new energy source has emerged. Hence, so long as mankind exists, due to continuous economic growth and growing world’s population, the overall global demand for energy (use of fossil fuels- mainly composed of hydrocarbons) will continue to increase (i.e. energy demand per capita rising) in both developed and developing countries, even with energy conservation measures in developed countries. The emphasis will be on meeting the global dual energy challenges (i.e. energy security and climate change goals) or more broadly the intertwined global goals of economic growth, environmental conservation (combination of climate change and local environmental degradation), and energy security (3E), which entails the challenge to produce more of the affordable energy that society needs and the challenge to produce energy that’s less carbon intensive (i.e. carbon neutral-zero carbon dioxide emissions).
Furthermore, oil used to have an Energy Profit Ratio (EPR) of 100 to 1 i.e. it took only one barrel of oil to extract 100 barrels of oil. This was such a fantastic ratio that oil was practically free energy. However oil’s EPR is now down to
10 to 1, which is still pretty good. If a proposed alternative source does not have an EPR comparable to that of oil, the amount of good it does us is very limited.
Other than the fossil fuels emissions from centralized emitters, there are other decentralized emitters that are continuously releasing greenhouse gases into the atmosphere per-second-per-second such as animals and humans, biomass decay, landfills, etc. as well as occasional volcanic eruptions. Hence, there is no one-size-fits-all solution technique to capture GHG’s from this multi-layered source. Thus, net-zero carbon dioxide emissions is no achievable, because we will always add more GHG emissions than we are able to withdraw through natural carbon sinks like forest and trees, agriculture, land and ocean. Therefore, there is need to use both the direct air capture and direct exhaust/vent/flare capture de-carbonization strategies simultaneously.
Each gas has a critical temperature above which it cannot be liquefied however high pressure may be applied on it. The critical temperature for oxygen (-181.1oF or -118oC)), nitrogen (-232.4oF or -147oC)), methane (-116.7oF or -82.3oC), etc. On the other hand, any gas which has a critical temperature above room temperature can be liquefied by pressure alone e.g. ammonia (270.3oF or 132.4oC), chlorine (291oF or 144.0oC), carbon dioxide (87.9oF or 31.1oC), hydrogen chloride (124.5oF or 51.4oC), hydrogen sulfide (212.7oF or 100.4oC) and hydrogen dioxide (315.5oF or 157.5oC), water/steam (705oF or 374oC), etc.
The two categories of gas liquefaction processes are the transitional and permanent gas liquefaction processes:
- Transitional gas liquefaction processes in which, under specified temperature and pressure, the volume of the gas is drastically reduced for transportation convenience. In this case, the liquefied gas reverts to gaseous state at the point of use.
- Permanent gas liquefaction processes in which chemical transformation of the gas molecules occur simultaneously with super drastic volume reduction, such as the gas-to-liquid (GTL) i.e. to clean synthetic fuels (e.g. gasoline, diesel, kerosene etc) and green chemicals {e.g. methanol, ammonia, dimethylether (DME), etc} from gas. The overall reaction mechanism of the processes is based on the formation of radicals and radical’s polymerization or hybridization using highly selectivity catalyst, targeted at specific end products i.e. radical couplings (combination) to form a new covalent bond.
The present methods of CO2 removal techniques are designed to (a) take from the air and/or sea what cannot easily be prevented from reaching it e.g. direct air capture (DAC)-a post capture technique (b) directed at preventing the emissions from reaching the atmosphere (in other words, keeping more CO2 from going into the atmosphere) i.e. pre- capture techniques a.k.a. CO2 capture and utilization (CCU), mostly from centralized emitters/sources. For instance, capturing carbon from power plants and using it in generating more electricity from renewable sources such as Synfuels (synthetic hydrocarbon fuels and chemicals). The emergence of efficient absorbents resulted to the development of real- time transformation/conversion into value-added organic chemicals/products which has revolutionized the (CCU).
Presently, several process plants are applying the (CCU) technique, to capture atmospheric CO2 on large scale bases as well as for capturing CO2 waste from smaller sources such as businesses, homes etc., in compact plug-n-play modular skids, sized to meet the gas processing requirements of each client. Typical example of companies that are operating large-scale direct air capture plants are Carbon Engineering USA and Climeworks in Switzerland/Iceland. While typical example of companies that are using the small-scale units CO2 recovery solution are Austin Beerworks and Alchemist Brewery, which captures CO2 from the fermentation process that was previously released to atmosphere, stores and re- use it in their carbonating and packaging processes.
The variety of systems for controlling emissions from the exhaust pipe of internal combustion engines developed from 1961 – 1975 (i.e. positive crankcase ventilation (PCV) valve; exhaust gas recirculation (EGR) system; replacement of carburetor with fuel injector-to adjust air-fuel ratios; catalytic converters (Cat-Con) devices; and particulate matter and black smoke removal device) reduced the effluent products to only water vapor, carbon dioxide, oxygen and nitrogen in an ideal situation.
So far, for the solution towards the drive to zero emissions from the automobile engine, the two research establishments that are making attempts to capture CO2 from the exhaust effluent pipeline are (i) Researchers for Aramco (the state-owned oil company) in Saudi Arabia through their mobile carbon capture (MCC) process and (ii) Researchers from École Polytechnique Fédéralede Lausanne (EPFL) in Switzerland. Both apply the transitional gas liquefaction processes which technically compress and store it safely in a tank on board the vehicle (so that they can be removed and dumped at a station the next time the car is refueled), emitting nitrogen, water vapor, and any remaining CO2.
The universal IJN-plug-n-play exhaust/gas stream effluent liquefier and transformer devices, for automotive exhaust effluents, industry vents and flue gas emissions, as presented in this article basically implies the addition of specialized (compact in-box) treatment devices/ units (such as the liquid absorbent, solid adsorbent, membrane separation, cryogenic refrigeration/distillation and electrochemical separation or their combination i.e. combinations of two or more of the technologies) at the tailpipe end of the conventional exhaust pipe lines of internal combustion engines (automotives-vehicles/cars, long-haul transportation trucks, boats/ships, trains, aviation planes, rockets and electric power generators) or oil and natural gas flare lines or scrubber outlet channels, etc. to achieve zero- greenhouse gases release into the atmosphere. It is based on the permanent gas liquefaction processes in which chemical transformation of the gas molecules occur simultaneously with super drastic volume reduction.
This will guarantee the continued use of fossil fuel, the worlds cheapest and most useful energy resources forever and ever. As well as fully address the problem of trying to replace existing fossil fuel-based energy generation units with very expensive alternative/renewable energy sources and the move towards green vehicles (electric vehicles, plug- in hybrid electric vehicles, hydrogen fuel cell vehicles and cleaner burning gasoline vehicles e.g. ethanol blends and SAF’s blends) or sequestering captured CO2 into depleted oil reservoirs, etc. More importantly, these systems will also directly address the carbon dioxide emissions (footprints) from the electronics hubs of big tech companies, such as Amazon, Apple, Alphabet, Meta, Microsoft, and 100’s of others.
All the CO2 that can be generated by the combustion of fossil fuel is pre-captured from source by the IJN (a.k.a. AIBE) Synfuels petroleum refinery and used of the proposed universal IJN-plug-n-play exhaust/gas stream effluent liquefier and transformer devices. However small, the emitting source is, the IJN-plug-n-play device can be configured/built in modular to fit the capturing space. Hopefully, this is going to be an effective way, forever to prevent our steel industry, cement manufacturers, big tech companies and many other processes from continuing to pour emissions into the atmosphere. Seemingly, it also significantly reduces their costs and creates a new revenue stream for their business all while doing their part to cool the planet.
The process itself uses little energy because all of its stages have been optimized. The heat exchanger extracts the heat from the exhaust effluents (when it is cooled to 100-0oC) and stores it in the molten salt. Subsequently once the filter is saturated with the desired component (CO2, O2, N2, etc.), fraction of the heat stored in the molten salt storage container is used to heat it to around 100°C (212°F) and it is released as concentrated gas. Next, selective catalytic processes convert it to liquid or chemical compound end products which accumulate/settle in a storage tank for months or years depending on when a certain quantity of fuel has been consumed and size of tank. The green carbon capture process means it can be converted into chemicals found in industrial materials including methanol, polymers, waxes, fuels and plastics as well as manufacturing of material used to produce solar panels, wind turbine structures, etc. Hence, it will have benefits for some of the biggest manufacturers in the world and majority of start-ups, small-scale businesses, and entrepreneurs.
References
-
Ekejiuba AIB (1990) Economic Viability of producing LPG and LNG from the Nigerian Flare Gas Stream. Lambert Academic Publishing, Mauritius, pp: 232.
-
Ekejiuba AIB (2018) Associated Stranded Natural Gas Monetized in Real-Time Via Conversion to Petrochemical and Other Useful End Products. International Journal of Innovative Research & Development 7(7): 445-477.
-
ACS Climate Science Toolkit (2007) Greenhouse Gases changes since the Industrial Revolution-America Chemical Society.
-
Murphy B (2023) The Industrial Revolution and Climate Change. University of Glasgow, UK.
-
Wikipedia (2023) Carbon Dioxide in Earth’s Atmosphere.
-
Global Monitoring Laboratory (2023) Carbon Cycle Greenhouse Gases.
-
Harris C, Mann R (2017) Global Temperature Fluctuated Long before the Industrial Revolution from 2500 BC to 2040 AD.
-
Iman G (2021) This Global Temperature Graph Shows Climate Trends (1851-2020).
-
NASA (2010) Global Warming.
-
Earth Observatory (2022) NASA’s Goddard Institute for Space Studies (GISS). World of Change, Global Temperatures.
-
Wikipedia (1995) Online encyclopedia.
-
Espanol F (2015) Greenhouse Effect.
-
geologycafe.com.
-
NDA Coaching Institute in Dehradum (2020) Overview. Planets of Solar System.
-
Planet Facts (2023) if planet 9 exists, why can’t our technology detect it.
-
Anne Arundel country trails (2023) Annual planet walk.
-
Worldometer (2023) World Population Clock: 8 Billion People.
-
Free Respiration Cliparts (2022) Download Free Respiration Cliparts png images, Free ClipArts on Clipart Library.
-
Slideshare net (2022) Chemical handling ppt.
-
Feldenkrais (2023) Breathing with Ease.
-
pinterest (2022) Respiratory system anatomy. Respiratory system, Human body systems.
-
Life hacks (2022) Infographic, 21st century learning, National.
-
Ritchie H, Roser M (2023) Emissions by sector. Our World in Data.
-
Transport Emission in the EU.
-
Navarro R (2023) the Carbon Emissions of Big Tech. Electronics Hub.
-
Chan R (2019) Here’s One Way to Combat Climate Change: Suck out Carbon Dioxide.
-
Alexander R (2021) Carbon Engineering: A Process for Capturing CO2 from the Atmosphere.
-
Anthony C (2023) Carbon capture startup Climeworks removes CO2 from open air in ‘industry first’.
-
Chart Industries (2023) Small Scale Carbon Capture.
-
Technology Database (2023) Sustainable Energy Solutions Cryogenic Carbon Capture.
-
The Geography of Transport Systems (2019) Evolution of Energy Sources.
-
Sami A (2019) The rising world energy consumption.
-
Vdocuments (2011) Oilfield Review (Schlumberger).
-
Solar schools (2020) Non-Renewable Energy knowledge bank.
-
SPE International-energy (2007) Discover the story of petroleum, and the many ways it shapes the world we live in. Oil and Natural Gas, DK Publishing, New York, USA, pp: 72.
-
Davidson EA (2023) Carbohydrate. Encyclopedia Britannica.
-
Elenakori (2011) Lipids slides.
-
Lecture Notes in Medical Technology (2023) Lecture #10: Proteins.
-
Protein Chemistry (2023) presentation online.
-
PowerPoint Slides (2023) Nucleic Acid Structure.
-
Ducksters (2023) Biology for Kids Photosynthesis.
-
Respiratory health (2023) Greenhouse Gases & Climate Change.
-
SlideShare (2020) BioMass - Generation and Utilization.
-
Geoengineer (2015) Landfill Gas Monitoring Systems.
-
Magdalena DV (2019) Landfill Impacts on the Environment-Review. Geosciences 9(10): 431.
-
Timberlake KC (2006) An Introduction to General, Organic and Biological Chemistry. Chemistry 9th(Edn.), Person Benjamin Cummings, San Francisco, USA.
-
Sherman SJ, Sherman A (1999) Essential Concepts of Chemistry. Houghton Mifflin College Div, Boston, USA, pp: 496.
-
Engineering ToolBox (2017) Combustion Heat.
-
Britannia (2022) Kerosene. Encyclopedia Britannica.
-
Energy Education (2023) Kerosene.
-
Ekejiuba AIB (2023) Synergy of the Conventional Crude Oil and the FT-GTL Processes for Sustainable Synfuels Production: The Game Changer Approach-Phase One Category. Pet Petro Chem Eng J 7(1): 1-30 .
-
Khan Academy (2023) Overview of metabolism.
-
Sciencing (2018) What Happens When There Is No Oxygen Available at the End of Slow Glycolysis.
-
Write The Chemical Equation For Overall Process Of Cellular Respiration Quizlet .
-
Balanced Chemical Equation For Cellular Respiration Quizlet.
-
Difference between (2014) Difference between Breathing and Cellular Respiration.
-
Joss 19999 (2023) What Are The Reactants In The Equation For Cellular Respiration? / Biological Processes and Systems - In layman’s terms, respiration is the oxidation of sugar (oxidation releases energy from chemical bonds) which is coupled with the reduction of.
-
Myers RT, Oldham KB, Tocci S (2007) A Harcourt Education Company. Chemistry, Orlando.
-
Heys HL (1975) Physical Chemistry. 5th(Edn.), Harrap, London, United Kingdom.
-
Judith C, Perez ND (2018) Super Critical Fluids General Chemistry. Arizona State University, USA.
-
Ebbing DD, Wentworth RAD, Birk JP (1995) Introductory Chemistry. Houghton Mifflin Company.
-
Ikoku CU (1980) Natural Gas Engineering: A Systems Approach. Pennwell Books, Tulsa, USA, pp: 788.
-
Natural gas (2013) Processing Natural Gas.
-
Shah P, Durr KBR (2007) Petroleum Engineering Handbook, Volume VI: Emerging and Peripheral Technologies. In: Warner HR (Ed.), Society of Petroleum Engineers, Richardson, USA, pp: 382.
-
Silva CA, Miranda PEV (2016) Proposition of a Mechanism for the Electrochemical Oxidative Coupling of Methane. Revistamateria 21(4): 3-4.
-
Mario M (2022) LibreTexts Chemistry. Catalysis.
-
Ekejiuba AIB (2018) Real-Time Production of Synthetic Gasoline, Kerosene or Diesel from Methane in the Flare Stream Associated Gas in Nigeria. International Journal of Innovative Research & Development 7(10): 95-121.
-
Ekejiuba AIB (2020) Guide to Petroleum Engineering Career: The Best Practices Petroleum Infographic Cutting-edge Technology Approach. Dorrance Publishing Co, Pittsburgh, USA, pp: 712.
-
Radhey S, Jindal T, Pabla BS (2011) Cryogenic Processes – A Review. International Journal of Engineering Science and Technology 3(1): 601-610.
-
Perry RH (1985) Perry’s Chemical Engineers’ Handbook. 6th (Edn.), McGraw-Hill International Book Company, New York, USA.
-
Various carbon-capture technologies and the corresponding materials.
-
Adsorption and desorption.
-
Ruwan GA (2021) Absorption Vs Adsorption.
-
Physical Pharmacy Lab Report (2023) Practical 3: Adsorption from solution.
-
Climate Citizen (2021) Scientific breakthrough: Remove CO2 from pollution and atmosphere for alternate fuel.
-
Open Membrane Database (2023) Introduction to membrane science.
-
The schematic of membrane separation for binary gas mixtures.
-
New energy and fuel (2018) Carbon Dioxide Capture May Be Solved.
-
Wikipedia, Cryogenics.
-
Bilal (2022) What is a Cascade Refrigeration System? All You Need To Know. Hvacr guy.
-
Pan M, Zhao H, Liang D, Zhu Y, Liang Y, et al. (2020) A Review of the Cascade Refrigeration System. Energies 13(9): 2254.
-
The cascade refrigeration system (adapted from Cengel and Boles [13]).
-
Process technologies for LNG production.
-
Brayton refrigeration cycles for small-scale LNG.
-
Electrochemical CO2 separation using gas diffusion electrodes.
-
Prem J (2012) New catalyst permits convenient storage and transportation of hydrogen. Ecofriend.
-
US Department of Energy (2015) Capturing and converting CO2 in a single step.
-
Robert P (2016) Turning air into fuel: USC scientists convert carbon dioxide into methanol. USC News.
-
Yoann R, Carole D, Gennari (2017) Molecular Catalysts for N2 Reduction: State of the Art, Mechanism, and Challenges. ChemPhysChem 18(19): 2606-2617.
-
Ronny N, Alexander KN (2006) Molecular Oxygen and Oxidation Catalysis by phosphovanadomolybdates. Chemical Communications 24: 1-10.
-
Lixiang Z, Shuzhou L (2020) Unconventional Oxygen Reduction Mechanism and Scaling relation Single-Atom Catalysts. ACS Catal 10(7): 4313-4318.
-
Sajeda A, Saydeh AL, Zaidi SJ (2018) Carbon Dioxide Conversion to Methanol: Opportunities and Fundamental Challenges. In: Karamé I, et al. (Eds.), Carbon Dioxide Chemistry, Capture and Oil.
-
Ginrod (2022) Carbon Dioxide Uses and Applications.
-
Hong-Chen F, Fei Y, Hong-Ru L, Liang-Nian HE (2019) CO2 Capture and _in situ_ Catalytic Transformation. Front Chem 7: 525.
-
Wikipedia (2023) Aviation Biofuel.
-
The International Air Transport Association (2022) Developing Sustainable Aviation Fuel.
-
Christine A (2020) A Guide to Sustainable Aviation Fuels.
-
Nabila AH, Glenn RH, Xiangchen H, Derek VR, Stunkel J, et al. (2021) Toward net-zero sustainable aviation fuel with wet waste–derived volatile fatty acids. Proc Natl Acad Sci 118(13): 2023008118.
-
Aviation fuel, Jet fuel. Air bp.
-
Air bp (2022) What is sustainable aviation fuel (SAF). News and views.
-
Diehn SA (2012) Air + water = fuel. Deutsche Welle.
-
Shih CF, Zhang T, Jinghai L, Bai C (2018) Powering the Future with Liquid Sunshine. Perspective 2(10): 1925-1949.
-
Britannica (2023) Emission controls.
-
Encyclopædia Britannica, Electric Automobile and hybrid automobile
-
Electrification.
-
Science Learning Hub (2020) Solar cars.
-
Saeed H (2020) Toyota is testing its First Ever Solar- Powered Car.
-
Solar power nerd (2021) 10 Benefits and Disadvantages of Solar Energy Cars.
-
Ashok s (2022) Solar Energy. Encyclopedia Britannica.
-
Aliexpress item.
-
Korea blogs (2011) solar powered cars for kids.
-
Herron D (2015) Gasoline, electricity, and the energy to move transportation systems.
-
Bluebird (2014) Solar Powered Service Stations.
-
Quora (2015) should private car owners be taxed for pollution in China.
-
Four stroke hydrogen methane captures CO2.
-
Georgia Institute of Technology (2017) Four-Stroke Engine Cycle Produces Hydrogen from Methane and Captures CO2.
-
Green Car Congress Georgia (2017) Georgia Tech team furthers four-stroke-cycle active-membrane piston reactor for enhanced SMR for H2 production.
-
Kyle S (2008) Georgia Tech proposes carbon capture concept for automobiles.
-
Andrea DS (2020) This System Could Capture CO2 Straight From Vehicle Exhaust.
-
Aramco (2023) Mobile carbon capture.
-
Ellen RW (2017) Watch Out Tesla, Aramco’s Carbon Capture Truck Is Coming.
-
Aramco (2023) Real engineering excellence.
-
Sharma S, Marechal F (2019) Carbon Dioxide Capture from Internal Combustion Engine Exhaust Using Temperature Swing Adsorption. Front Energy Res 7: 143.
-
Brewbound (2018) Earthly Labs Introduces Plug- and-Play Carbon Capture Technology for Brewers.
-
Chart Industries (2022) Sustainable Energy Solutions.
-
Michael I (2019) Carbon Capture system Turns CO2 into Electricity and Hydrogen Fuel.
-
Mihrimah O, Radu C (2022) The status and prospects of materials for carbon capture technologies. MRS Bulletin 47: 390-394.
-
CarBikeTech (2018) What is a Catalytic Converter in Cars & How does it Work.
- Nigeria’s Vulnerability in the Face of Global Energy Policy
- A Simulation Study of Investigation of Optimum Oil Production Performance by Applying Various Gas Injection Methods in Oil Reservoir
- Characterization of Permo-Triassic Reservoirs through Thermal Maturity Assessment of Westphalian Source Rocks in the Cheshire Basin
- Influence of Microwax on the Rheological and Thermal Behaviour of a Wax Crude Oil
- Real-Time Monitoring and Performance Optimization of Steam Injection in Heavy Oil Reservoirs Using Fiber Optic Sensing and Integrated Predictive Simulation Models
- Rapid On-Site Determination of the Total Petroleum Hydrocarbon Content of Soils by Handheld Fourier Transform Near-Infrared Spectroscopy: Development of a Global, Site- and Scanner- Independent Calibration Model